LQD: Attractive After February's Rate Increase

Summary
- Investment grade corporate bonds experience a large sell-off in February of 2023.
- The LQD ETF has ample liquidity, which it has maintained through recent crisis episodes.
- Corporate credit fundamentals are sound.
- There are reasons to think that February's rate increase was overdone.
- LQD appears attractive based on fundamental arguments and based on a quantitative return forecasting model.

Dilok Klaisataporn
Price action and liquidity
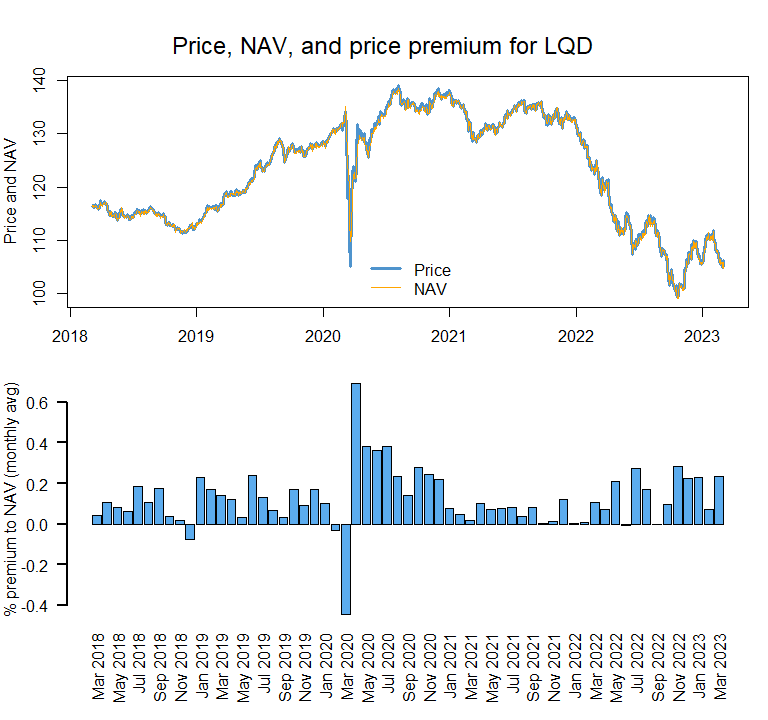
The increase in Treasury yields in February of 2023 has had profound implications for investors' asset allocation decisions. As the next chart shows, the iShares iBoxx $ Investment Grade Corporate Bond ETF (NYSEARCA:LQD), which holds a diversified portfolio of investment grade (IG) corporate bonds, had a tough month in February, and is now trading towards the lower end of its past five-year range. A sell-off does not, in and of itself, mean LQD is a buy -- we will return to an analysis of why it's attractive momentarily.
QuantStreet, Bloomberg
The bottom panel of the above graph shows that LQD has generally traded in the market above its net asset value (NAV), suggesting that market participants are willing to pay a small premium to own IG corporate bonds via LQD rather than by buying individual corporate bonds directly (which is really only an option for institutional investors). Only during the depth of the COVID-19 crisis, did LQD trade a substantial discount to its NAV. And even then, this discount was quickly corrected.
Investors in LQD should also be concerned about the ETF's flows and liquidity. The next chart tracks flows into LQD as a percent of the prior month's shares outstanding. LQD had a large outflow in February of 2023. In fact, February saw the largest outflows from LQD over the past five years, a time period which includes the COVID-19 crisis.

QuantStreet, Bloomberg
The middle panel of the above chart shows the ratio of total monthly trading in the ETF as a fraction of the month-end shares outstanding. A ratio of 1.25x means that 1.25 times as many shares traded in a given month as there were shares outstanding. This is a relatively high level of liquidity, though not quite as high as HYG (a high-yield corporate bond ETF). The bottom panel shows the average daily dollar turnover (the number of shares traded times the closing price). LQD trades between $2 and $3 billion dollar per day, which is ample liquidity for all but the largest institutional investors.
Credit fundamentals
Investors in IG corporate bonds face several sources of risks: liquidity risk, interest rate risk, and default risk (among others). We've argued that from a liquidity perspective, LQD appears quite liquid (though there is a bit of a debate about what would happen to bond ETFs in a deep market crisis). With respect to interest rate risk, IG corporate bond yields respond largely one-for-one with changes in Treasury yields, so investing in LQD certainly entails rate risk. We discuss this in the next section.
Default risk materializes when investment grade firms default on their debts, and leave investors with a claim that's worth cents (typically under 40 cents) on the dollar. The last two large default cycles in investment grade bonds occurred around the Enron / WorldCom bankruptcies of 2001 and 2002 and around the 2008-2009 global financial crisis. Fortunately, the current credit backdrop for IG bonds appear quite solid. First, LQD has a large allocation to financials, whose balance sheet health is currently robust. The next chart shows that non-financial corporate debt as a percent of GDP in the U.S. is well off its COVID-19 peak level.
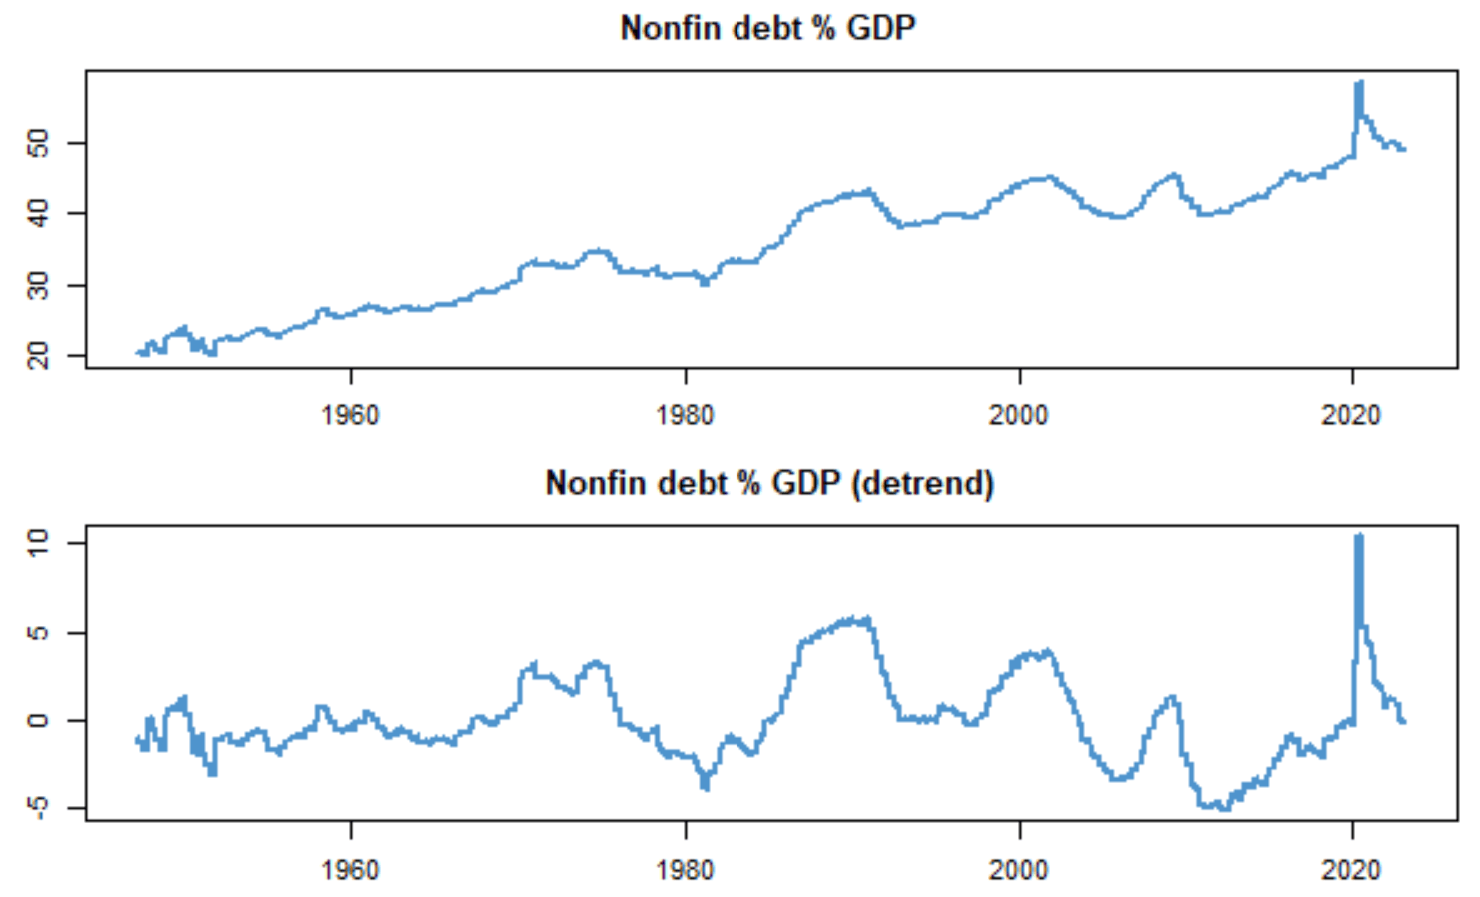
Non-financial corporate debt to GDP, simple and detrended. (QuantStreet, FRED)
Because the non-financial debt to GDP series has a pronounced time trend, it is useful to look at this series after the trend has been taken out. This is the bottom panel in the chart. On a detrended basis, non-financial corporate debt in the U.S. is not very high relative to GDP. Another take on how much corporate debt exists in the U.S. is to look at non-financial corporate debt as a percent of the stock market's capitalization. By this measure, non-financial corporate debt is close to an all-time low.
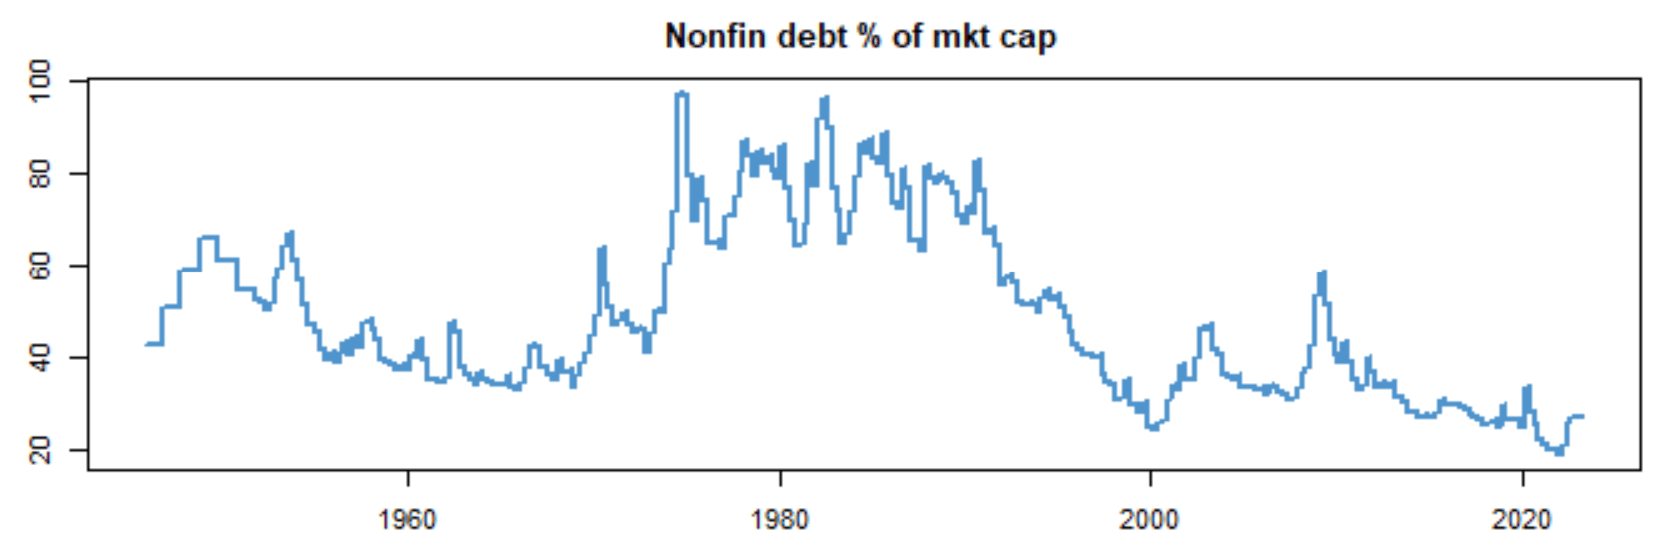
Non-financial corporate debt to market cap ratio. (QuantStreet, FRED)
Another important piece of information about corporate credit health in the U.S. is the Federal Reserve's survey of bank loan officers. The survey monitors the percent of senior bank loan officers who say they are tightening standards on commercial and industrial (C&I) loans. This is a useful forward-looking measure of credit risk in the market. The higher this series is, the more concerned banks are about extending small- to mid-size corporate loans. The currently elevated level of this series is one piece of credit news that is slightly worrying.
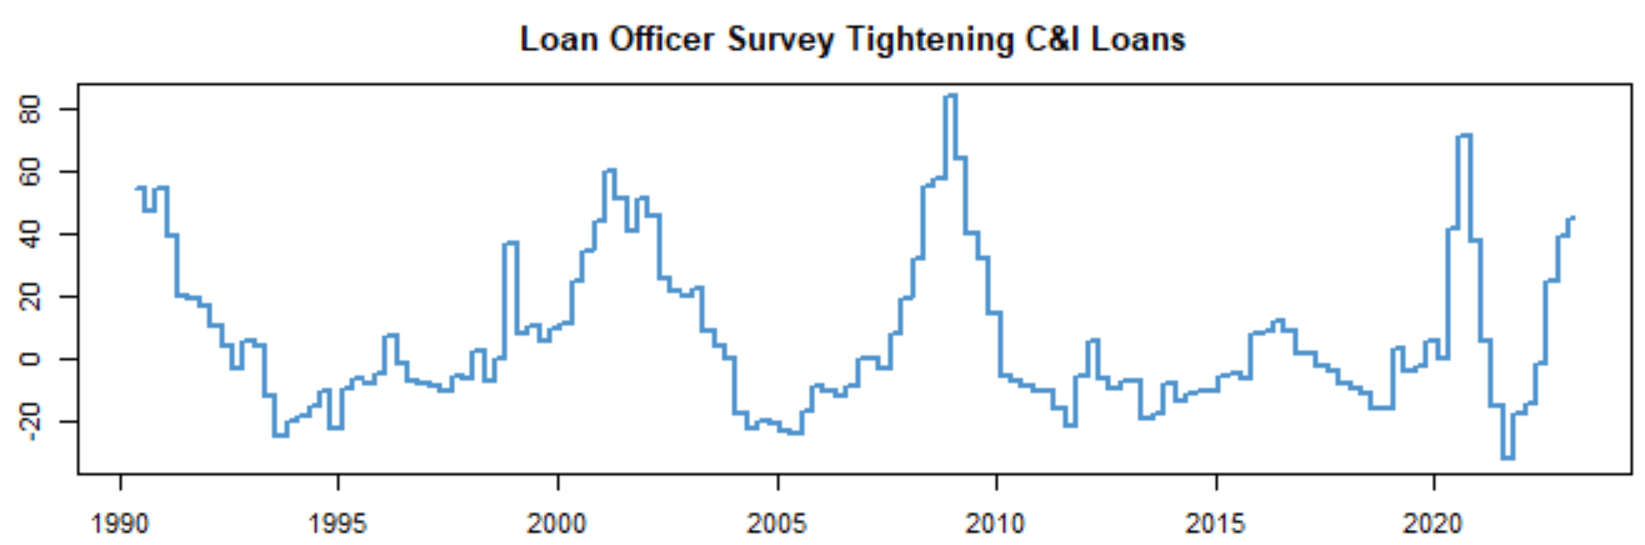
Fed's senior loan officer survey (QuantStreet, FRED)
Interest rate risk and return forecast
We have written recently in Seeking Alpha that the February increase in interest rates is not as bad as it looks. Without rehashing all those arguments here, the summary is that:
- Commodity and goods inflation is under control.
- Market-based inflation expectations are not sending warning flags.
- Services inflation is more of a concern, and will likely lead the Fed to tighten more than was anticipated a month ago.
Our view is that ultimately the Fed will win the inflation battle by slowing the economy, which will lead to a fall in longer-term rates, which in turn will be good for Treasury and high-quality corporate bond prices.
If, based on the above arguments, IG bonds are relatively creditworthy and interest rates are unlikely to spiral out of control, what might be the expected return from investing in investment grade bonds over the next year. The current dividend yield on LQD is around 3.5% as the next chart shows.
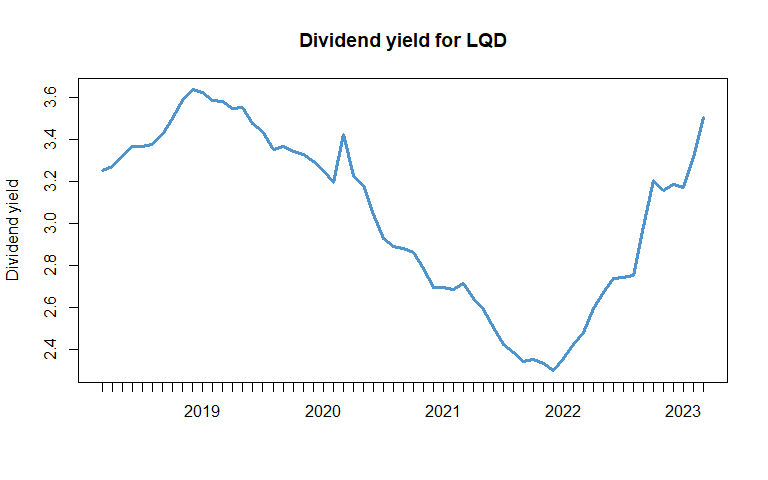
QuantStreet, Bloomberg
Mechanically, with higher interest rates, the yield on LQD will be higher. But the return from owning LQD consists of both the yield and the price change component. How might the latter contribute to LQD's year-ahead returns? An interesting perspective on this can be gleaned from QuantStreet Capital's return forecasting model for IG bonds. The model is estimated using a ten-year training window, in which it selects the subset of variables that does the best job of forecasting year-ahead IG returns (which include both price changes and dividend payments).
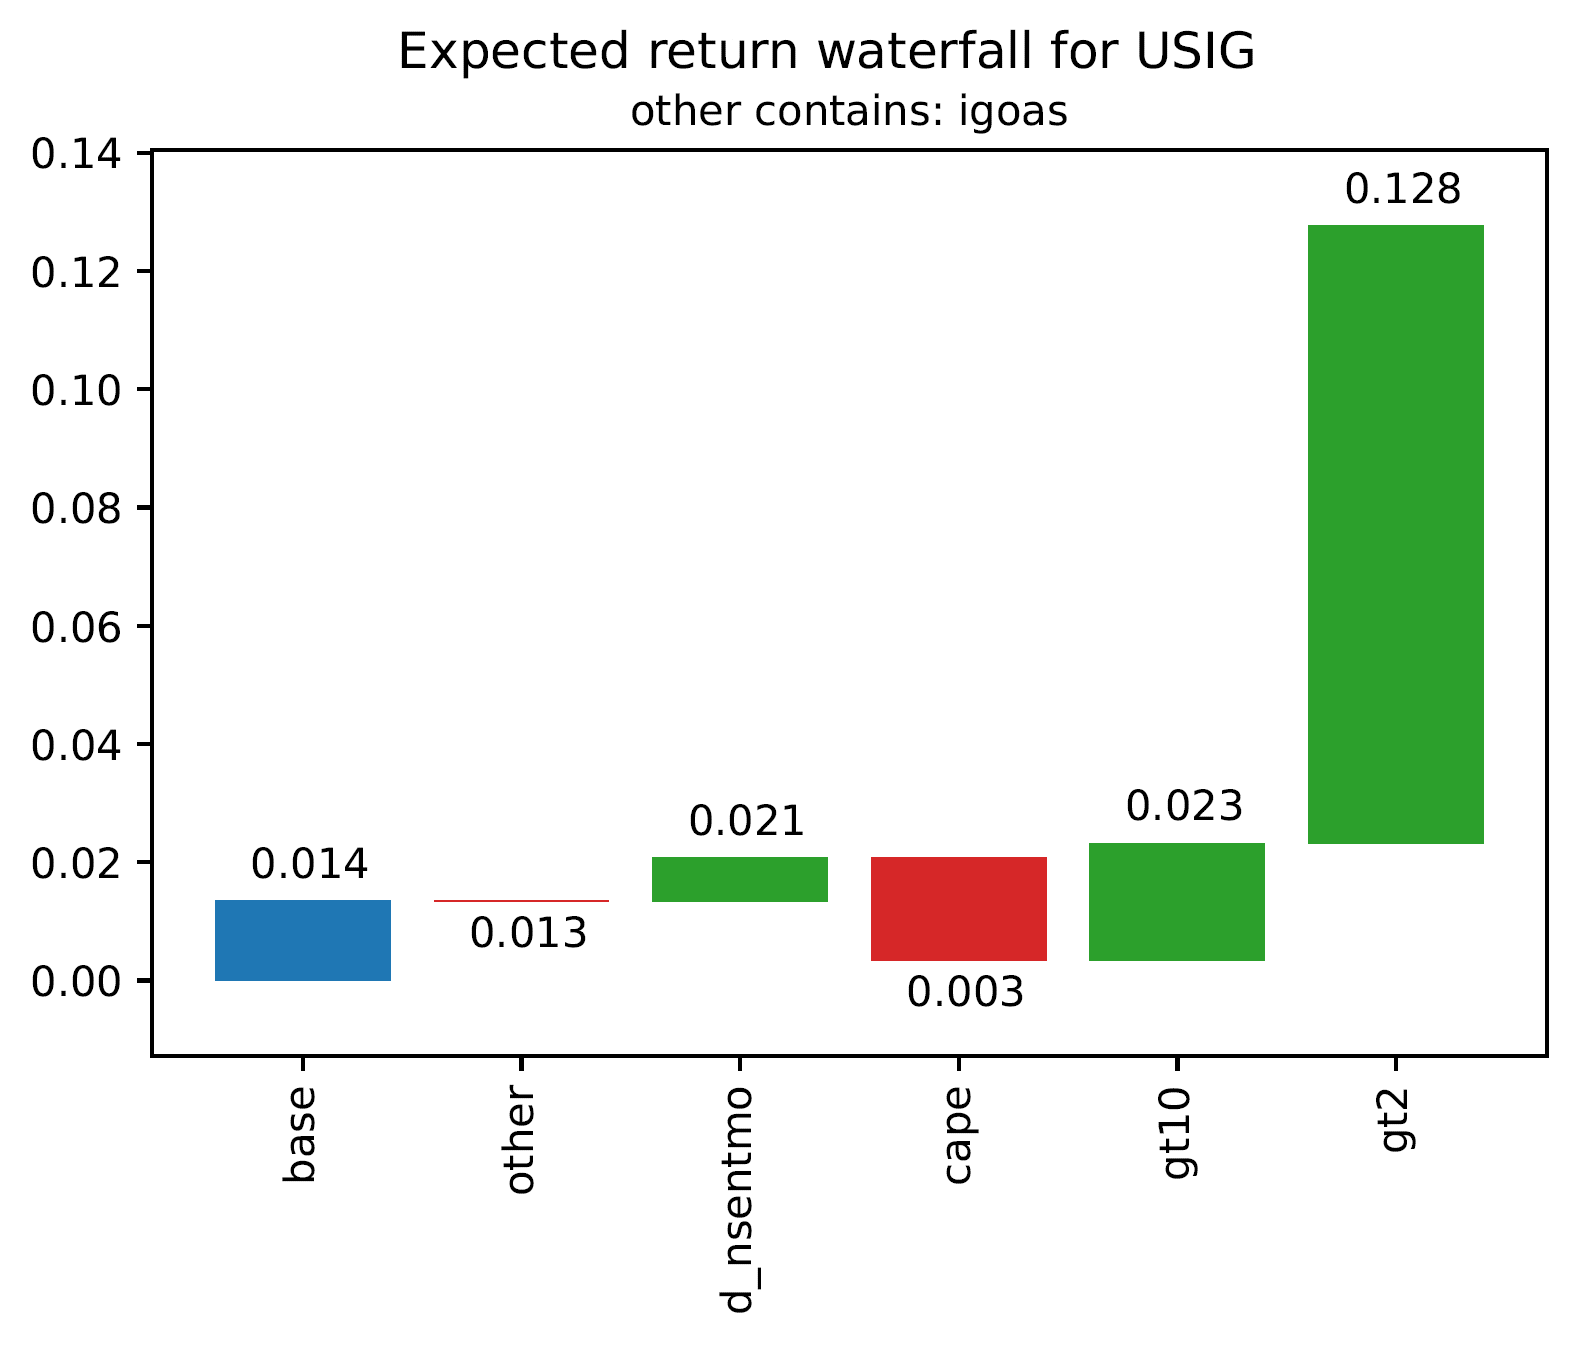
One-year ahead return forecast for IG bonds. (QuantStreet)
The blue bar in the above chart shows that the expected one-year ahead return on IG bonds if all forecasting variables identified by the model were equal to their average values in the training window would be 1.4%. The green and red bars show how this forecast changes because some forecasting variables are now either above or below their average values. The biggest impact on the model's year-ahead return forecast comes from the fact that current 10-year (gt10) and 2-year (gt2) Treasury yields are far above their average values. Based on the model's assessment of how interest rates impact future IG bond returns, this raises the model's all-in return forecast to 12.8% over the coming year. As the next chart shows, this return forecast is at the high end of the historical forecast range.
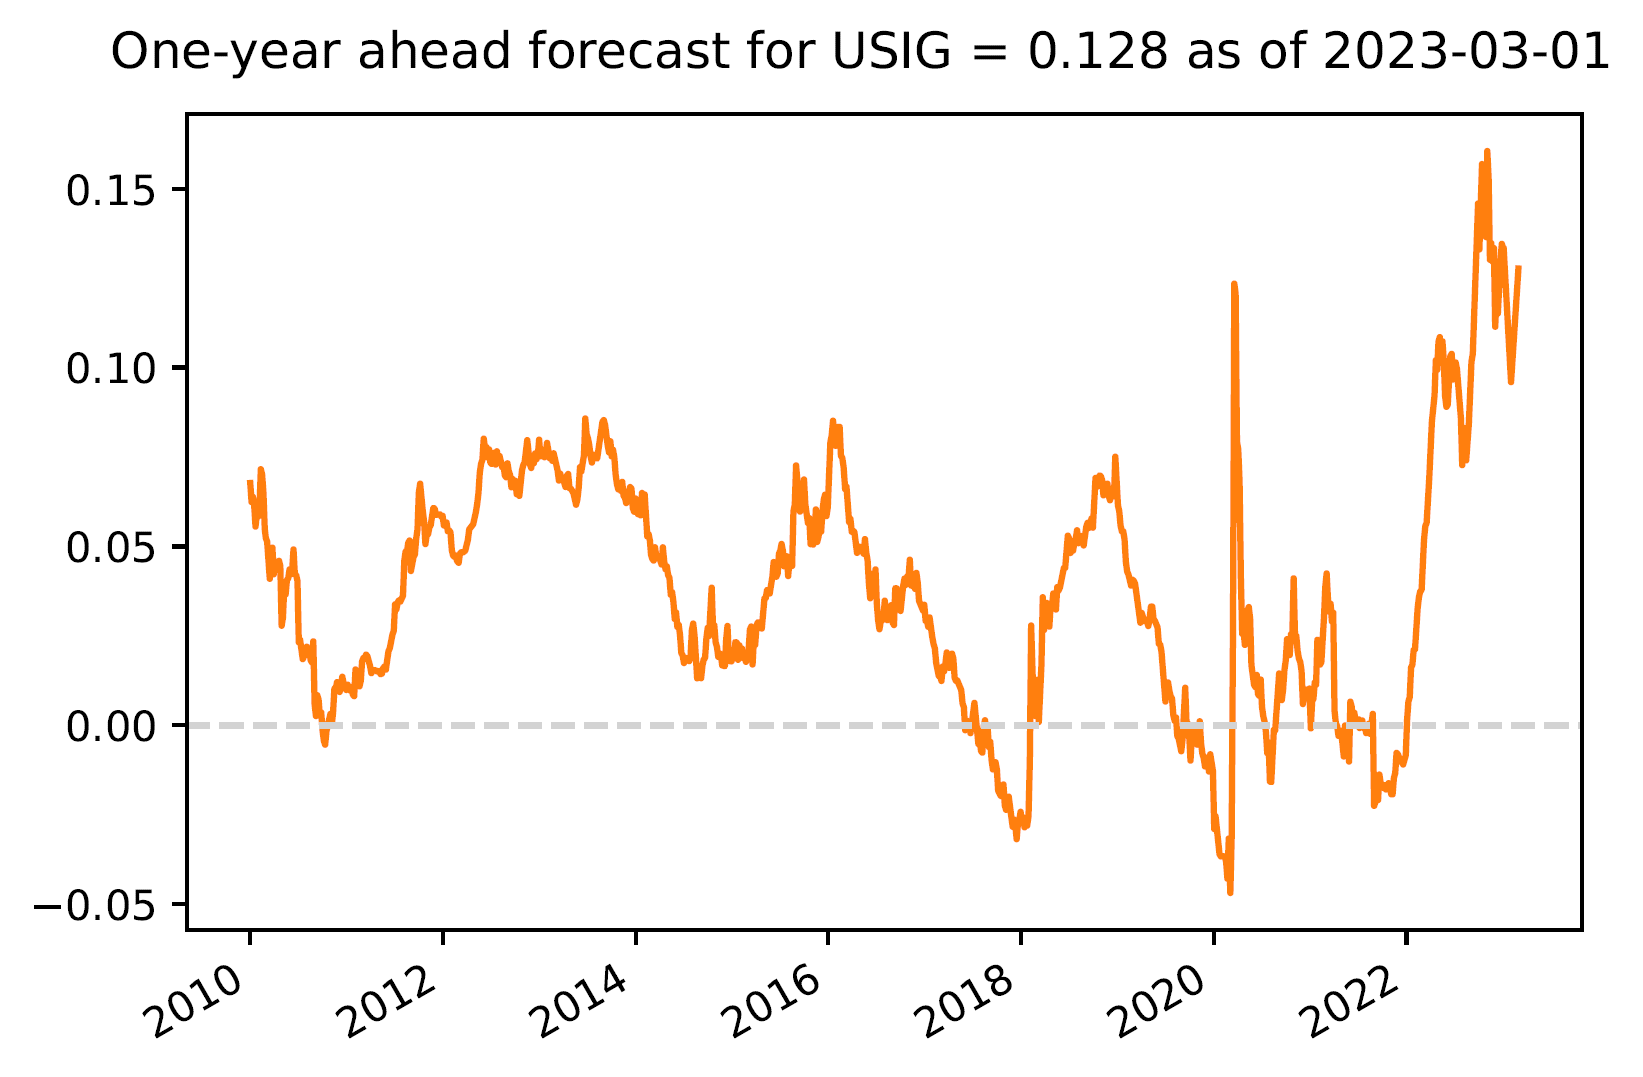
One-year ahead return forecast for IG bonds over time. (QuantStreet)
Of course, forecasting models, while useful, should be evaluated with a critical eye. But the consistency of the current return forecast with our fundamental views on corporate credit and interest rates gives some confidence that the model may be onto something, and that IG corporate bonds are currently an attractively priced asset class.
Importantly, investors should make sure that their portfolio allocations are in line with their risk preferences and liquidity needs.
This article was written by

Disclosure: I/we have a beneficial long position in the shares of VCIT either through stock ownership, options, or other derivatives. I wrote this article myself, and it expresses my own opinions. I am not receiving compensation for it (other than from Seeking Alpha). I have no business relationship with any company whose stock is mentioned in this article.