Citigroup: The Clear Value Pick In Big Banking (Rating Upgrade)

Summary
- Citigroup has been underperforming the big money-center banks for some time, which has created a super-low relative valuation.
- Rising net interest income, record cash holdings, and lower-than-normal leverage ratios point to conservative income generation in coming years.
- Investors have been buying shares aggressively in early 2023, with outsized accumulation trends potentially supporting years of outperformance vs. the sector and S&P 500 index.
Michael M. Santiago
Over the last year, I have written bullish articles on Goldman Sachs (GS) in June here and JPMorgan Chase (JPM) in September here. The two have turned into strong investment gainers, while representing the only financials I have suggested to readers as accumulation targets since interest rates began rising in 2021.
Seeking Alpha - Paul Franke, Goldman Sachs Article, June 24th, 2022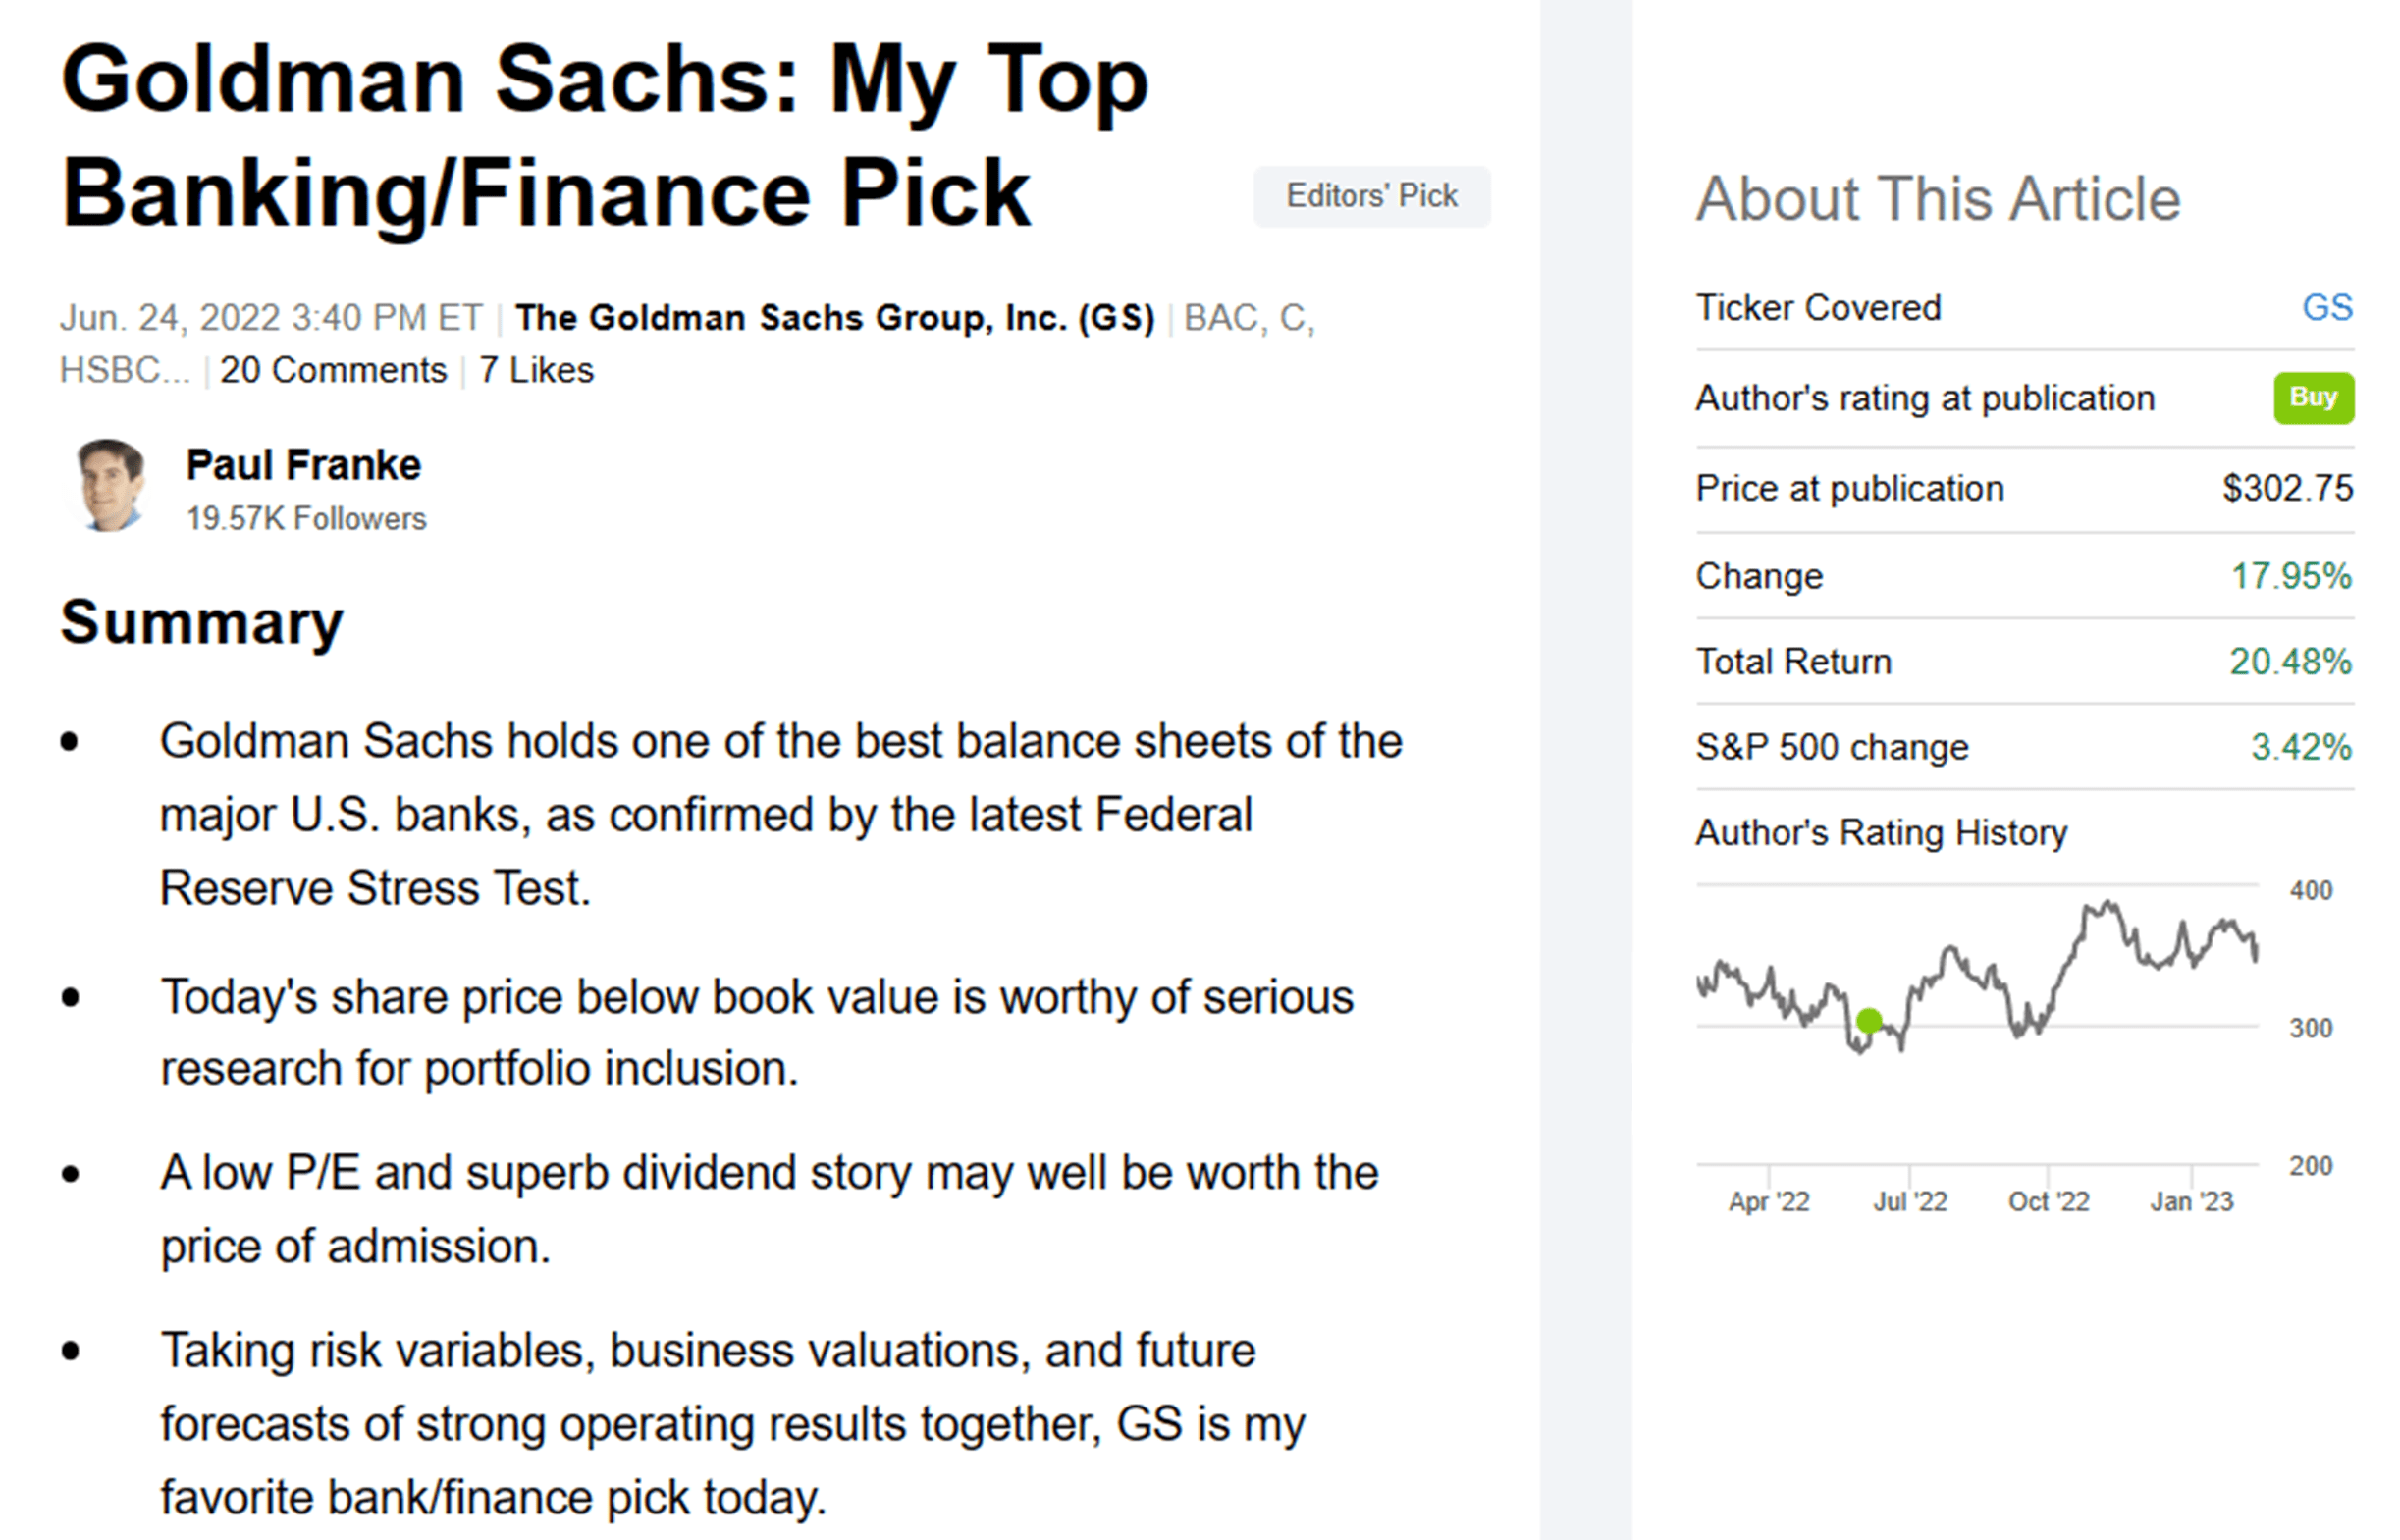
Seeking Alpha - Paul Franke, JPMorgan Chase Article, September 26th, 2022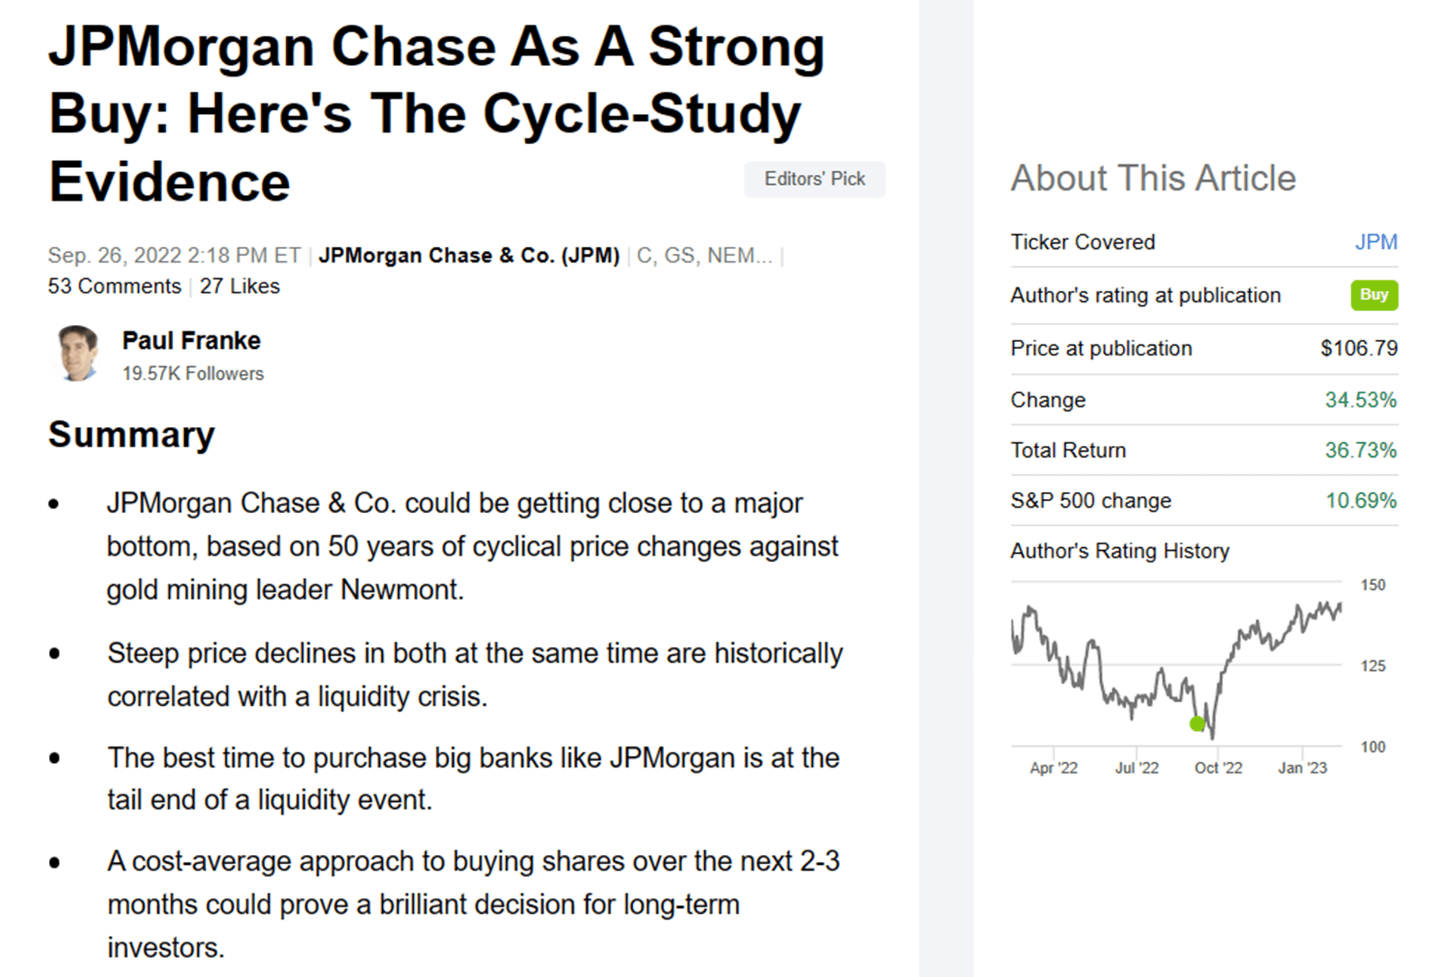
Another financial pick is Citigroup (NYSE:C), today's clear “value” play in the money-center banking sector. In fact, Citigroup is trading near its lowest valuation in 10 years, and should benefit smartly from rising interest rates (total net interest income is the highest in a decade already), assuming loan default rates do not explode in a serious recession scenario. Current investors must accept recession risk this year, while hoping for the best outcome on the loan loss reserve side of the banking spread equation.
One of the most improved underlying trading momentum pictures out of the sector in early 2023 is also arguing for a bullish rating, and suggests readers look at shares in portfolio construction. After years of writing Hold articles on Citigroup, I am upgrading my rating to Buy, although expectations should be muted and limited to a +10% to +15% total return forecast over the rest of the year from $52 per share.
Positive Valuation Story
The standout reason to purchase Citigroup in March 2023 is the ultra-low valuation now being applied to shares by Wall Street. Lackluster growth over the last decade, a stagnate stock quote, and fears of what a recession will do to loan quality and repayments leave analysts little room for optimism. The end result has been a gradual valuation improvement for forward-thinking investors.
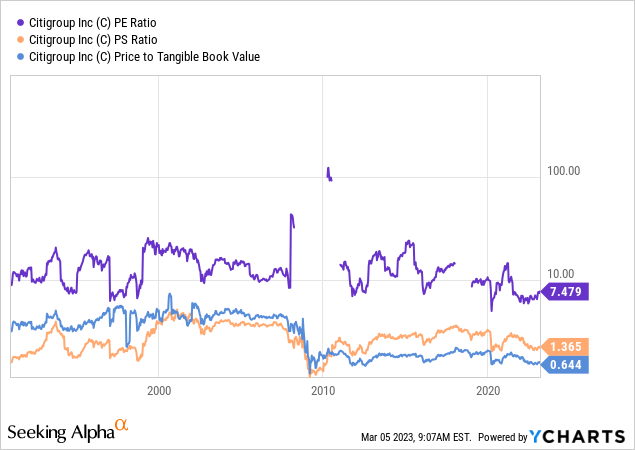
A review of basic fundamental ratio analysis reveals a solid bargain, if operating results do not move backwards in 2023. Below I have graphed the nearly decade low in price to trailing earnings (7.48x), sales (1.37x), and tangible book value (0.64x) now available for investment. Plus, a longer-term picture back to 1991 highlights a much better valuation than usual (on perhaps a stronger asset to loan setup in years, which I will discuss later in the article).
YCharts- Citigroup, Price to Basic Trailing Fundamentals, Since 2013 YCharts- Citigroup, Price to Basic Trailing Fundamentals, Since 1991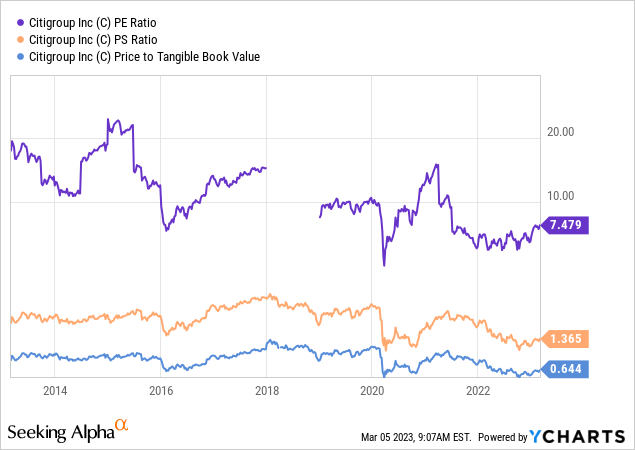
Measured against competitors and peers in the diversified, North American Big Bank space, Citigroup appears to be the bargain choice when reviewing these three fundamental data points. My sort list includes Bank of America (BAC), Wells Fargo (WFC), JPMorgan Chase, Bank of NY Mellon (BK), Capital One Financial (COF), American Express (AXP), HSBC Holdings plc (HSBC), Toronto-Dominion Bank (TD), and Royal Bank of Canada (RY). On a combination of the stats, I can argue Citibank is trading at a 30% discount to peer-group median averages.
YCharts- Largest U.S. Banks, Price to Trailing Earnings, 1 Year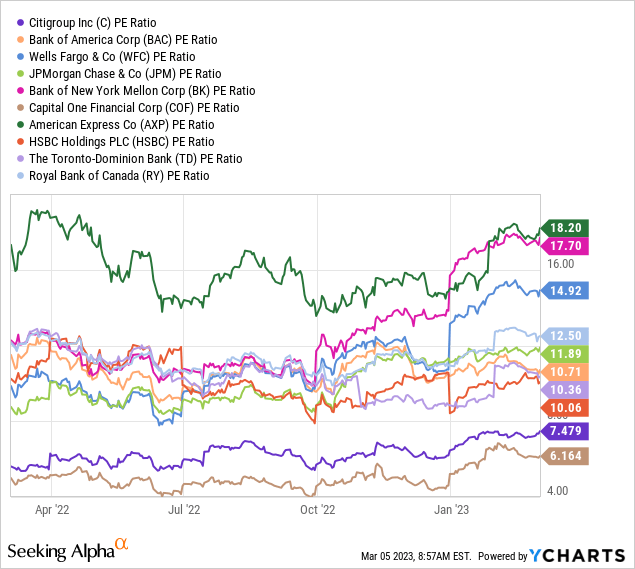
YCharts- Largest U.S. Banks, Price to Forward Estimated Earnings, 1 Year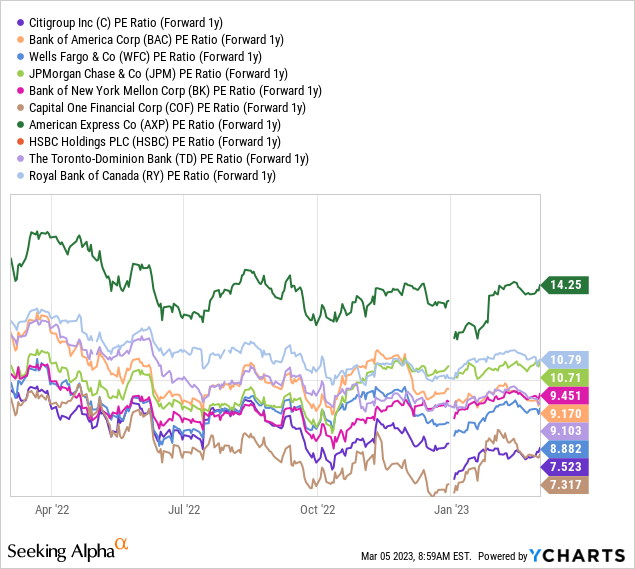
YCharts- Largest U.S. Banks, Price to Sales, 1 Year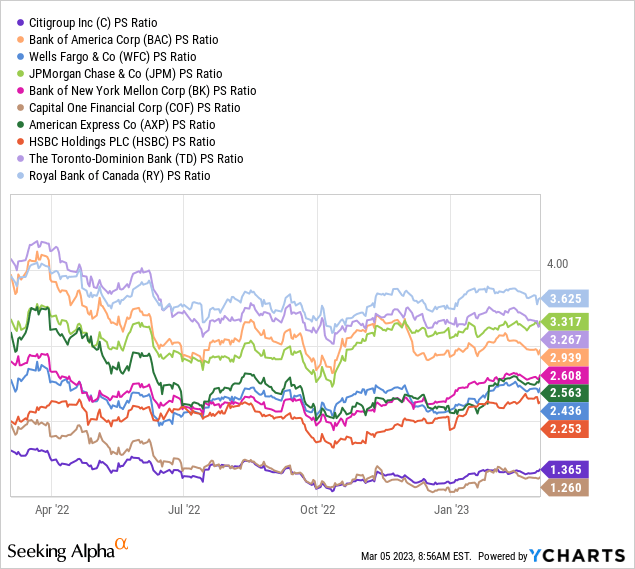
YCharts- Largest U.S. Banks, Price to Tangible Book Value, 1 Year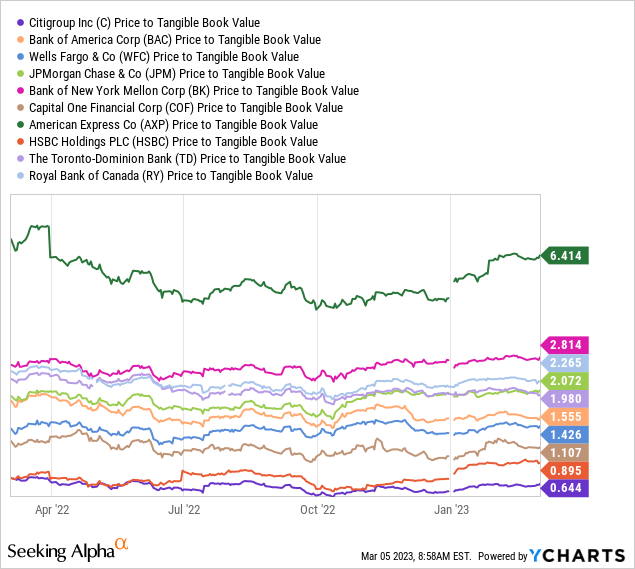
In addition, a price to trailing cash flow multiple of 4.1x is at least 25% lower than companies operating in the same field, making the same types of loans, running similar balance sheets.
YCharts- Largest U.S. Banks, Price to Trailing Cash Flow, 1 Year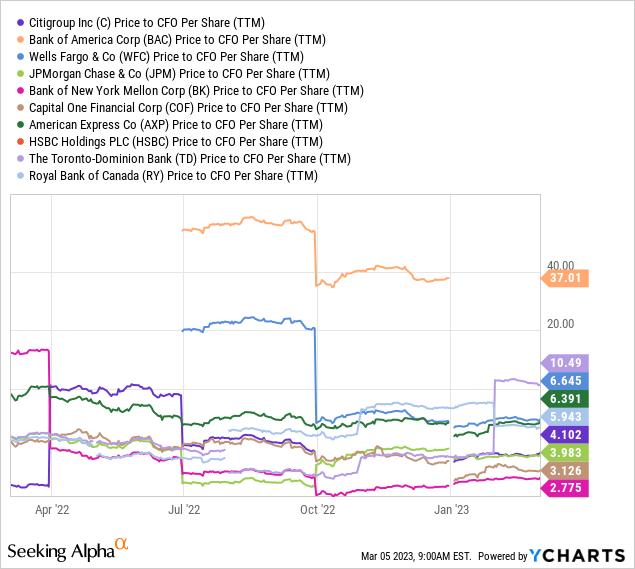
Lastly, a dividend yield approaching 4% is roughly best in class. Compared to “risk-free” Treasury bill rates on the short end of the duration curve in the 4% to 5% range, Citigroup offers a comparable cash distribution yield, plus an opportunity to grow the yield as its banking business grows over time.
YCharts- Largest U.S. Banks, Equity Dividend Yields, 1 Year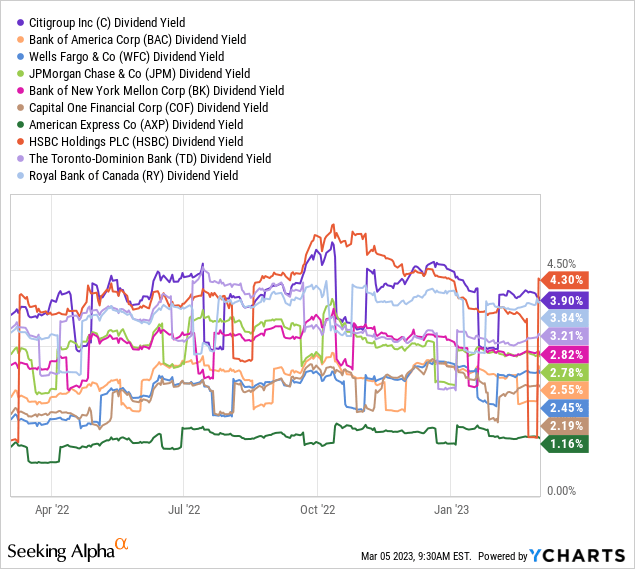
Rising Net Interest Income
Today, Citigroup’s consumer lending focus may not be a bad thing, if a soft landing in the economy (which I find unlikely but not impossible) combines with rising interest income on loans. The bullish logic is new loan creation at far higher interest rates (than a few years ago) pumps revenues faster than default rates increase. Under such a scenario the outlook is for steady to better income generation in 2023-24.
Already, net interest income has reached its highest number in over a decade at $48.7 billion. You can see the upturn below, which is happening at all the U.S. money-center banks and others in the lending field.
YCharts- Largest U.S. Banks, Net Interest Income, Since 2020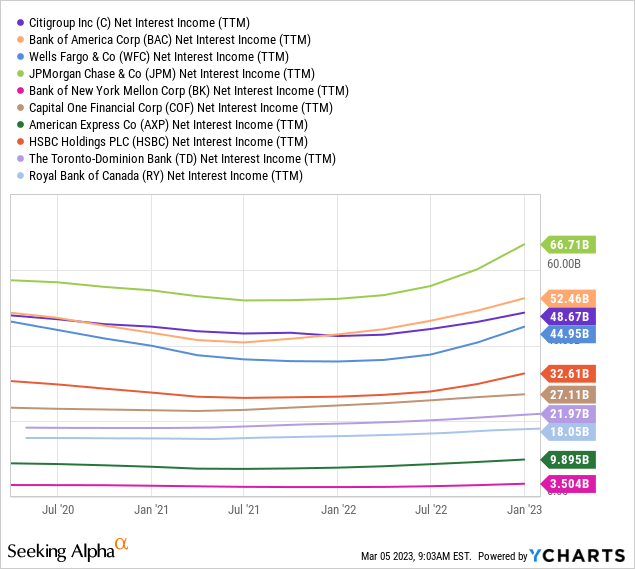
Below is a 10-year graph of lending interest rate changes, including Uncle Sam’s 5-year borrowing rate, plus 30-year home mortgage originations and the industry average on all credit cards. The bullish read is Citigroup’s interest income on new loans should continue to explode in 2023-24.
YCharts - Various Interest Rates, Since 2013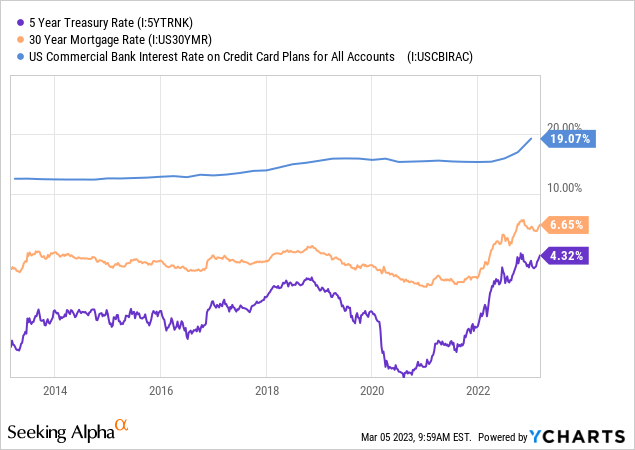
Manageable Loan Losses
The flip side of the health of this bank (and others) is to review loan loss rates and reserves. I have boxed in gold below the fact Citigroup has written into its loan book even greater default rates than existed before the pandemic in 2020. From 2018’s 1.8% bad loan assumption, 2022’s ending number was nearly 2.6%. So, to a large degree, the accountants at this bank are correctly preparing for a slowing global economy.
Seeking Alpha - Citigroup, Lending Stats, Author Reference Point, Since 2018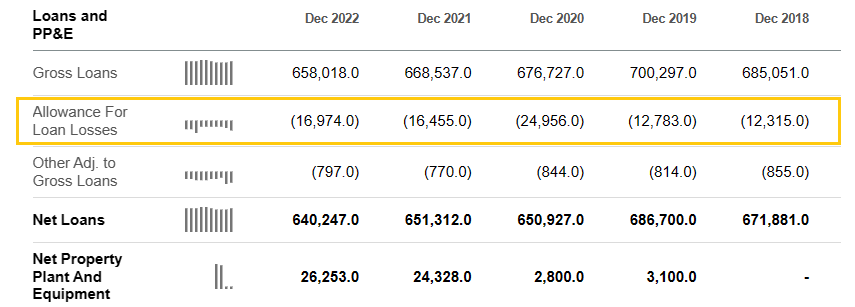
Record Cash Holdings
The other part of the balance sheet I really like is Citigroup now possess a conservative/monster cash and short-term equivalents position. Since 2018, this number has grown from $149 billion to a whopping $325 billion at the end of December 2022 (boxed in red below).
Seeking Alpha - Citigroup, Cash & Investments, Author Reference Point, Since 2018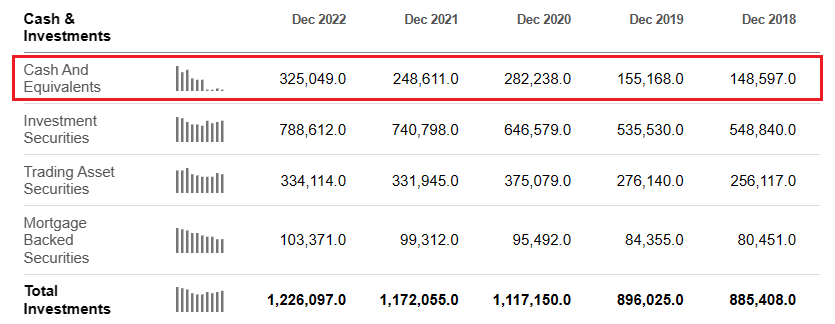
From my vantage, the below normal 11x ratio of loans and total liabilities to company equity prepares the business for a recession much better than the overextended 19x ratio going into 2007-09's Great Recession bust for financials. I have drawn a graph since 1991 for this important leverage ratio.
YCharts - Citigroup, Total Liabilities to Equity Leverage, Since 1991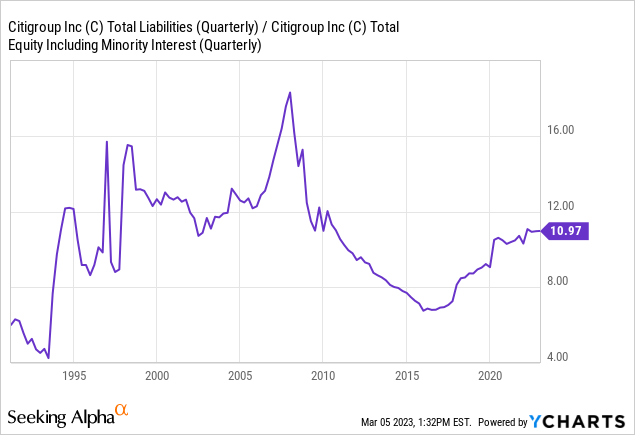
Even better news, Citigroup is sitting on one of its most liquid balance sheets ever from all the cash (earning 4%+ on short-term Treasuries now). Sharply rising cash interest income and risk-weighting of the whole balance sheet in early 2023 may lead to far lower volatility in common share pricing this year than many might expect, even in a recession.
YCharts - Citigroup, Total Liabilities to Cash Leverage, Since 1991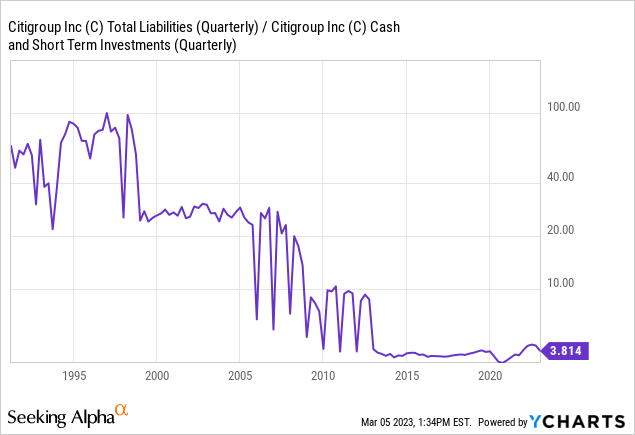
Share Buybacks
Another piece of the investment puzzle I am attracted to is tangible book value “per share” has jumped 28% since 2018 (boxed in green). Although total income and book value stats have not changed much over the last five years, the company has engineered much higher readings through large share buybacks (boxed in blue). Altogether, shares outstanding have declined a staggering 35% over the past 10 years. In the end, it is easy to figure and understand Citigroup the company is worth dramatically more than recent trading prices suggest.
Seeking Alpha - Citigroup, Balance Sheet Summary, Author Reference Points, Since 2018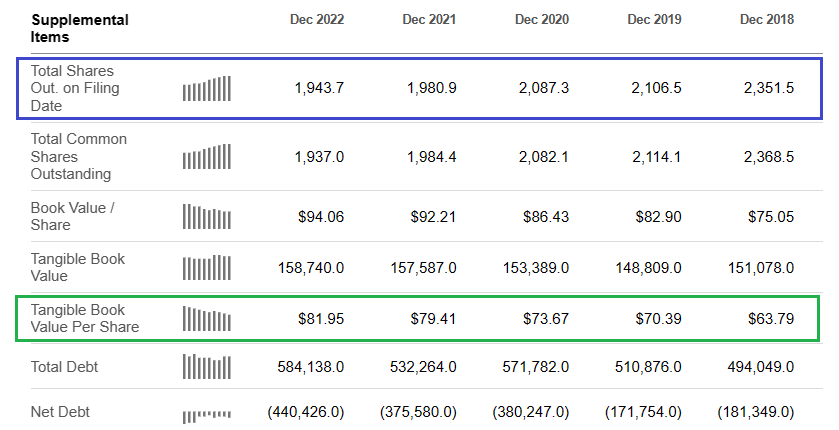
Technical Trading Momentum
Believe it or not, Wall Street has kind of been asleep at the switch in its pricing of Citigroup since the pandemic showed up in early 2020. On a total return graph measured from February 2020 to now, Citigroup has been the lagging choice in the Big Bank sector. Despite all the positives and operating progress management has produced, the total return for investors has been a rotten -22% over this span. However, the valuation story is beginning to get some traction with new investors.
YCharts - Largest U.S. Banks, 37-Month Total Returns
At the start of 2023, Citigroup trading momentum has turned decidedly bullish. For whatever reason, investment capital appears to be finding the stock. Below I have drawn a 1-year chart of daily price and volume changes. You will notice price has moved comfortably above both the important 50-day and 200-day moving averages.
The 14-day Average Directional Index, a measurement of 3-week volatility, fell last week to its lowest reading in years. I have circled in green this circumstance and a similar signal of a balance in supply/demand for shares in June. I like to buy equities with low ADX scores to improve my chances of success.
The Accumulation/Distribution Line (with the red sloping line) and On Balance Volume (blue arrow) are both pointing to heavy volume interest in Citigroup since the middle of December. You have to go back to late 2016 to find another instance of robust 3-month ADL and OBV strength alongside an ADX reading under 15 (which also highlighted a successful entry signal back then).
StockCharts.com - Citigroup, 1 Year of Daily Price & Volume Changes, Author Reference Points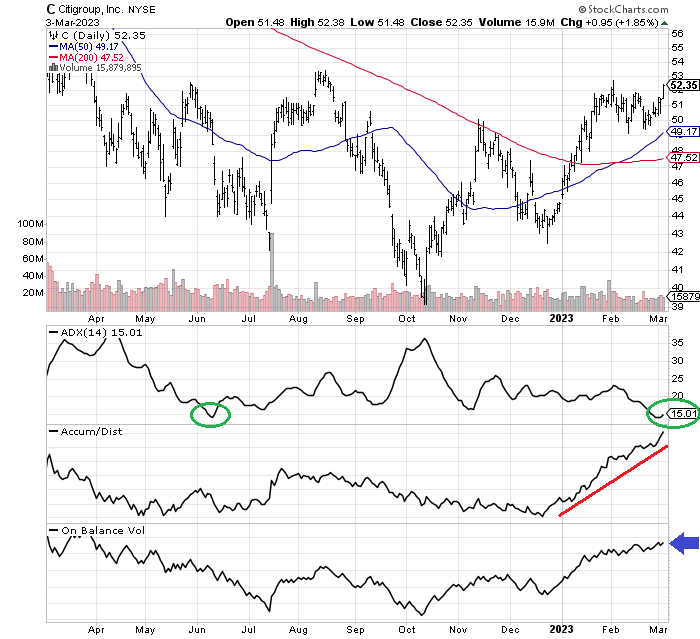
Final Thoughts
Management has been working on refocusing its wide stretch of international operations to the U.S. market. It is closing its Russian business. Plus, Citigroup has been negotiating to sell the Banamex Mexican consumer banking unit.
A possible $6 to $8 billion price tag is being discussed according to reports. A secondary option of forming a separate publicly-traded firm with an IPO windfall, on a spinoff transaction to existing Citigroup shareholders is rumored. Either way, extracting higher worth than the estimated $4 billion in net carrying value, alongside a simplification of the business are positives in my view.
Again, I am not predicting a spectacular investment return from Citigroup in 2023, as we grapple with and experience a probable recession. However, downside potential may be very limited. Money-center banks often are flight-to-safety ideas during major Wall Street selloffs. So, additional drawdowns in the U.S. equity market may keep shares in “outperformance” mode.
5-Year Outlook
Trading at a normalized long-term valuation with price again above tangible book value could help push the Citigroup price beyond $100 a share over the next 3-5 years. Of course, I will assume a catastrophic recession is avoided over this time frame. Even with a mild recession, extensive cash levels and lower than 30-year average leverage should keep common equity losses minimal. Including dividends, a compounded total return of 100%+ is possible eventually, possibly good for +15% to +20% annualized gain into 2026-28.
I do consider Citigroup an intelligent buy-on-weakness proposition. Losses in a deep recession could be as high as -50%, using past stress events as a guide. I do not think a Great Recession -90% equity price wipeout for shares is next, because of its reduced leverage and record cash setup. If you can scoop up a position under $50, I think you will be pleased with its long-term price appreciation and fat dividend checks thereafter.
Thanks for reading. Please consider this article a first step in your due diligence process. Consulting with a registered and experienced investment advisor is recommended before making any trade.
Editor's Note: This article discusses one or more securities that do not trade on a major U.S. exchange. Please be aware of the risks associated with these stocks.
This article was written by

Disclosure: I/we have no stock, option or similar derivative position in any of the companies mentioned, but may initiate a beneficial Long position through a purchase of the stock, or the purchase of call options or similar derivatives in C, GS, JPM over the next 72 hours. I wrote this article myself, and it expresses my own opinions. I am not receiving compensation for it (other than from Seeking Alpha). I have no business relationship with any company whose stock is mentioned in this article.
Additional disclosure: This writing is for educational and informational purposes only. All opinions expressed herein are not investment recommendations, and are not meant to be relied upon in investment decisions. The author does not provide personalized or individualized investment advice or information that is tailored to the needs of any particular recipient. The author is not acting in an investment advisor capacity and is not a registered investment advisor. The author recommends investors consult a qualified investment advisor before making any trade. When investing in securities, investors should be able to bear the loss of their entire investment and should make their own determination of whether or not to make any investment based on their own independent evaluation and analysis. No statement or expression of opinion, or any other matter herein, directly or indirectly, is an offer or the solicitation of an offer to buy or sell the securities or financial instruments mentioned. Any projections, market outlooks, or estimates herein are forward looking statements based upon certain assumptions that should not be construed as indicative of actual events that will occur. This article is not an investment research report, but the author’s opinion written at a point in time. Opinions expressed herein address only a small cross-section of data related to an investment in securities mentioned. Any analysis presented is based on incomplete information, and is limited in scope and accuracy. The information and data in this article are obtained from sources believed to be reliable, but their accuracy and completeness are not guaranteed. The author expressly disclaims all liability for errors and omissions in the service and for the use or interpretation by others of information contained herein. Any and all opinions, estimates, and conclusions are based on the author's best judgment at the time of publication, and are subject to change without notice. The author undertakes no obligation to correct, update or revise the information in this document or to otherwise provide any additional materials. Past performance is no guarantee of future returns.