RYJ: Striking A Skeptical Tone

Summary
- RYJ is a passively-managed ETF tracking the proprietary index of securities that earned a Strong Buy 1 rating from Raymond James analysts.
- At the moment, it is heavy in financials, industrials, and information technology, with a wide spectrum of market capitalizations represented, from micro to mega caps.
- The strategy might look solid on paper, but the results delivered are mixed and the current factor exposure (the quality/value mix) leaves a lot to be desired.
vokri/iStock via Getty Images
Conducting thorough equity research is a complicated, in many cases toilsome process. Thankfully, for investors who for whatever reason cannot spend hours on page-to-page analysis of countless filings and build models to uncover overlooked gems, there is a myriad of active or quasi-active exchange-traded funds that offer exposure to promising securities with alpha potential picked by analysts who rely on their own unique insights and sophisticated models.
Invesco Raymond James SB-1 Equity ETF (NYSEARCA:RYJ), a passively-managed ETF tracking the proprietary index of securities that earned a Strong Buy 1 rating from Raymond James analysts, is one example. This high-turnover strategy falls into the quasi-active category in my personal classification due to the fact that 1) its constituents are hand-picked and 2) it is rebalanced semi-monthly as noted on the RYJ website.
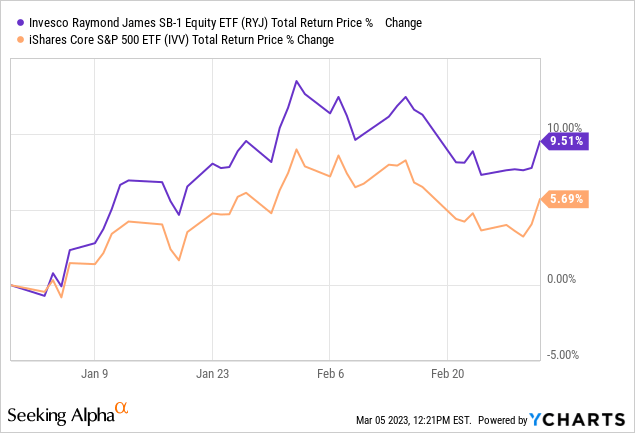
Despite the fund having a few advantages (more on that shortly), I would like to strike a skeptical tone today. Before we proceed to an in-depth discussion, let me immediately clarify that RYJ is a Hold at best. The strategy might look solid on paper, but the results delivered are mixed and the current factor exposure leaves a lot to be desired. I believe there is too much risk in this portfolio dominated by low-quality mid-caps. Its ebullient start to 2023 as it has beaten the iShares Core S&P 500 ETF (IVV) by around 4% is worth appreciating, but this alone is insufficient for optimism.
Valuation is the primary concern, partly owing to biotechs
As of March 2, there were 176 holdings in the RYJ portfolio, excluding cash and money-market funds. 150 of them are common stocks, 3 are American Depositary Receipts, and 20 are REITs. There are two partnership interests, namely Energy Transfer LP (ET), Enterprise Products Partners L.P. (EPD), and a Kimbell Royalty Partners, LP (KRP) unit as well. According to the index methodology touched upon in the prospectus, MLPs and sponsored ADRs can join the group freely, so this is not coincidental.
Looking inside the portfolio, the primary reason for skepticism is that the lion's share of the fund's holdings is relatively overvalued. When I say 'overvalued,' I mean that the portfolio's weighted-average earnings yield is marginally above 2%, which specifies a P/E ratio of over 49x. Apparently, this might be indicative of the fund's obsession with growthier companies. RYJ does have exposure to excellent growth stories, with over 26% of the net assets allocated to names with no less than 20% forward revenue growth rates, including Tecnoglass (TGLS) with its A Quant Growth grade, but both weighted-average earnings and revenue forward growth rates are at about 14% only, as per my calculations, which does not look like a level impressive enough to justify an earnings multiple approaching 50x; to corroborate, nice example that spring to mind immediately here is Tesla (TSLA), with its 54.6x GAAP P/E supported by a forward revenue growth of 35.5% and diluted EPS growth similarly strong. So it seems the growth premia is not the principal reason for such a generous valuation.
Looking at the sector mix, things are becoming even more complicated as a financials (19.2%) and energy (12.9%) are solidly represented and both traditionally have substantial median EYs. In the case of RYJ, as per my computations, they have a median 7.6% and 13.7% yield, respectively, easily beating other sectors; for instance, consumer discretionary is in third place with its 4.5%.
Perhaps quality premia have contributed. Nevertheless, this is also not the case as the fund's weighted-average Return on Equity stands at a measly level, just 5.5%, which I have never encountered before. At the same time, Return on Assets is simply microscopic, at just 10 bps. To give more color, close to 14% of the fund's net assets are allocated to stocks that have precariously weak margins and/or sector-lagging returns on capital as indicated by the Quant Profitability rating of D+ and worse; only 63.7% can boast a B- rating and better.
And here, it seems we finally found the primary detractor from the earnings yield - ROE is minuscule since a meaningful share of the holdings cannot turn even a small profit. More specifically, I found 52 companies (almost 29%) that failed to deliver positive net earnings in the last twelve months, with 18 of them (9.7% of the total) operating in the health care sector, like Ocular Therapeutix (OCUL).
Sure, we can eliminate the impact of this on the final result and replace all the negative yields with zero; in this case, the model would return the yield of 5.6%, which is above ~5% offered by the market. This certainly does not mean that my hypothesis that the RYJ portfolio is expensive is wrong. The EY is just the tip of the iceberg. For better context, we can also look at the 5.2x Price/Sales ratio; however, once again, biotech and biopharma players with their measly revenues or even without them yet are partly to blame. Next, only ~25% of this mid-caps-heavy portfolio have a B- Quant Valuation grade of higher, while over 45% have D+ or worse.
In sum, I am certainly not aware of the exact rationale behind the Strong Buy 1 ratings; perhaps, there are possible catalysts, or the DCF models are returning fair value estimates which are way higher than the current prices. Regardless, my task is to highlight that multiples are overstretched in this portfolio despite only modest growth and soft quality, and thus give investors food for thought.
Performance: mixed impression
As described in the fact sheet, in May 2018, the fund was reorganized; almost ten years earlier, in September 2008, "the Guggenheim predecessor fund acquired the Claymore/Raymond James SB-1 Equity Fund." So I believe it would be reasonable to limit the period for performance analysis to October 2008 - February 2023.
First, RYJ lagged both IVV and SPDR S&P MidCap 400 ETF Trust (MDY) over that period, with a higher standard deviation and lower risk-adjusted return.
| Portfolio | IVV | RYJ | MDY |
| Initial Balance | $10,000 | $10,000 | $10,000 |
| Final Balance | $43,353 | $31,504 | $41,676 |
| CAGR | 9.15% | 7.09% | 8.90% |
| Stdev | 15.68% | 22.25% | 18.55% |
| Best Year | 32.30% | 56.34% | 37.58% |
| Worst Year | -37.02% | -38.75% | -36.44% |
| Max. Drawdown | -50.78% | -54.64% | -49.73% |
| Sharpe Ratio | 0.57 | 0.37 | 0.5 |
| Sortino Ratio | 0.83 | 0.53 | 0.72 |
| Market Correlation | 1 | 0.91 | 0.96 |
Created by the author using data from Portfolio Visualizer
Second, even though it managed to outperform IVV during tumultuous 2022, it lagged it badly in 2021 and 2020, unable to benefit both from the pandemic tailwinds and then from the capital rotation; during the fourteen full years (2009 - 2022) shown below, it beat IVV only six times.
Created by the author using data from Portfolio Visualizer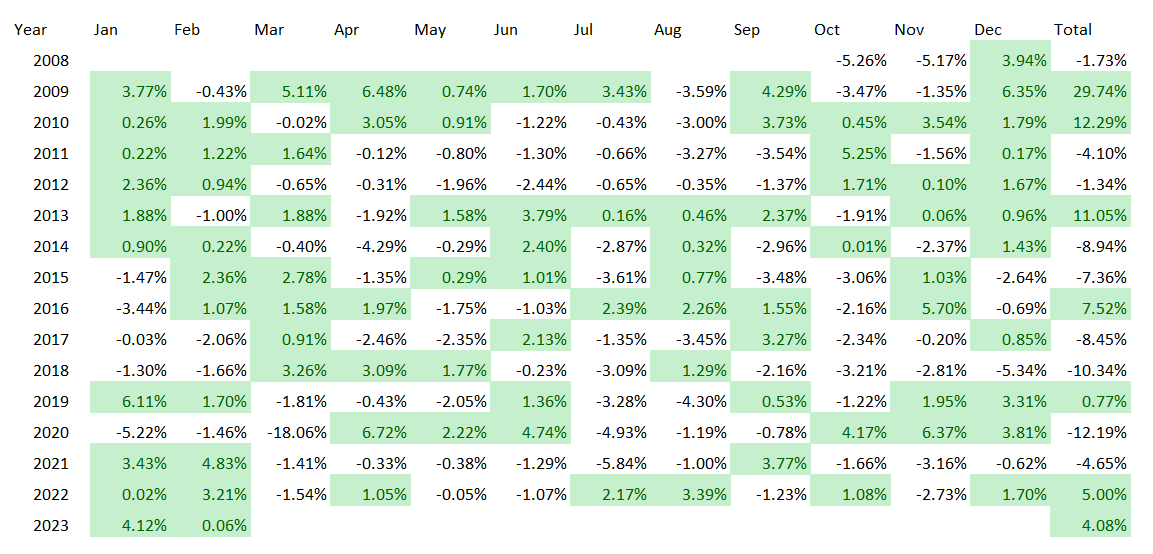
Final thoughts
RYJ has a high-turnover quasi-active strategy. At the moment, it is heavy in financials, industrials, and information technology, with a wide spectrum of market capitalizations represented, from micro to mega caps, with the weighted average at $19.9 billion, as per my calculations, mostly because mid-caps and smaller companies account for 64% of its net assets.
I am convinced that quality-light and richly priced portfolios overweight in mid and small caps are perhaps amongst the weakest options to invest in right now. There are a lot of high-quality, moderately valued names in this basket that might perform excellently. Nevertheless, the issue is that portfolio-wise, exposure to the factors I favor is not that great. The large presence of unprofitable biotechs (the earnings yield and Price/Sales ratio reflect this) adds to the risk.
It is also worth noting that the ETF has a burdensome 81 bps expense ratio, which is a strong detractor from longer-term returns. In sum, RYJ ETF is a Hold at best.
This article was written by

Disclosure: I/we have no stock, option or similar derivative position in any of the companies mentioned, and no plans to initiate any such positions within the next 72 hours. I wrote this article myself, and it expresses my own opinions. I am not receiving compensation for it (other than from Seeking Alpha). I have no business relationship with any company whose stock is mentioned in this article.