XFLT: 12% Yield And Other High-Yield Floating Rate Funds

Summary
- XFLT yields 12.64% and pays monthly.
- We cover several other monthly floating rate CEFs.
- Performance, yields, and current discounts are compared for all of these funds.
- Looking for more investing ideas like this one? Get them exclusively at Hidden Dividend Stocks Plus. Learn More »
MCCAIG
Looking for ways to benefit from floating rates? There are a number of floating rate closed-end funds which focus on that strategy, including the XAI Octagon Floating Rate & Alternative Income Term Trust (NYSE:XFLT).
Fund Profile:
"The Trust invests in a dynamically managed portfolio of floating-rate credit instruments and other structured credit investments within the private markets. Under normal market conditions, the Trust will invest at least 80% of managed assets in senior secured loans, CLO debt and CLO equity. It seeks attractive total return with an emphasis on income generation across multiple stages of the credit cycle. (XFLT site)
XFLT has $244M in common assets, with 462 holdings - it IPO'd in 2017.
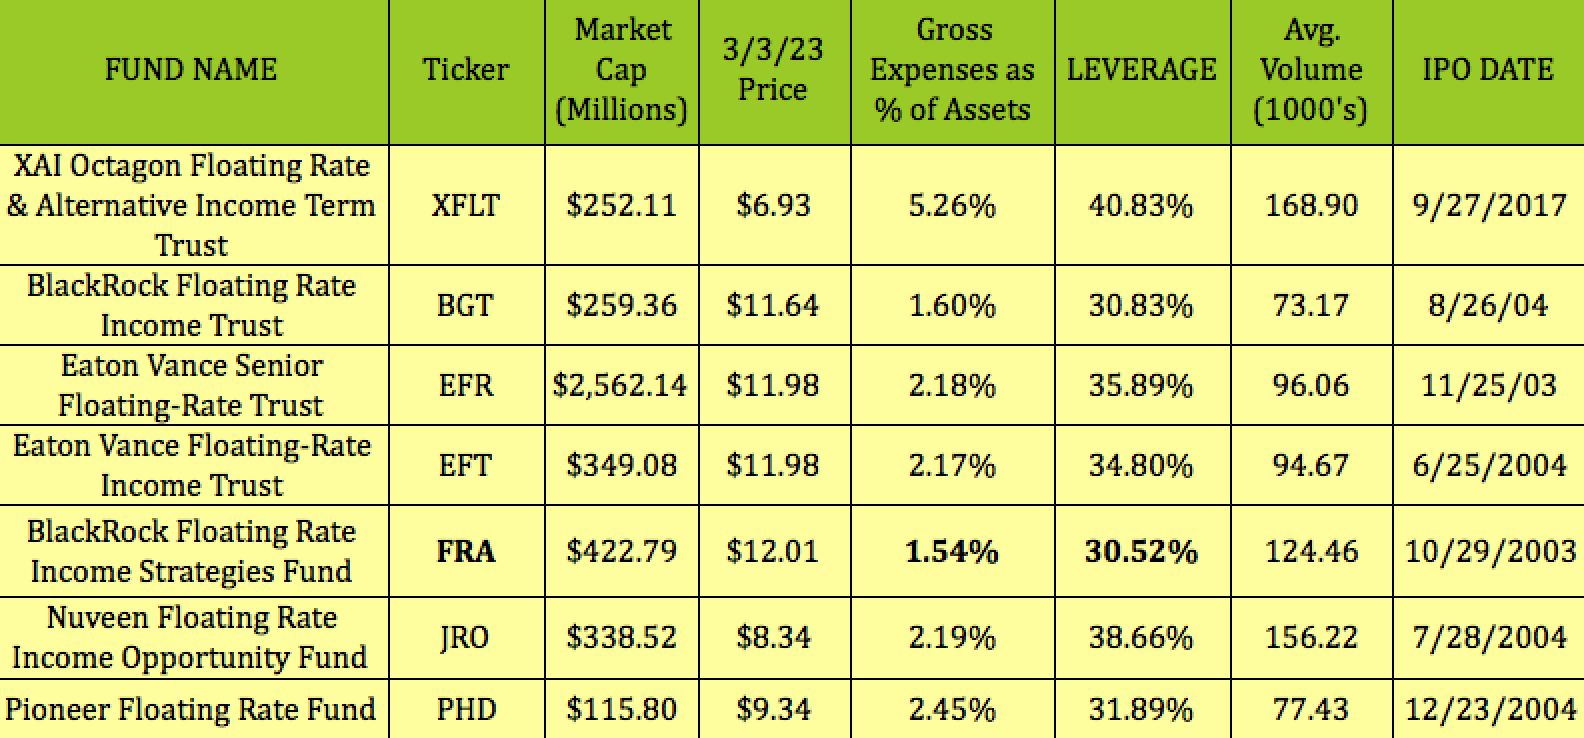
We found several other CEF's in the floating rate arena, including:
-BlackRock Floating Rate Income Trust (BGT)
-Eaton Vance Senior Floating-Rate Fund (EFR)
-Eaton Vance Floating Rate Income Trust (EFT)
-BlackRock Floating Rate Income Strategies Fund (FRA)
-Nuveen Floating Rate Income Opportunity Fund (JRO)
-Pioneer Floating Rate Trust (PHD)
XFLT is the newest fund, with the highest expense ratio, 5.26%, highest leverage, at 40.83%, and highest average volume in this group, at ~169K.
EFR is by far the largest fund, with a $2.56B market cap. Its 2.18% expense ratio is in the middle tier, as is its 35.89% leverage.
FRA has the lowest expense ratio, at 1.54%, and the lowest leverage, at 30.52%.
PHD is the smallest fund, with a $116M market cap. Its 2.45% expense ratio is the second highest, after XFLT's, while its 77.4K average volume is the second lowest.
BGT has the lowest expense ratio, at 1.60%, the second lowest leverage, at 30.83%, and the lowest average volume, at 73K.
EFT and JRO both IPO'd in 2004, and have very similar expense ratios of ~2.18%. JRO uses 38.66% leverage, vs. 34.80% for EFT, and has much higher average volume of 156K, vs. ~95K for EFT:
Hidden Dividend Stocks Plus
Dividends:
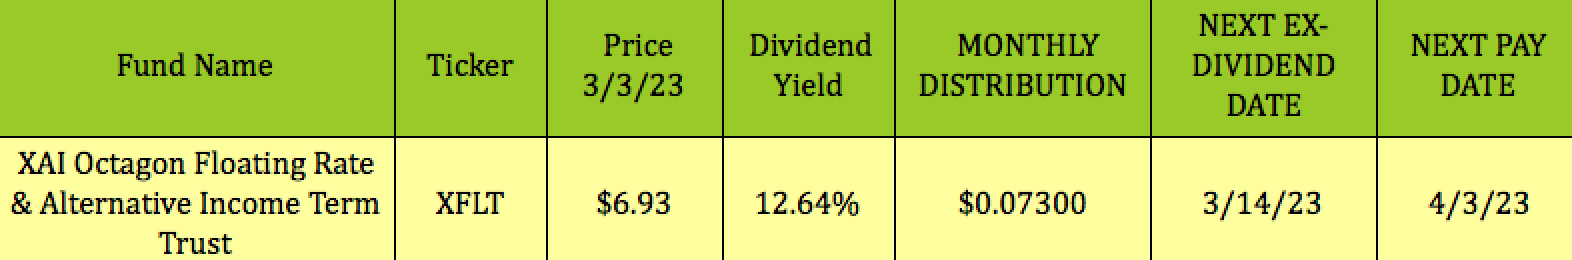
At $6.93, XFLT yields 12.64%. It pays $0.073, and goes ex-dividend next on 3/14/23, with a 4/3/23 pay date.
Hidden Dividend Stocks Plus
For its fiscal year ending 9/30/22, XFLT had $26M in NII, -$1.65M in Realized Gains, but paid out $28M in distributions, with distribution coverage of .87X, slightly better than its .85X coverage ratio in its fiscal year. However, it also had $21.89M in Unrealized Gains in fiscal year ending 9/30/21, vs. -$61M in fiscal year ending 9/30/22:

Hidden Dividend Stocks Plus
All of these CEFs pay monthly distributions, which are largely sourced from income, with very little return of capital. XFLT's 2022 distributions had 6.6% in ROC.
Seeing as how there have been eight straight rate hikes by the Fed, it would make sense that floating rate funds would also be increasing their monthly distributions over the past 12 months.
However, that hasn't been the case with XFLT - although it has the highest yield in this group, management hasn't made any monthly rate hikes in the past 12 months.
While PHD has made the most monthly payout hikes, six, for a total 46% distribution/share increase, BGT and FRA, both BlackRock funds, both had a cumulative 67% increase, accomplished via two monthly hikes. BGT and FRA yield 11.15 - 11.16%, while PHD yields 11.24%, 2nd in line behind XFLT's 12.64% yield:

Hidden Dividend Stocks Plus
Holdings:
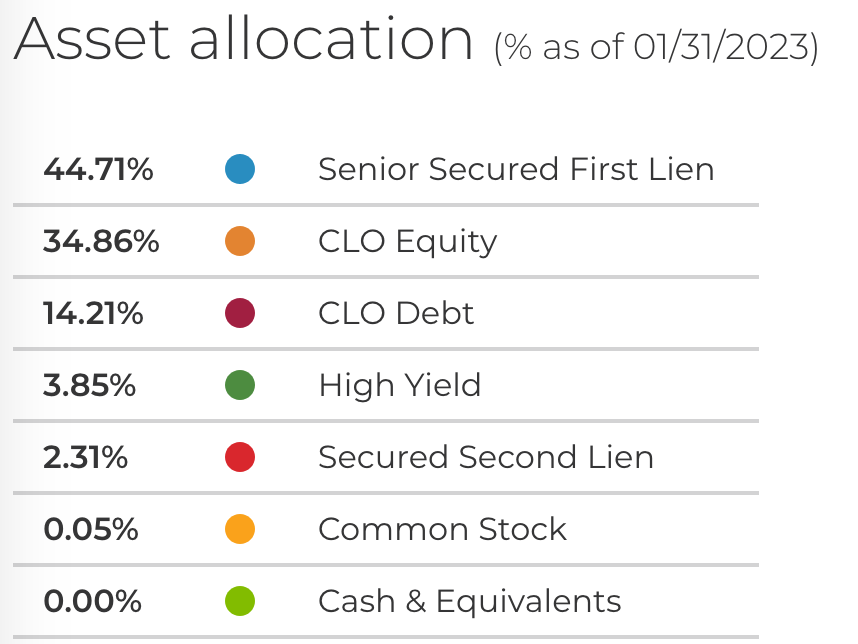
XFLT's top allocation is in Senior Secured 1st Lien Loans, at 44.71%, followed by CLO Equity, at 34.86%, CLO Debt, at 14.21%, High Yield, at 3.85%, and Secured 2nd Lien investments, at 2.31%:
XFLT site
Its top 10 forms 12.23% of its portfolio, with Carlyle US CLO 2020-4A its top holding. Carlyle Group (CG) manages $373B in assets. There are three CLOs from Elmwood, an independent, alternative investment manager formed in 2018. Elmwood specializes in long-only investment strategies in the performing credit markets.
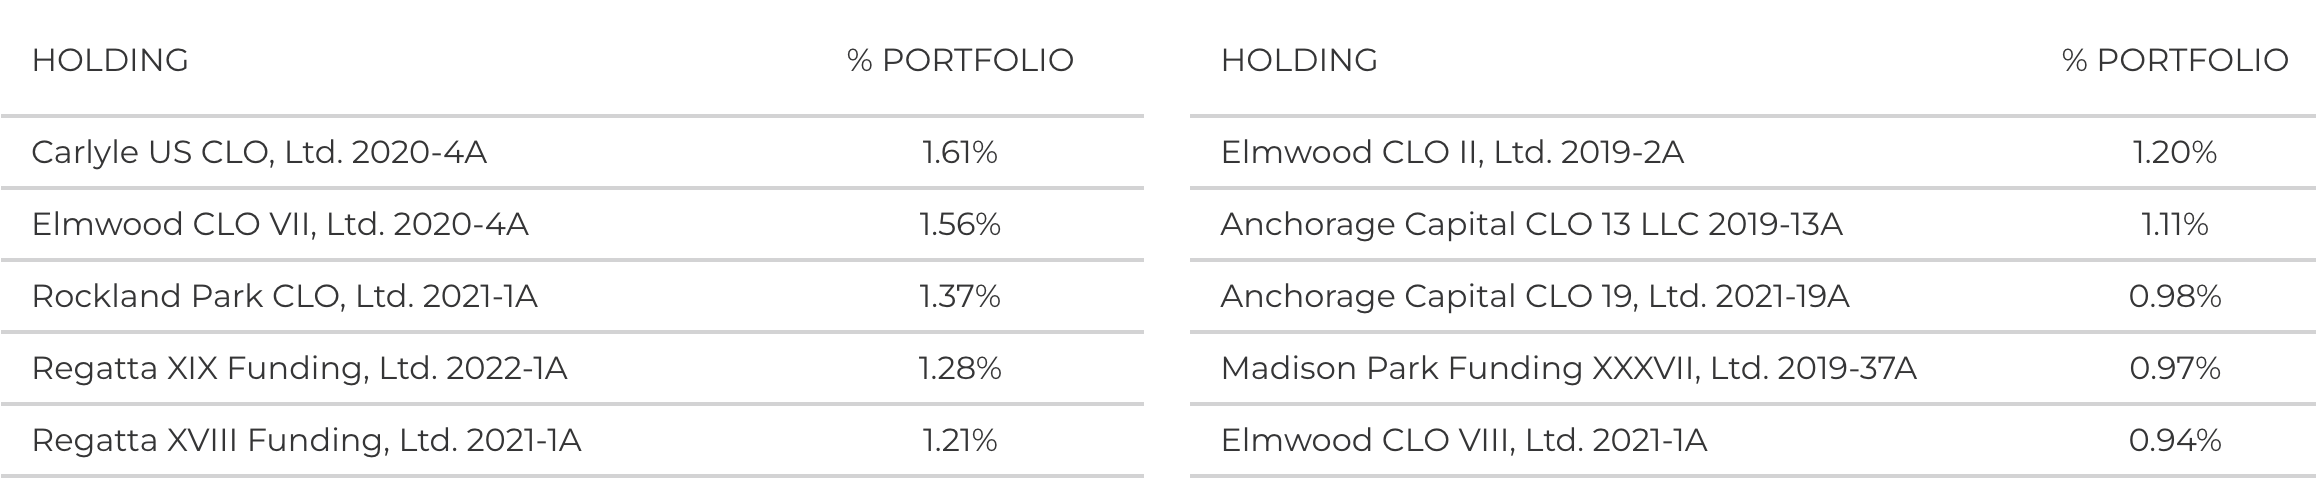
XFLT site
The 5-9 year maturity bracket forms 43% of XFLT's holdings, followed by ~37% in 10+ year holdings, (surprising), and ~20% in 0-4 years.
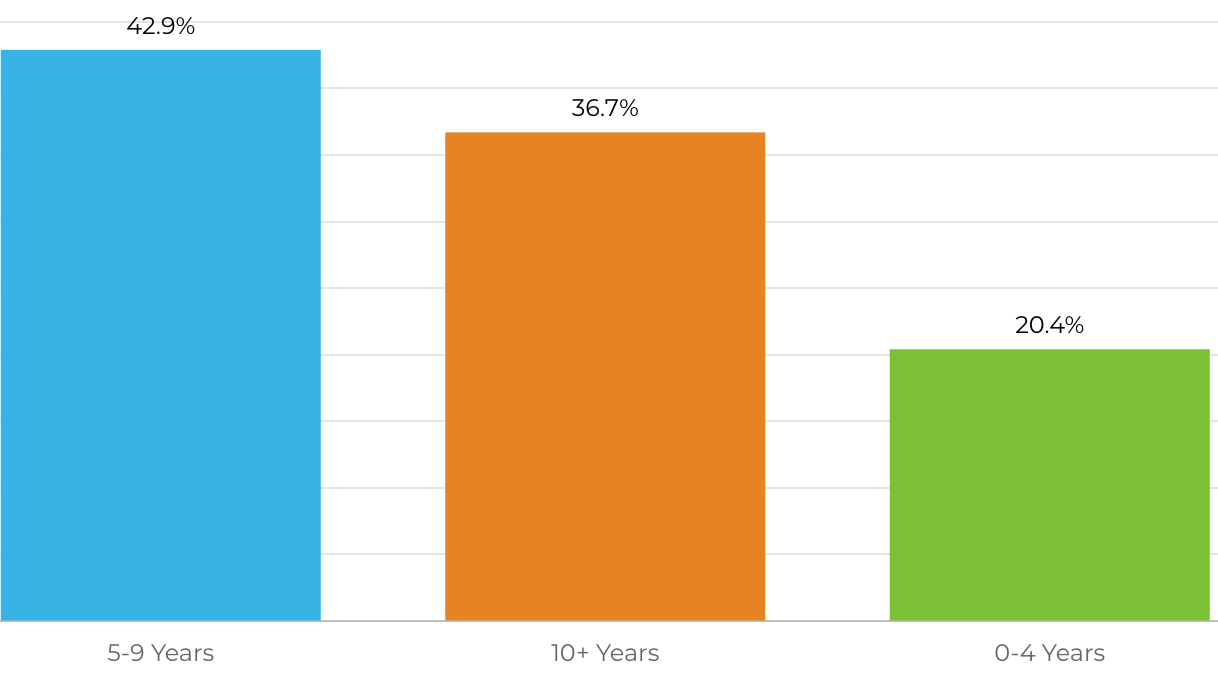
XFLT site
Performance:
Persistent market volatility led to declines in XFLT's portfolio valuations over the past fiscal year ending 9/30/22, with CLO equity holdings being the biggest drag on performance. XFLT issued 6.98M common shares, in an ATM program, bringing in ~$60M.
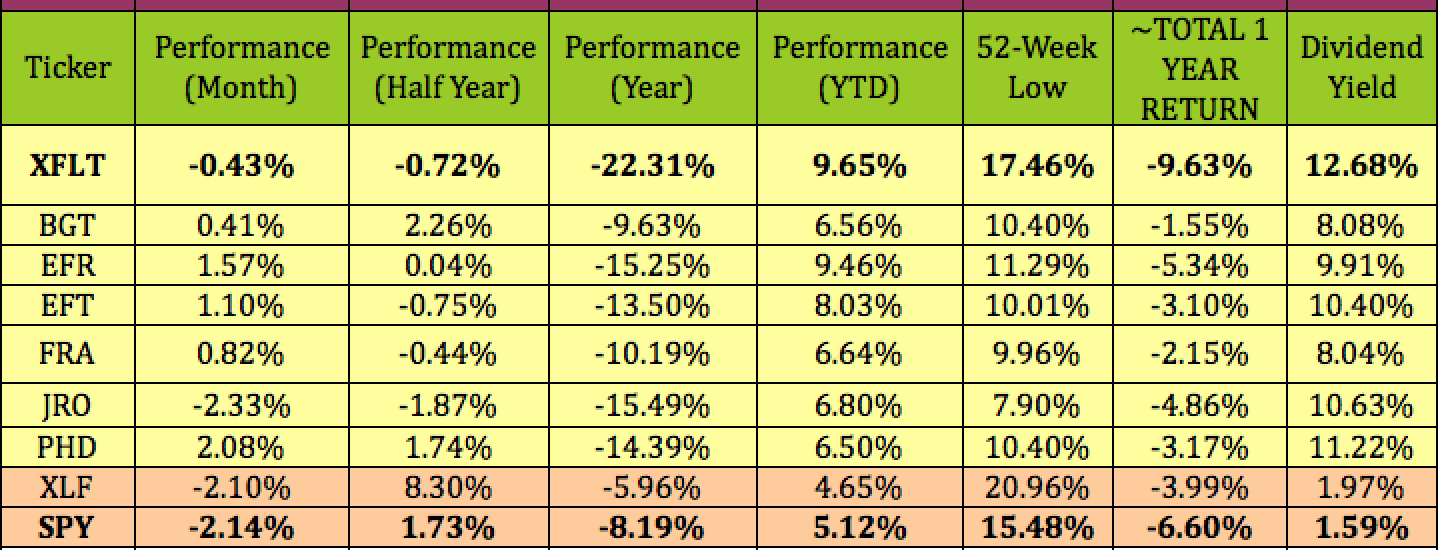
BGT had the best ~total return over the past year, at -1.55%, vs. -9.63% for XFLT, -6.6% for the S&P 500, and -4% for the Financial sector, XLF.
So far in 2023, XFLT has been the leader, gaining 9.65%, just ahead of EFR, at 9.46%, and far ahead of the S&P and the financial sector.
JRO sits 7.9% above its 52-week low, the closest to that figure in the group, while XFLT is the highest, at 17.46% above its low.
Hidden Dividend Stocks Plus
Looking back further, XFLT's 3-year and 5-year price returns top this group, at 7.6% and 3.65% respectively, while its 3-year NAV return is also tops.
FRA has the 2nd best 3-year price return, at 5.81%, while BGT has the second-best 3-year NAV return, and the best 5-year and 10-year returns:

Hidden Dividend Stocks Plus
Valuations:
Since NAV/Share is calculated at the end of each trading day, you have to look at the most recent closing values to determine the current NAV discount or premium. Buying CEFs like ECC at a deeper discount than their historical average discounts/premiums can be a useful strategy, due to mean reversion.
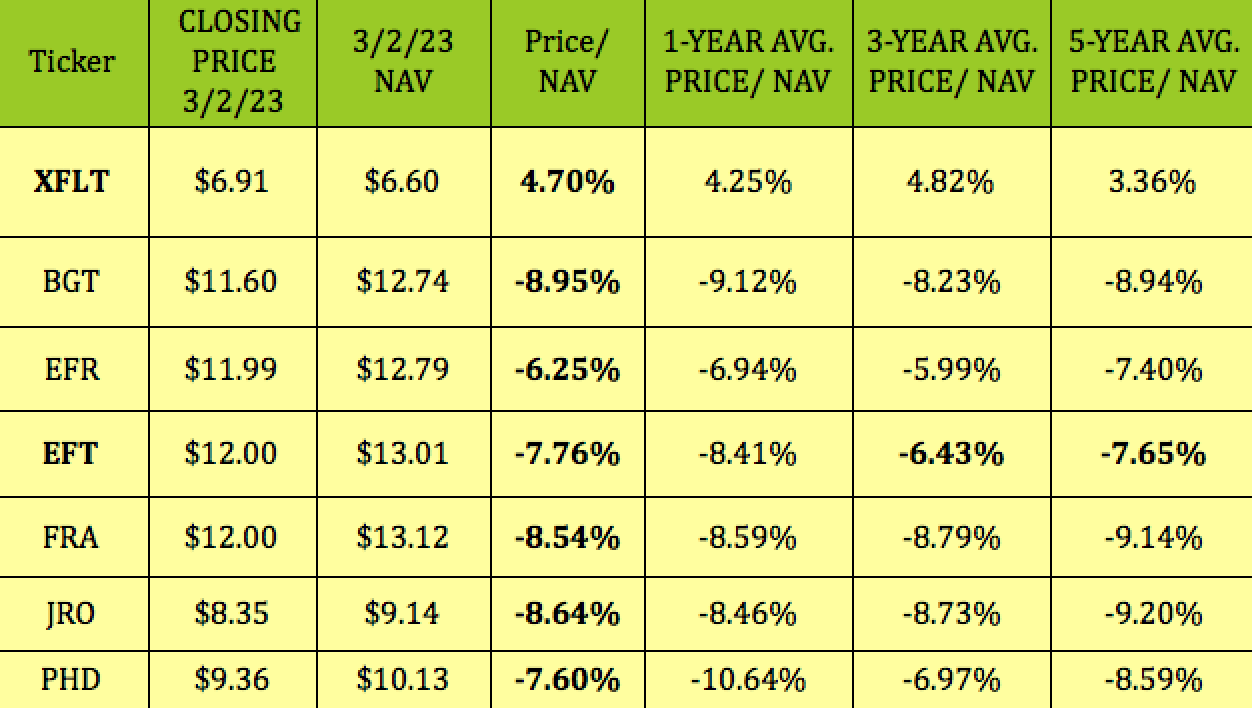
At its 3/2/23 $6.91 closing price, XFLT was trading at a 4.7% premium to its NAV of $6.60, vs. its 1-, 3-, and 5-year average premiums of 4.25%, 4.82%, and 3.36%.
From its inception in 2017 through September 2022, XFLT has traded at an average 3.52% premium to NAV. XFLT's inception price was $10.00 and its inception NAV was $9.78.
BGT's 8.95% discount is cheaper than its 3-year average, and in line with its 5-year average, whereas EFT's -7.76% discount is cheaper than its 3-year and 5-year averages of -6.43% and -7.65%:
Hidden Dividend Stocks Plus
Parting Thoughts:
We hope this article has given you a good starting point for your due diligence into the world of floating rate CEFs. As you've noticed, there's no clear cut winner for all of the metrics covered in this article. Long term, XFLT has the best NAV return over the past three years, while BGT has done the best over the past 5- and 10-year periods.
All tables furnished by Hidden Dividend Stocks Plus, unless otherwise noted.
Our Marketplace service, Hidden Dividend Stocks Plus, focuses on undercovered, undervalued income vehicles, and special high yield situations.
We scour the US and world markets to find solid income opportunities with dividend yields ranging from 5% to 10%-plus, backed by strong earnings.
We publish exclusive articles each week with investing ideas for the HDS+ site that you won't see anywhere else.
Find out now how our portfolio is beating the market by a wide margin in 2023.
This article was written by

Robert Hauver, MBA, was VP of Finance for an industry-leading corporation for 18 years, and publishes SA articles under the name DoubleDividendStocks. TipRanks rates DoubleDividendStocks in the Top 25 of all financial bloggers, and Seeking Alpha rates us in the Top 5 of several categories, including Dividend Ideas, Basic Materials, and Utilities.
"Hidden Dividend Stocks Plus", a Seeking Alpha Marketplace service, which focuses on undercovered and undervalued income vehicles. HDS+ scours the world's markets to find solid income opportunities with dividend yields ranging from 5% to 10%-plus, backed by strong earnings.
Disclosure: I/we have no stock, option or similar derivative position in any of the companies mentioned, but may initiate a beneficial Long position through a purchase of the stock, or the purchase of call options or similar derivatives in BGT over the next 72 hours. I wrote this article myself, and it expresses my own opinions. I am not receiving compensation for it (other than from Seeking Alpha). I have no business relationship with any company whose stock is mentioned in this article.
Additional disclosure: Disclaimer: This article was written for informational purposes only, and is not intended as personal investment advice. Please practice due diligence before investing in any investment vehicle mentioned in this article.