ILCV: There Are Better Options Among Large Cap Value ETFs

Summary
- iShares Morningstar Large-Cap Value ETF implements a strategy similar to the S&P 500 Value Index.
- ILCV looks cheaper than SPYV regarding valuation ratios.
- ILCV is heavier in healthcare and energy, and lighter in technology.
- SPYV has better past performance and liquidity.
- Quantitative Risk & Value members get exclusive access to our real-world portfolio. See all our investments here »
Tom Merton/iStock via Getty Images
ILCV strategy and portfolio
The iShares Morningstar Value ETF (NYSEARCA:ILCV) was launched on 6/28/2004 and tracks the Morningstar US Large-Mid Cap Broad Value Index. It has 501 holdings, a 12-month distribution yield of 2.22% and a cheap expense ratio of 0.04%.
As described in the prospectus by iShares, “the stocks in the Underlying Index are designated as “value” because they are issued by companies that typically have relatively low valuations based on price-to-earnings, price-to-book value, price-to-sales, price-to-cash flow and dividend yields.”
The large and mid cap universe is defined as companies with higher market capitalization representing 90% of Morningstar’s investable universe. Stocks are classified by the index provider in three categories: value, growth and blend. The Large-Mid Cap Broad Value Index includes the value and blend categories. Constituents are weighted by a modified free float capitalization, defined as outstanding shares adjusted for block ownership to reflect only shares available for investment. For stocks in the blend category, the weight is adjusted by a style factor allowing to split the market cap between “broad value” and “broad growth” indexes. This process is very similar to the S&P 500 Value Index, represented in this article by the SPDR Portfolio S&P 500 Value ETF (SPYV).
The portfolio had a turnover rate of 21% in the last fiscal year. The fund is mostly invested in large cap companies, and mid-caps weigh a bit less than 20% of asset value, according to Fidelity.
Aggregate valuation ratios of ILCV are materially cheaper than for the large cap benchmark S&P 500 (SPY), and also than for SPYV.
ILCV | SPYV | SPY | |
Price/Earnings TTM | 16.06 | 19.7 | 20.33 |
Price/Book | 2.66 | 2.62 | 3.76 |
Price/Sales | 1.74 | 1.86 | 2.38 |
Price/Cash Flow | 11.82 | 14.1 | 15.08 |
Source: Fidelity
The heaviest sectors are financials (18.7%), healthcare (14.8%) and industrials (11.1%). Other sectors are below 10%. Compared to its competitor SPYV, the fund overweights healthcare, energy and to a lesser extent consumer staples. It underweights mostly technology, and to a lesser extent real estate. Compared to the S&P 500, it overweights mostly financials, and massively underweights technology.
Sector Breakdown (Chart: author; data: iShares, SSGA)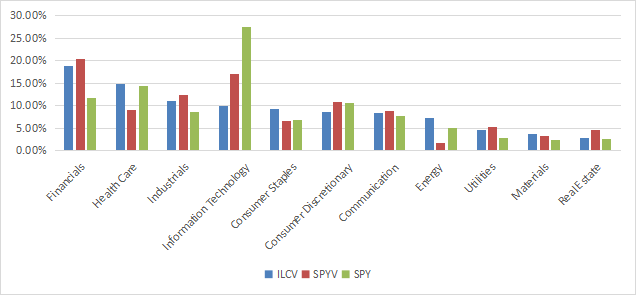
The top 10 holdings represent 20.4% of asset value. The next table lists their weights and valuation ratios. The heaviest one weighs about 3%, so risks related to individual stocks are moderate.
Ticker | Name | Weight % | P/E ttm | P/E fwd | P/Sales | P/Book | P/FCF | Yield |
Berkshire Hathaway, Inc. | 3.07 | N/A | 20.00 | 2.24 | 1.43 | 31.05 | 0 | |
Exxon Mobil Corp. | 2.54 | 8.39 | 10.29 | 1.15 | 2.36 | 10.61 | 3.44 | |
JPMorgan Chase & Co. | 2.29 | 11.67 | 10.85 | 2.67 | 1.58 | 4.85 | 3.42 | |
Amazon.com, Inc. | 2.23 | N/A | 60.21 | 1.85 | 6.50 | N/A | 0 | |
Johnson & Johnson | 2.21 | 22.62 | 14.50 | 4.25 | 5.26 | 73.42 | 3.98 | |
Meta Platforms, Inc. | 2.17 | 20.33 | 18.09 | 3.95 | 3.67 | 24.19 | 0 | |
Procter & Gamble Co. | 1.84 | 24.58 | 24.00 | 4.32 | 7.96 | 130.38 | 3.10 | |
AbbVie, Inc. | 1.51 | 23.28 | 13.88 | 4.73 | 15.91 | 19.32 | 4.69 | |
Bank of America Corp. | 1.29 | 10.52 | 9.64 | 2.34 | 1.12 | 3.68 | 0.71 | |
Pfizer Inc. | 1.26 | 7.42 | 10.66 | 2.33 | 2.44 | 11.10 | 1.50 |
Ratios: Portfolio123
Historical performance
The fund was launched on 06/28/2004. The ticker, name, expense ratio and underlying index were modified in March 2021. However, the change in indexes is not a major one. It is an extension of eligible stocks to mid-caps and to the “blend” category in Morningstar classification. I evaluate the overlap between the old and the new model represents between 60% and 70% of asset value (this is an estimation). Moreover, the new 30-40% is likely highly correlated with the rest, because it follows the same strategy in a comparable size segment. In conclusion about the ETF reshuffling, the old and new indexes have similar definitions and are expected to have similar performances.
Since inception, ILCV has lagged both the S&P 500 and the S&P 500 Value Index (see next table and chart).
Tot. Return | Annual. Return | Drawdown | Sharpe ratio | Volatility | |
ILCV | 261.33% | 7.13% | -58.63% | 0.45 | 14.84% |
SPYV | 318.46% | 7.97% | -58.45% | 0.49 | 15.40% |
SPY | 409.82% | 9.12% | -55.19% | 0.57 | 15.13% |
Data calculated with Portfolio123
ILCV since inception vs SPYV, SPY (Portfolio123)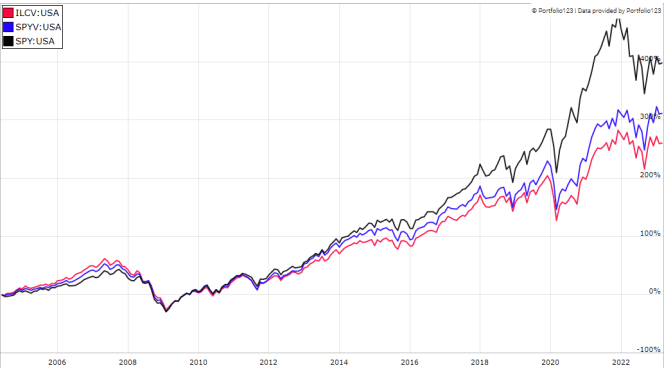
In the last 12 months, ILCV beats SPY, but it is behind SPYV and some popular large cap value ETFs:
- First Trust Large Cap Value AlphaDEX Fund (FTA)
- Avantis U.S. Large Cap Value ETF (AVLV)
- Invesco Dynamic Large Cap Value ETF (PWV)
The reshuffled underlying index has been of little help against competitors.
ILCV vs competitors, last 12 months (Portfolio123)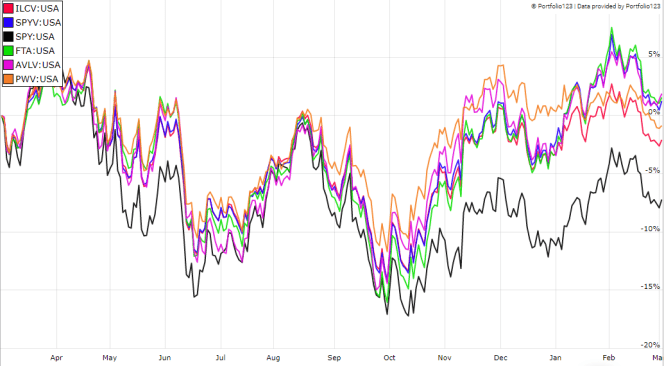
Comparing ILCV with my Dashboard List model
The Dashboard List is a list of 80 stocks in the S&P 1500 index, updated every month based on a simple quantitative methodology. All stocks in the Dashboard List are cheaper than their respective industry median in Price/Earnings, Price/Sales and Price/Free Cash Flow. After this filter, the 10 companies with the highest Return on Equity in every sector are kept in the list. Some sectors are grouped together: energy with materials, communication with technology. Real estate is excluded because these valuation metrics don't work well in this sector. I have been updating the Dashboard List every month on Seeking Alpha since December 2015, first in free-access articles, then in Quantitative Risk & Value.
The next table compares ILCV performance since inception with the Dashboard List model, with a tweak: here the list is reconstituted annually instead of once a month, so as to make it comparable with a passive index.
Tot. Return | Annual. Return | Drawdown | Sharpe ratio | Volatility | |
ILCV | 261.33% | 7.13% | -58.63% | 0.45 | 14.84% |
Dashboard List (annual) | 534.74% | 10.41% | -52.83% | 0.59 | 17.42% |
Past performance is not a guarantee of future returns. Data Source: Portfolio123
The Dashboard List beats ILCV by over 3 percentage points in annualized return. However, the fund performance is real, whereas the list is simulated.
About the price/book ratio
I like the idea of mixing several value ratios like Morningstar does in the underlying index definition. However, the price/book ratio (P/B) adds some risk in the strategy. Historical data show that a large group of companies with low P/B has a higher probability to hold value traps than a same-size group with low price/earnings, price/sales or price/free cash flow. Statistically, such a group will also have a higher volatility and deeper drawdowns in price. The next table shows the return and risk metrics of the cheapest quarter of the S&P 500 (i.e.125 stocks) measured in price/book, price/earnings, price/sales and price/free cash flow. The sets are reconstituted annually between 1/1/2000 and 1/1/2023 with elements in equal weight.
Annual. Return | Drawdown | Sharpe ratio | Volatility | |
Cheapest quarter in P/B | 8.54% | -81.55% | 0.35 | 37.06% |
Cheapest quarter in P/E | 10.71% | -73.62% | 0.48 | 25.01% |
Cheapest quarter in P/S | 12.82% | -76.16% | 0.47 | 34.83% |
Cheapest quarter in P/FCF | 15.32% | -74.77% | 0.61 | 27.03% |
Data calculated with Portfolio123
This explains my choice of not using P/B in the Dashboard List model.
Takeaway
The iShares Morningstar Large-Cap Value ETF implements a rule-based strategy using various metrics to classify a large and mid-cap universe in value, growth and blend subsets, and invests in the value and blend ones. This process is similar to S&P value indexes. The index has been slightly modified in 2021, but it should not change significantly the prospective performance and risk. Management fees have also changed and they are on par with SPYV now (0.04%). ILCV has lagged SPYV since inception 18.5 years ago. Moreover, it has much lower trading volumes, which may be an issue for swing-trading and tactical allocation strategies switching between value and growth depending on market conditions. In conclusion, SPYV looks a better choice than ILCV for long term investors, and for traders as well.
Editor's Note: This article discusses one or more securities that do not trade on a major U.S. exchange. Please be aware of the risks associated with these stocks.
Quantitative Risk & Value (QRV) features data-driven strategies in stocks and closed-end funds outperforming their benchmarks since inception. Get started with a two-week free trial now.

This article was written by

Step up your investing experience: try Quantitative Risk & Value for free now (limited offer).
I am an individual investor and an IT professional, not a finance professional. My writings are data analysis and opinions, not investment advice. They may contain inaccurate information, despite all the effort I put in them. Readers are responsible for all consequences of using information included in my work, and are encouraged to do their own research from various sources.
Disclosure: I/we have a beneficial long position in the shares of AMZN, META, PFE either through stock ownership, options, or other derivatives. I wrote this article myself, and it expresses my own opinions. I am not receiving compensation for it (other than from Seeking Alpha). I have no business relationship with any company whose stock is mentioned in this article.