IVOV: A Mid-Cap Value ETF By Vanguard

Summary
- IVOV tracks the S&P Mid-Cap 400 Value Index.
- Valuation metrics are not much cheaper than in the parent index S&P 400.
- I compare it to competitors regarding several points.
- Two common shortcomings in value indexes.
- Quantitative Risk & Value members get exclusive access to our real-world portfolio. See all our investments here »
sasirin pamai/iStock via Getty Images
IVOV Strategy and Portfolio
The Vanguard S&P Mid-Cap 400 Value ETF (NYSEARCA:IVOV) has been tracking the S&P MidCap 400 Value Index since 09/07/2010. It has 299 holdings, a 12-month distribution yield of 1.82% and an expense ratio of 0.15%. The same portfolio is also available as a mutual fund (VMFVX). The fund is a direct competitor to iShares S&P Mid-Cap 400 Value ETF (IJJ) and SPDR S&P 400 Mid Cap Value ETF (MDYV), which track the same index and have similar management fees.
S&P Mid-Cap 400 Value ETFs | IJJ | MDYV | IVOV |
Assets | $8.23B | $2.99B | $861M |
Avg Daily Volume | 568K | 370K | 16K |
Expense Ratio | 0.18% | 0.15% | 0.15% |
Inception | 7/24/2000 | 11/8/2005 | 09/07/2010 |
The Vanguard fund is smaller and less liquid than its peers.
As described by S&P Dow Jones Indices, S&P 400 constituents are classified in value and growth subsets using three valuation ratios and three growth metrics. The valuation ratios are book value to price, earnings to price and sales to price. By construction, 33% of S&P 400 constituents exclusively belongs to each style, and 34% belongs to both styles. The value subset serves as S&P 400 Value Index and is rebalanced annually. It is capital-weighted, with an adjustment for constituents belonging to both styles. For example, a company with a value rank better than its growth rank is given a larger weight in the Value Index than in the Growth Index. The turnover rate was 33% of the average portfolio value in the most recent fiscal year.
The aggregate valuation ratios of IVOV are lower than for its parent index, represented in the table below by the SPDR S&P Midcap 400 ETF (MDY). However, the difference is not as large as we could expect.
IVOV | MDY | |
Price/Earnings TTM | 12.87 | 13.89 |
Price/Book | 1.81 | 2.34 |
Price/Sales | 0.98 | 1.26 |
Source: Fidelity
The top 3 sectors are the same in IVOV and MDY, but not in the same order (see next chart). Financials dominate in the value index, whereas industrials come first in the broader index. Also, these top 3 sectors are better balanced in the value index. Compared to MDY, the value fund overweights financials, consumer discretionary and real estate. It almost ignores energy.
Sector breakdown (chart: author: data: Vanguard)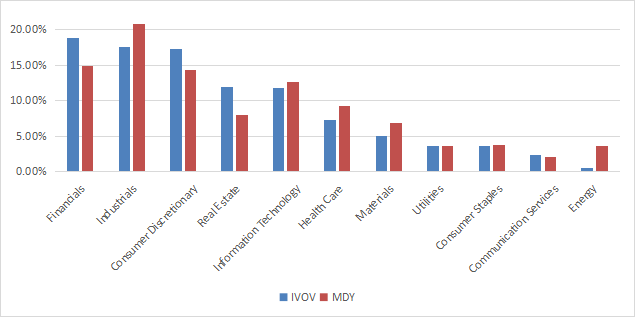
The next table lists the top 10 holdings with their weights and main valuation ratios. Their aggregate weight is 8.2% and none of them is above 1%, so risks related to individual companies are very low.
Ticker | Name | Weight | P/E TTM | P/E Fwd | P/Sales | P/Book | P/FCF | Yield |
Cleveland-Cliffs, Inc. | 0.97% | 8.84 | 13.58 | 0.50 | 1.46 | 7.71 | 0 | |
Jabil, Inc. | 0.93% | 12.20 | 10.04 | 0.34 | 4.59 | 29.10 | 0.38 | |
Reinsurance Group of America, Inc. | 0.89% | 15.94 | 9.21 | 0.61 | 2.71 | 8.16 | 2.19 | |
Alcoa Corp. | 0.81% | N/A | 22.19 | 0.74 | 1.87 | 35.19 | 0.75 | |
Regal Rexnord Corp. | 0.81% | 21.96 | 15.15 | 2.04 | 1.67 | 48.19 | 0.87 | |
Webster Financial Corp. | 0.80% | 14.62 | 7.59 | 3.33 | 1.20 | 8.72 | 3.08 | |
Jones Lang LaSalle, Inc. | 0.77% | 12.95 | 11.59 | 0.40 | 1.38 | 38.76 | 0 | |
Lear Corp. | 0.76% | 25.61 | 13.00 | 0.40 | 1.79 | 42.28 | 2.20 | |
Capri Holdings Ltd. | 0.75% | 9.37 | 8.13 | 1.12 | 2.92 | 16.51 | 0 | |
UGI Corp. | 0.73% | 42.56 | 11.94 | 0.68 | 1.56 | N/A | 3.86 |
Ratios: Portfolio123
Performance
Since inception (09/07/2010), IVOV is almost on par with MDY in return and risk metrics.
Total Return | Annual Return | Drawdown | Sharpe ratio | Volatility | |
IVOV | 297.64% | 11.71% | -45.99% | 0.64 | 18.76% |
MDY | 303.77% | 11.85% | -42.18% | 0.68 | 17.29% |
Data calculated with Portfolio123
IJJ tracks the same underlying index, and it is much older (07/24/2000), so it may be used to assess the S&P MidCap 400 Value Index on a longer period. The value index has outperformed the parent index by 1.17 percentage point in annualized return (see next table). Risk measured in drawdown and standard deviation of monthly returns (volatility) is similar.
since July 2000 | Total Return | Annual Return | Drawdown | Sharpe ratio | Volatility |
S&P 400 Value (IJJ) | 833.39% | 10.43% | -58.00% | 0.55 | 18.62% |
S&P 400 (IJH) | 634.34% | 9.26% | -55.07% | 0.5 | 18.07% |
Data calculated with Portfolio123
The next chart compares IVOV since inception with MDY and 2 other mid-cap value funds based on different indexes: iShares Russell Mid-Cap Value ETF (IWS) and iShares Morningstar Mid-Cap Value ETF (IMCV). The Vanguard fund is the best performer by a short margin.
IVOV vs competitors since inception (Portfolio123)
It is also ranked first in the last 12 months, and it is the only one in the list above break-even (as of writing).
IVOV vs competitors, last 12 months (Portfolio123)
Comparison with my Dashboard List Model
The Dashboard List is a list of 60 to 80 stocks in the S&P 1500 index, updated every month based on a simple quantitative methodology. All stocks in the Dashboard List are cheaper than their respective industry median in Price/Earnings, Price/Sales and Price/Free Cash Flow. An exception in utilities: the Price/Free Cash Flow is not taken into account to avoid some inconsistencies. Then, the 10 eligible companies with the highest Return on Equity in every sector are kept in the list. Some sectors are grouped together: energy with materials, communication with technology. Real estate is excluded because these valuation metrics don't work well in this sector. I have been updating the Dashboard List every month on Seeking Alpha since December 2015, first in free-access articles, then in Quantitative Risk & Value.
The next table compares the underlying index performance since July 2000 with the Dashboard List model, with a tweak: here, the list is reconstituted once a year to make it comparable with a passive index.
since July 2000 | Annual Return | Drawdown | Sharpe ratio | Volatility |
IVOV index (IJJ) | 10.43% | -58.00% | 0.55 | 18.62% |
Dashboard List (annual) | 12.36% | -57.52% | 0.68 | 17.26% |
Past performance is not a guarantee of future returns. Data Source: Portfolio123
The Dashboard List beats IVOV by about 2 percentage points in annualized return. ETF performance is real, whereas the model is simulated.
Two Common Shortcomings in Value Indexes
Most value ETFs have two shortcomings in my opinion, and IVOV is no exception. The first one is to classify all stocks on the same criteria. It means the valuation ratios are considered comparable across sectors. Obviously, they are not: my monthly dashboard here shows how 3 median valuation ratios may differ across sectors now and in historical averages. A consequence is to overweight sectors where valuation ratios are naturally cheaper, especially financials. Some other sectors are disadvantaged: those with large intangible assets like technology. Companies with large intangible assets are those with a business model based on massive R&D, or a strong branding, or large user databases, or operating in a field where competition is limited by an expensive entry ticket. All these elements are not correctly reflected by valuation ratios.
The second weakness comes from the price/book ratio (P/B), which adds some risk in the strategy. Historical data show that a large group of companies with low P/B has a higher probability to hold value traps than a same-size group with low price/earnings, price/sales or price/free cash flow. Statistically, such a group will also have a higher volatility and deeper drawdowns in price. The next table shows the return and risk metrics of the cheapest quarter of the S&P 500 (i.e.125 stocks) measured in price/book, price/earnings, price/sales and price/free cash flow. The sets are reconstituted annually between 1/1/2000 and 1/1/2023 with elements in equal weight.
Annual Return | Drawdown | Sharpe ratio | Volatility | |
Cheapest quarter in P/B | 8.54% | -81.55% | 0.35 | 37.06% |
Cheapest quarter in P/E | 10.71% | -73.62% | 0.48 | 25.01% |
Cheapest quarter in P/S | 12.82% | -76.16% | 0.47 | 34.83% |
Cheapest quarter in P/FCF | 15.32% | -74.77% | 0.61 | 27.03% |
Data calculated with Portfolio123
This explains why I use P/FCF and not P/B in the Dashboard List model.
Takeaway
The Vanguard S&P Mid-Cap 400 Value ETF implements a systematic strategy based on value and growth ratios. It has 4 close competitors: MDYV and IJJ have the same underlying index, whereas IWS and IMCV track other mid-cap value indexes. IJJ, IVOV and MDYV are equivalents for long-term investors, but IJJ and MDYV are better than IVOV for tactical asset allocation and trading, because they have much larger trading volumes. For example, they may be part of a strategy switching between value and growth, and/or between large and mid-cap, depending on market conditions. IVOV underlying index has outperformed its parent index, the S&P Mid-Cap 400, by about 1 percentage point in annualized return since 2000. It is a good all-purpose mid-cap value index, but it suffers from two methodological weaknesses, in my opinion: ranking stocks regardless of their industries and relying too much on the price/book ratio.
Quantitative Risk & Value (QRV) features data-driven strategies in stocks and closed-end funds outperforming their benchmarks since inception. Get started with a two-week free trial now.

This article was written by

Step up your investing experience: try Quantitative Risk & Value for free now (limited offer).
I am an individual investor and an IT professional, not a finance professional. My writings are data analysis and opinions, not investment advice. They may contain inaccurate information, despite all the effort I put in them. Readers are responsible for all consequences of using information included in my work, and are encouraged to do their own research from various sources.
Disclosure: I/we have no stock, option or similar derivative position in any of the companies mentioned, and no plans to initiate any such positions within the next 72 hours. I wrote this article myself, and it expresses my own opinions. I am not receiving compensation for it (other than from Seeking Alpha). I have no business relationship with any company whose stock is mentioned in this article.