HYG: The Price Is Low, Yield Is Sort Of High - Still Not Attractive

Summary
- HYG has experienced a large sell-off over the last year.
- Much of this sell-off has been driven by an increase in interest rates, and not by an increase in the spreads of high-yield corporate bonds.
- The fundamental backdrop for corporate credit remains relatively benign, and while HY defaults are expected to increase in the next year, the projected level of defaults remains low.
- Despite this, HYG remains relatively unattractive based on a forecasting model for HY corporate bond returns.
- If this forecast is correct, investors can find more attractive risk-reward choices for their portfolios.
KanawatTH
Price action and liquidity
The iShares iBoxx $ High Yield Corporate Bond ETF (NYSEARCA:HYG) is an ETF which tracks the U.S. high-yield (HY) corporate bond market. Like all risk assets, HYG has sold off since its early-2022 highs. The next chart shows the price of HYG (in blue) and its net-asset value (NAV) in orange. The NAV of the ETF is the bottoms-up valuation of all of its holdings of corporate bonds. The authorized participant/creation units mechanism of ETFs works to ensure that market prices and NAVs don't get too far away from each other, but gaps still exist.
HYG prices and NAV values. (QuantStreet, Bloomberg)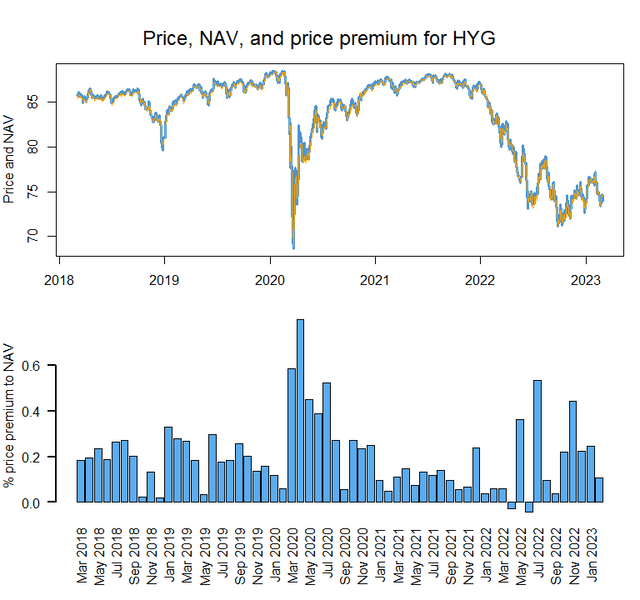
The bottom panel in the chart shows the premium or discount, as a percent of the ETF's price, at which the ETF is trading relative to its NAV. A positive number means that the ETF's market price is higher than its bottoms-up NAV. This has been the case with HYG over the last few years, which is indicative of a robust demand to create high-yield credit exposure through the ETF rather than through the underlying basket of bonds.
Owning a high-yield ETF rather than individual HY bonds is preferable because HYG is considerably more liquid than its components, though there has been some recent academic work which raises questions about how well this mechanism would work in a stressed market environment.
To get a sense of the flows and liquidity associated with HYG, the top panel of the next graph shows that HYG experienced a large outflow in February of 2023. This measures the change in shares outstanding of HYG from January to February as a percent of the shares outstanding at the end of January. Skittish investors concerned about worse-than-expected inflation numbers pulled assets from the ETF in February, which means that ownership of those HY corporate bonds shifted to a different, perhaps institutional, set of holders.
HYG flows and turnover (QuantStreet, Bloomberg)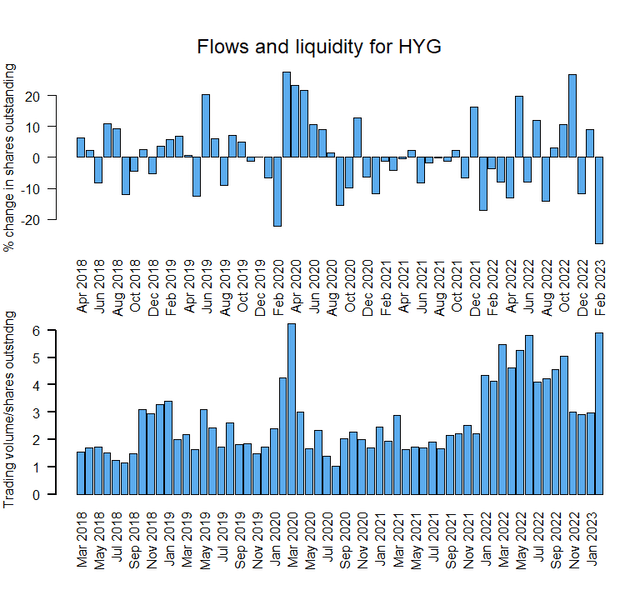
The bottom panel in the chart shows the monthly trading volume in HYG as a percent of the total shares outstanding at the end of that month. 6x means that 6 times as many shares of HYG changed hands in February 2023 as were outstanding. That speaks to a highly liquid ETF, which is good news for HYG holders: it means you can easily trade in and out of HYG if the need arises. (For context, another quite liquid high-yield corporate bond ETF, JNK, has only 3x turnover in February.)
Fundamentals
For HY fundamentals, we can piggy back off research done by the ratings agencies. For example, S&P's November 2022 year-ahead default forecast for HY stood at 3.75%. As the next chart from S&P shows, realized defaults in the HY space have been quite mild. This reflects a combination of relatively strong corporate balance sheets, ample cash and refinancing opportunities, and generally strong economic growth. The 3.75% forecast reflects an anticipated mild deterioration in all of these areas in the year ahead. If this default rate actually materializes it will not derail HY as an asset class, but it will certainly be a performance headwind.
Realized and forecasted default rates (S&P Global)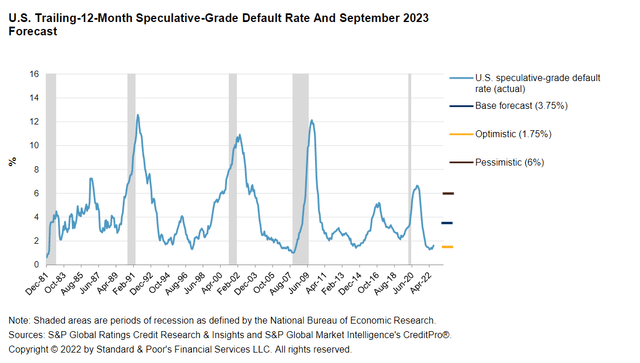
Valuations
While yields on HY corporate bonds are currently high at 8.5%, this only reflects a moderate level of high yield spreads, and largely reflects the overall high level of interest rates. From a valuation perspective for HY as an asset class, the HY spread (shown as the red line below) is a more telling indicator than HY yields (the blue line). The HY spread is the part of HY bond yields which builds in compensation for anticipated defaults, which is one key risk from owning HY bonds (the other key risk being potential illiquidity in crisis times). If one is interested only in capturing high interest rate levels, then investment grade and government bonds are also options, and these come without the overhang of potential defaults. This future default risk, therefore, should receive ample compensation in order to make HY bonds attractive.
High-yield corporate bond yields and spreads (FRED)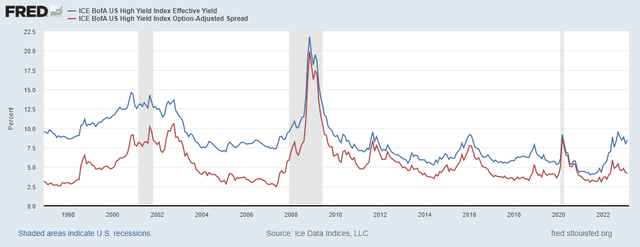
In terms of the pure dividend yield from owning HYG, if the next 12-month dividends equal the past 12-month dividends, investor will earn a 5.5% dividend yield from owning the ETF.
HYG dividend yield (QuantStreet, Bloomberg)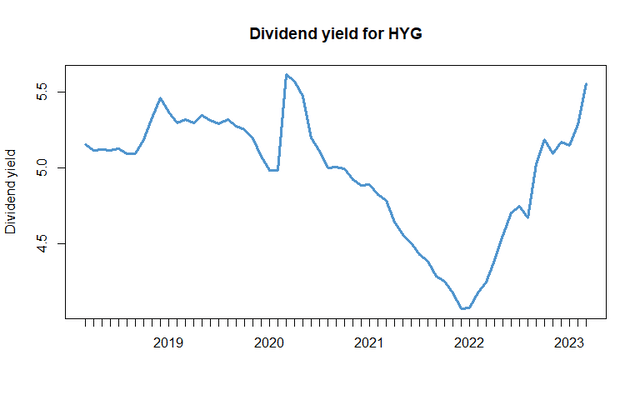
Is HYG attractive?
So how attractive are HY bonds, given the current state of variables known to forecast HY corporate bond returns. The graph below shows the current one-year ahead return forecast from a forecasting model developed by QuantStreet Capital. This is the output of a machine learning model which is trained using many different forecasting variables to predict one-year ahead returns on HY corporate bonds. The model selects the subset of the forecasting variables which it thinks represents the best combination of predictive measures.
HY one-year ahead return forecast (QuantStreet)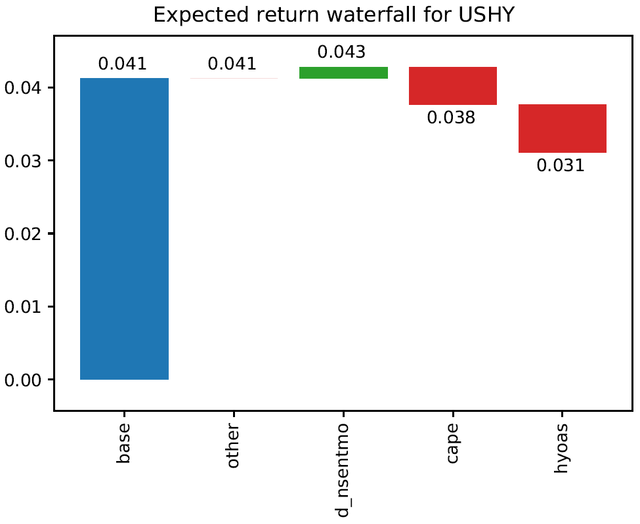
The blue bar, labeled base, shows that the model's one-year ahead return forecast for HY bonds if all forecasting variables were equal to their average values in the training window would be 4.1%. The two red bars show that the currently high level of the cyclically-adjusted P/E (CAPE) ratio for the S&P 500 index and the currently low level of HY spreads decrease this forecast to a not-so-attractive 3.1%.
The next chart shows the model's forecast over time.
HY return forecasts over time (QuantStreet)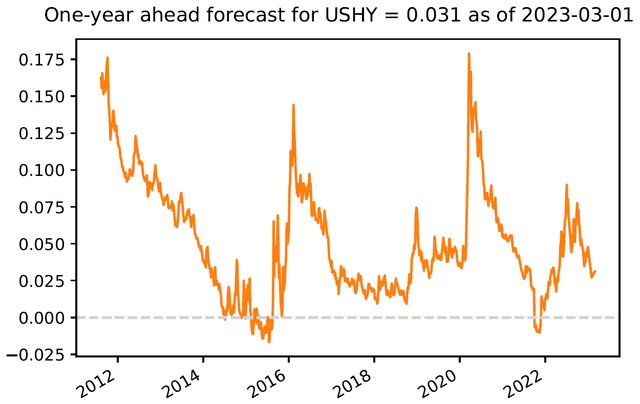
The current 3.1% return forecast for HY is at the low end of the historical range. The asset class is forecasted to earn a positive return over the next year, but this return forecast is paltry in the historical context. One way to reconcile the 5.5% dividend yield on HYG with a 3.1% return forecast is that the ETF may decline in value over the next year, either due to falling prices of HY bonds or due to realized corporate defaults.
Given the large sell-off that HY bonds have already experienced, and the generally solid liquidity of HYG, we see no compelling reason for shorting this ETF. In fact, shorting HYG seems likely to lose money. But if the forecast proves correct, there are more attractive risk-reward options investors can put into their portfolio than HYG.
As always, investors should carefully consider their own risk preferences and liquidity needs when thinking about their portfolio composition.
This article was written by
Disclosure: I/we have no stock, option or similar derivative position in any of the companies mentioned, and no plans to initiate any such positions within the next 72 hours. I wrote this article myself, and it expresses my own opinions. I am not receiving compensation for it (other than from Seeking Alpha). I have no business relationship with any company whose stock is mentioned in this article.
