RDIV: Will The Strong Short-Term Performance Continue?

Summary
- The RDIV gives exposure to high-yielding companies in the S&P 900 Index.
- RDIV has performed well in the short term, with a 7.2% return in 2022. However, longer-term returns are more modest.
- The RDIV ETF has very high volatility compared to its peers due to its index construction methodology.
- With mediocre long-term returns and distributions, I am hesitant to recommend this fund.
JHVEPhoto
The Invesco S&P Ultra Dividend Revenue ETF (NYSEARCA:RDIV) give investors exposure to high yielding companies in the S&P 900 Index. The ETF's selection methodology causes high turnover, as the whole index is reconstituted quarterly.
Relative to its peer funds, RDIV has performed the best on a 1Yr timeframe. However, longer-term returns are more modest. The ETF also has among the highest volatility and drawdowns amongst peers.
Although RDIV has strong short-term returns, its high volatility and mediocre distributions make me hesitant to recommend the fund.
Fund Overview
RDIV gives investors exposure to high dividend paying companies within the S&P 900 Index. The RDIV ETF tracks the S&P 900 Dividend Revenue-Weighted Index ("Index"). The Index starts by excluding the top 5% of securities by dividend yield from the S&P 900 Index. Then it excludes the top 5% from each sector by dividend payout ratio. Finally, it selects the top 60 securities by dividend yield and weighs them by their revenues, with a maximum security weight of 5%. The RDIV ETF and the underlying index are reconstituted and rebalanced quarterly according to dividend yields and revenue weightings.
The RDIV ETF has $1.0 billion in assets and charges a 0.39% expense ratio.
Portfolio Holdings
Figure 1 shows the RDIV ETF's sector allocation. The RDIV ETF's biggest sector weights are Financials (29.2%), Consumer Discretionary (11.1%), Consumer Staples (10.5%), Energy (9.9%), and Communication Services (8.3%).
Figure 1 - RDIV sector allocation (invesco.com)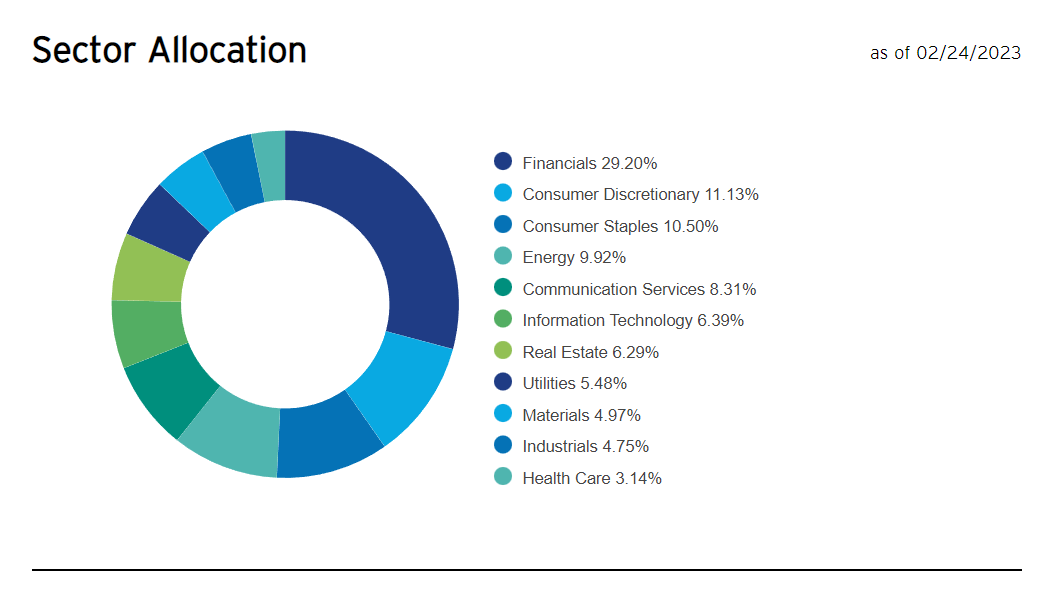
Relative to the market, as represented by the SPDR S&P 500 Trust ETF Trust, the RDIV ETF has a large underweight in Information Technology (6.4% vs. 27.2%), Health Care (3.1% vs. 14.5%), and Industrials (4.8% vs. 8.5%). It is heavily overweight Financials (29.2% vs. 11.7%), Energy (9.9% vs. 4.9%), and Consumer Staples (10.5% vs. 6.8%) (Figure 2).
Figure 2 - SPY sector allocation (ssga.com)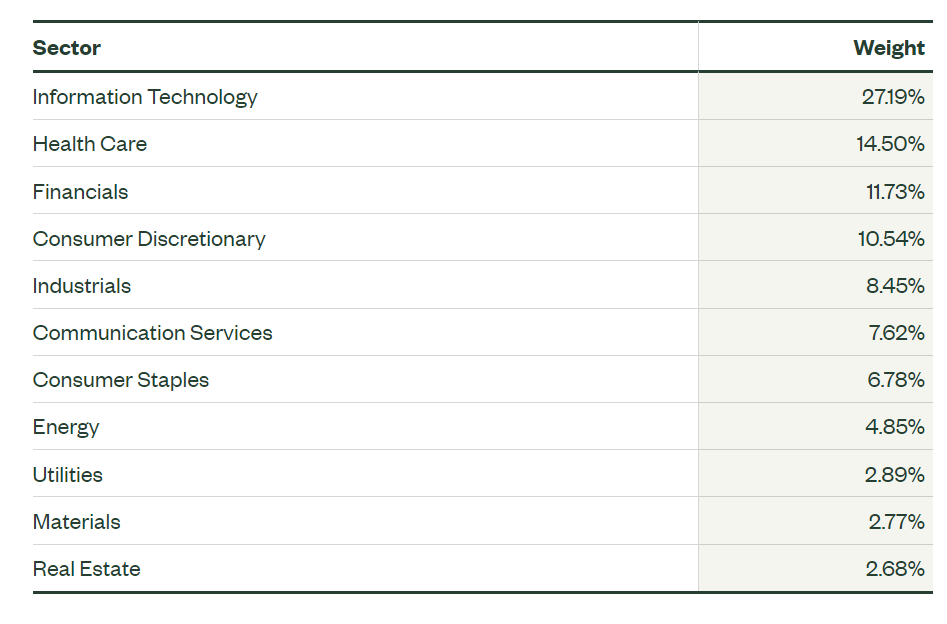
However, investors should note that RDIV's portfolio allocations can be quite volatile, as the fund's composition is completely reconstituted every quarter. For example, figure 3 shows RDIV's sector allocation as of the annual report on August 31, 2022. Notice that in the short time frame between the annual report and February 2023, the fund's Utilities allocation has gone from 17.5% to 5.5% and Health Care has gone from 15.4% to 3.1%. Meanwhile, Financials have gone from 22.2% to 29.2% and Consumer Discretionary was increased from 7.8% to 10.5%.
Figure 3 - RDIV sector allocation at August 31, 2022 (RDIV annual report)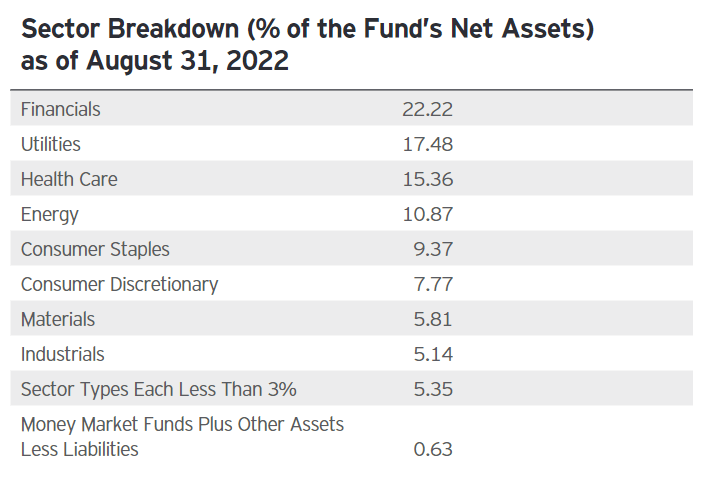
This constant trading causes RDIV to have a 110% portfolio turnover (i.e. the portfolio is completely turned over in less than 1 year) and significantly higher volatility than the Morningstar Category, Large Value. However, RDIV does have higher returns to compensate for its volatility (Figure 4).
Figure 4 - RDIV is a volatile fund (morningstar.com)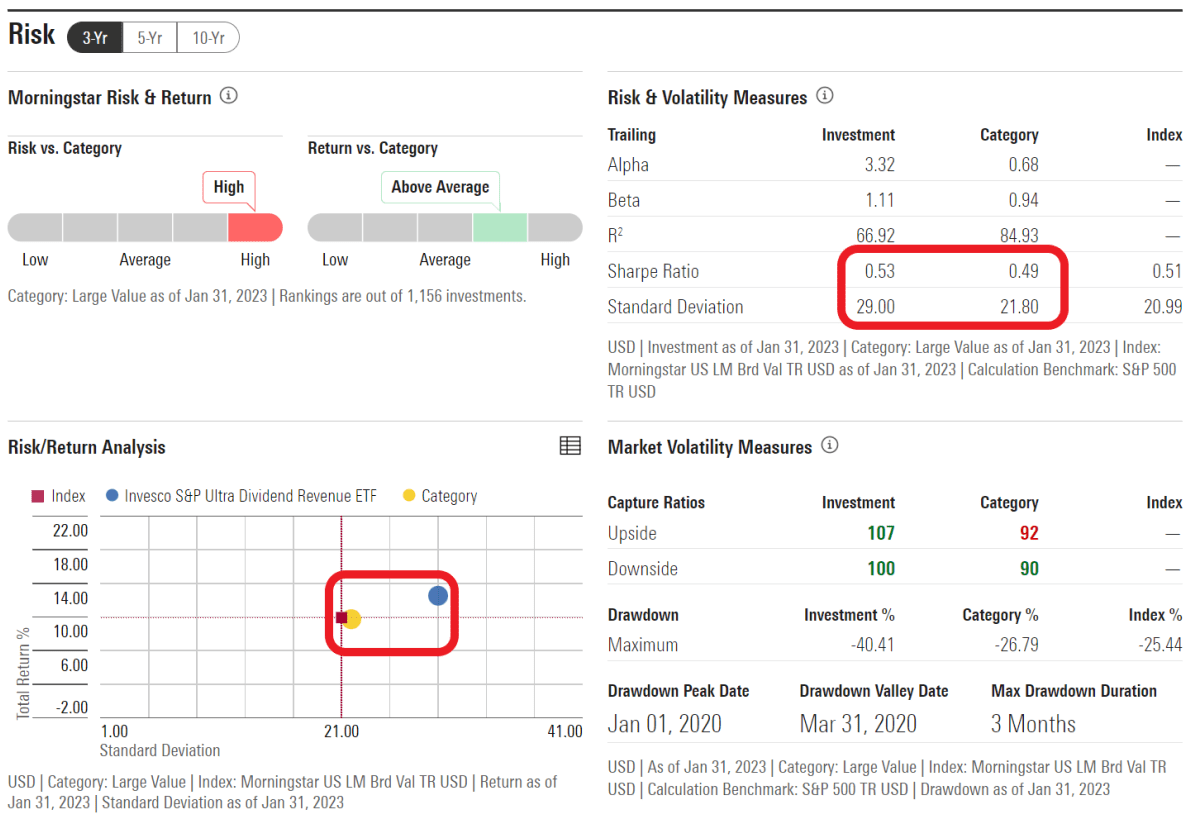
Returns
Figure 5 shows RDIV's historical returns. The RDIV ETF has done well in 2022, with 7.2% return, far outperforming the S&P 500's -18.1% return. This has allowed RDIV to post strong medium-term returns with 3Yr average annual returns of 12.5% to January 31, 2023. However, RDIV's 5Yr returns are more modest, at 9.0%.
Figure 5 - RDIV historical returns (morningstar.com)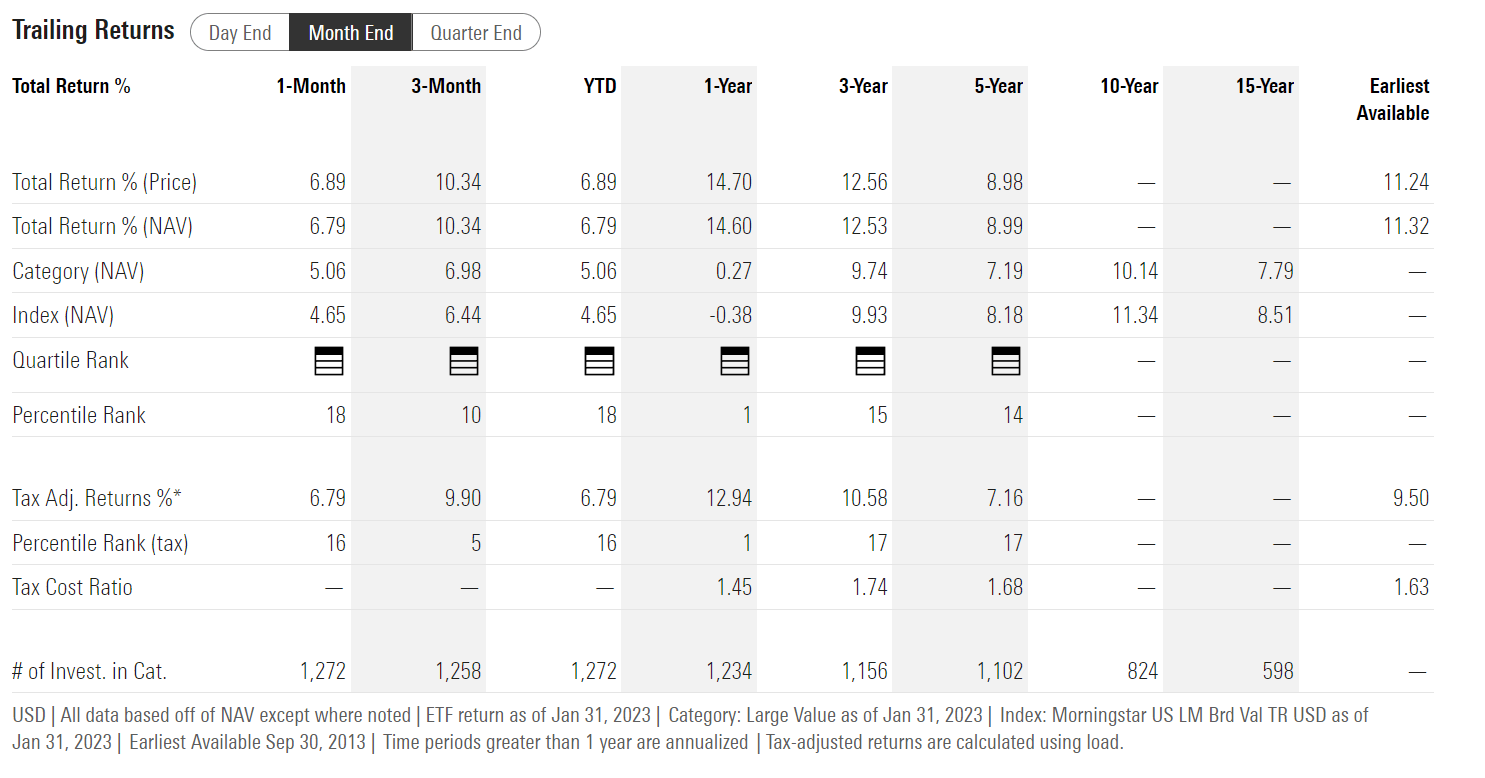
Figure 6 shows the SPY ETF's historical returns for comparison.
Figure 6 - SPY historical returns (morningstar.com)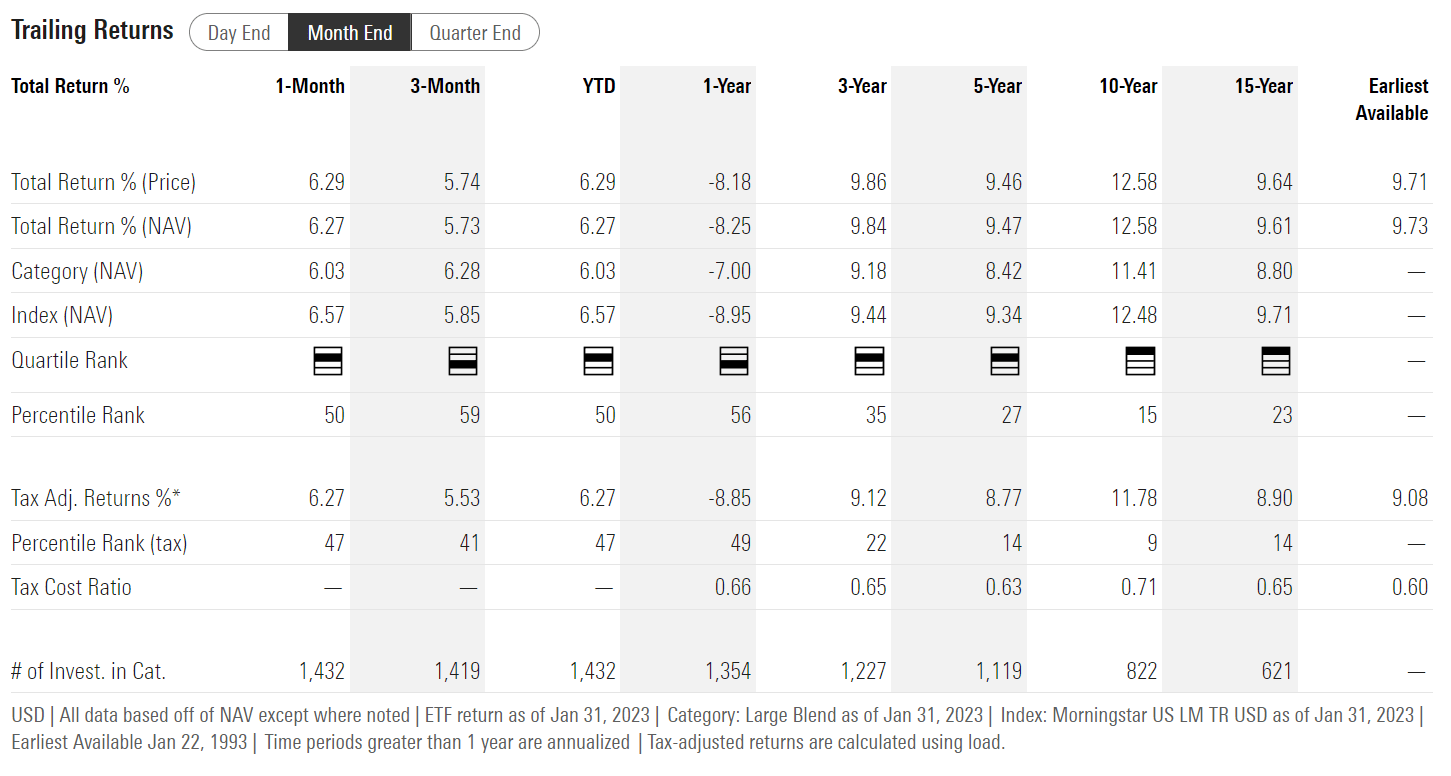
Distribution & Yield
RDIV pays a modest quarterly distribution, with trailing 12 month distribution of $1.50 or 3.4% distribution yield.
RDIV Vs. Peers
Figure 7 compares RDIV to ten other dividend-oriented ETFs that I track using a proprietary scorecard. First, with regards to fund structure, RDIV's 0.39% expense ratio is middle of the pack. RDIV also notably has the highest turnover ratio amongst peers by a mile.
Figure 7 - RDIV vs. peers (Author created with fund and distribution details from Seeking Alpha and returns and risk metrics from Morningstar)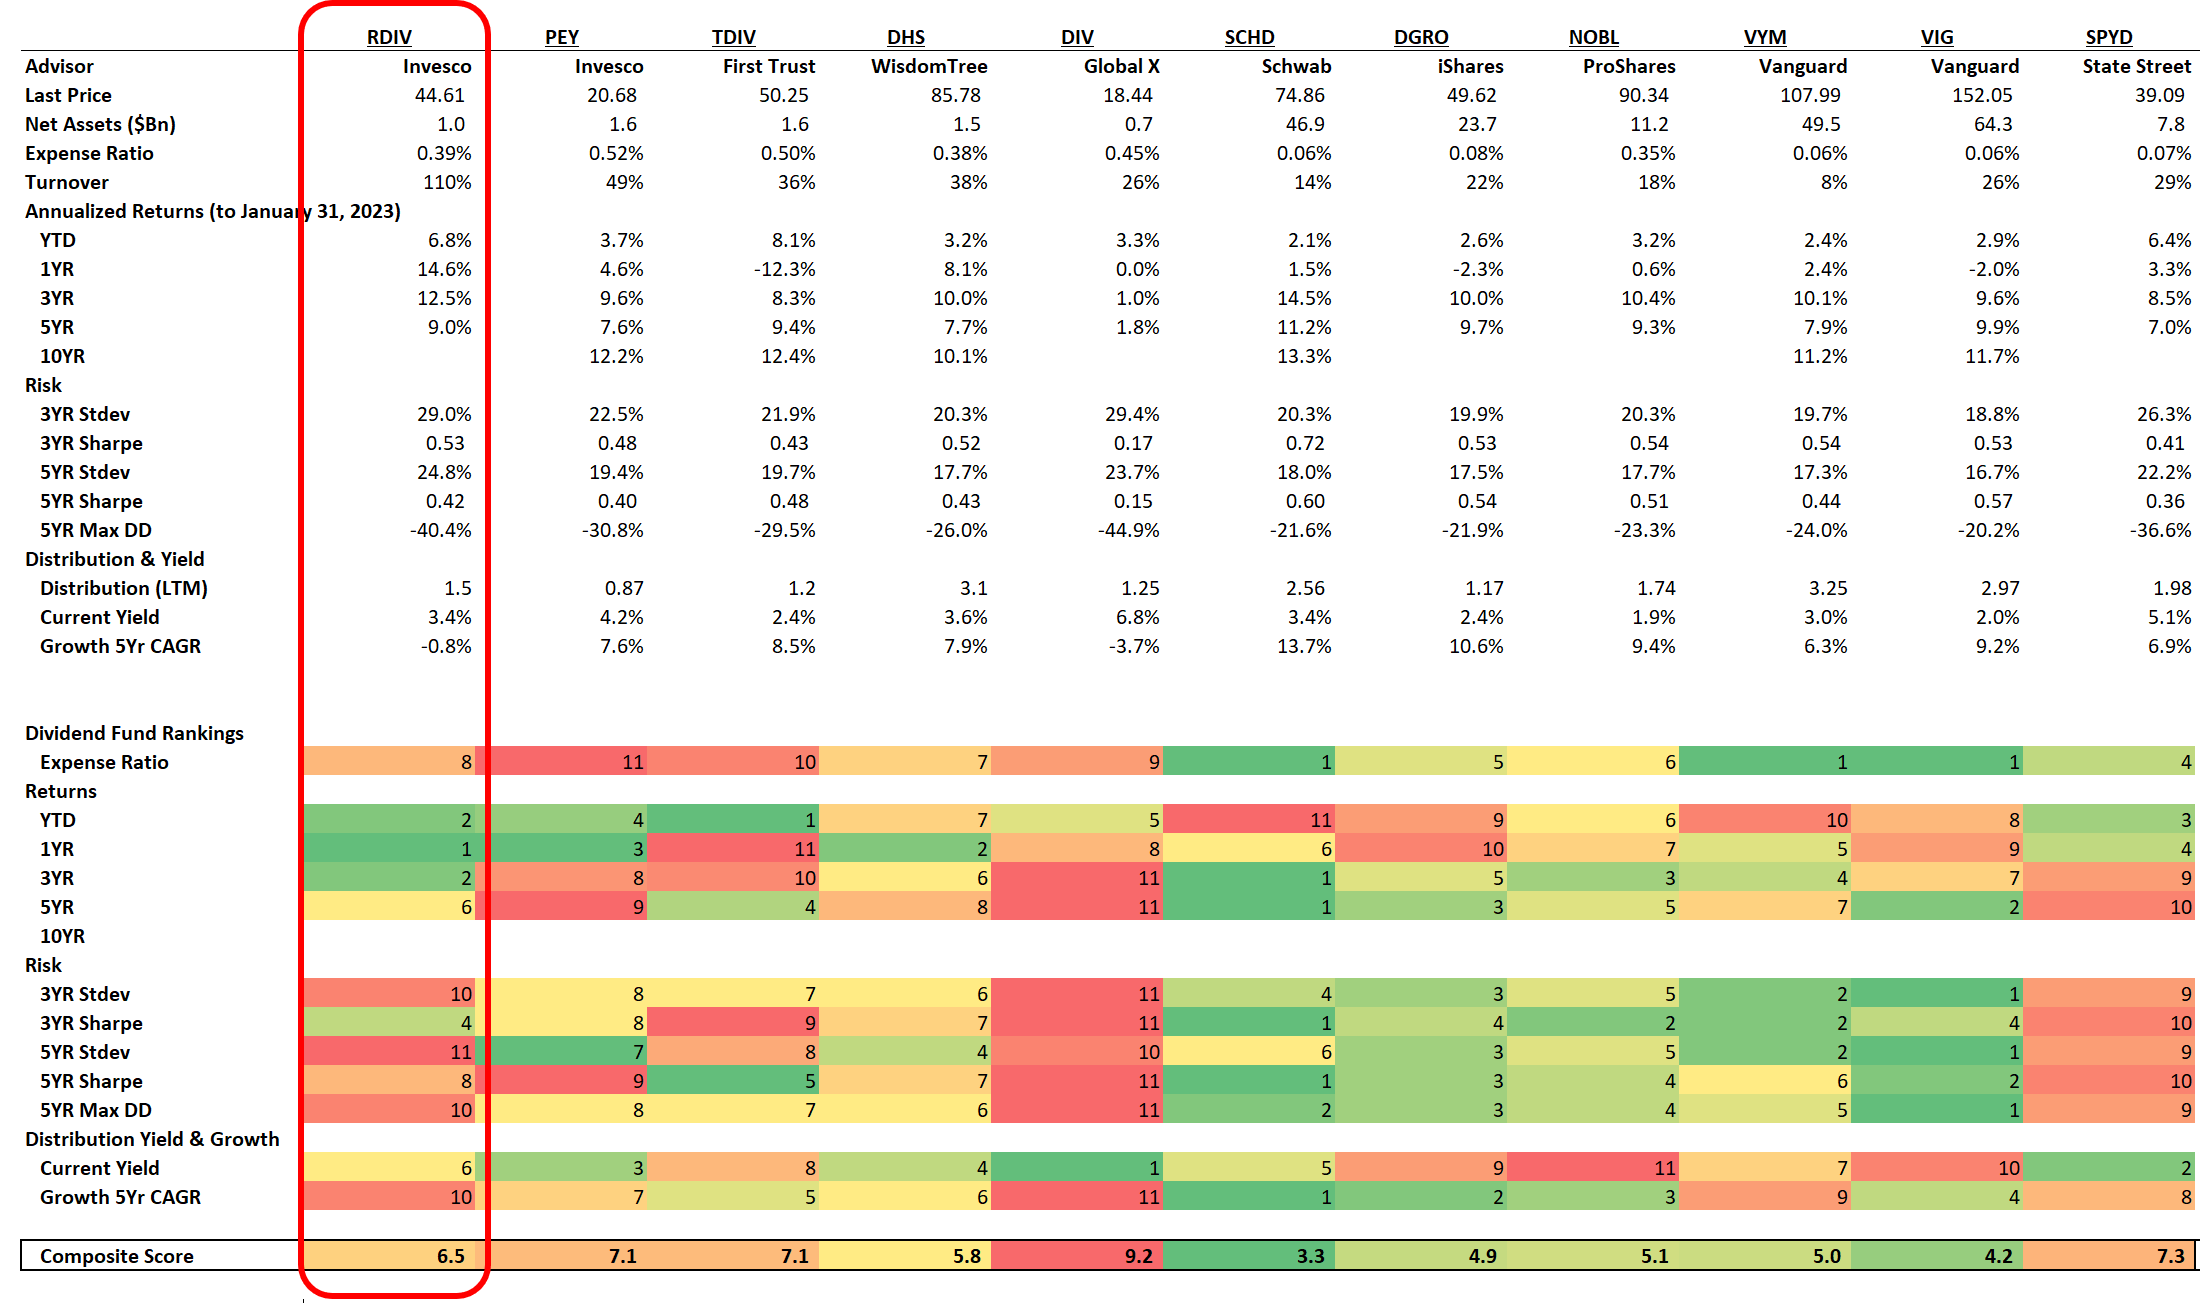
On returns, as noted above, RDIV has the highest return on a 1Yr basis and strong YTD and 3Yr returns. However, its 5Yr returns is middle of the pack.
RDIV performs poorly on risk, as it has one of the highest volatilities on both 3 and 5Yr basis. It also has one of the worst maximum drawdowns. However, its high returns do give the fund middle of the pack Sharpe Ratios.
Finally, with regards to its distribution, RDIV's current yield is mediocre and its distribution growth rate has been poor.
Overall, RDIV's composite score is middle of the pack. Although it has high short term returns, RDIV's high volatility is a major detriment. The RDIV ETF also does not outperform in terms of distribution yield or fund structure.
Conclusion
The Invesco S&P Ultra Dividend Revenue ETF gives investors exposure to high yielding companies in the S&P 900 Index. The ETF's selection methodology causes high turnover, as the whole index is reconstituted quarterly. This also causes the ETF to exhibit very high volatility; among the highest compared to its dividend-focused peers. RDIV had a strong 2022, returning 7.2%. However, longer-term returns for RDIV are more modest against its peers.
Although RDIV has strong short-term returns, its poor risk management and mediocre distribution yield makes me hesitant to recommend the fund.
This article was written by

Disclosure: I/we have a beneficial long position in the shares of SCHD either through stock ownership, options, or other derivatives. I wrote this article myself, and it expresses my own opinions. I am not receiving compensation for it (other than from Seeking Alpha). I have no business relationship with any company whose stock is mentioned in this article.