Morgan Stanley Vs. Goldman Sachs: Battle Of The Bulge Bracket Banks

Summary
- For the investment banking segment, Goldman Sachs edges out Morgan Stanley due to its superior fee and brokerage revenue growth as well as its higher market share.
- In the asset management segment, we believe Goldman Sachs edges out Morgan Stanley due to its superior asset management revenue growth and AUMs.
- In our financial analysis, we believe Morgan Stanley edges out Goldman Sachs due to its superior capital ratio and profitability compared to Goldman Sachs.
Darren415
This analysis compares Morgan Stanley (NYSE:MS) and The Goldman Sachs Group, Inc. (NYSE:GS), the two largest companies in the Capital Markets Industry, to determine their relative strengths. In this battle of bulge bracket banks, we evaluate their investment banking and asset management segments, as well as financial performance.
To compare the companies' investment banking segments, we analyze their investment banking fee revenue breakdown, including advisory, ECM, and DCM revenue, as well as trading and brokerage revenue. Our analysis includes a review of their 2022 performance and growth track record.
We also assess the companies' asset management performance, examining their revenue growth, assets under management ('AUM'), and market share in 2022 and over time.
In addition, we conduct a financial analysis to determine the superior company. This includes an examination of their capital, profitability, and efficiency ratios, as well as a comparison of their valuation ratios. We use a discounted cash flow ('DCF') analysis to value both companies.
Revenue ($ mln) | 2017 | 2018 | 2019 | 2020 | 2021 | 2022 | 10-year Average |
GS Total IB Revenue | 23,931 | 26,259 | 25,995 | 32,886 | 44,810 | 30,682 | |
Growth % | 5.0% | 9.7% | -1.0% | 26.5% | 36.3% | -31.5% | 3.5% |
GS Asset Management Revenue | 5,867 | 6,590 | 6,189 | 6,923 | 8,059 | 9,005 | |
Growth % | 8.5% | 12.3% | -6.1% | 11.9% | 16.4% | 11.7% | 6.4% |
MS Total IB Revenue | 21,180 | 22,223 | 21,356 | 26,508 | 29,325 | 24,465 | |
Growth % | 10.0% | 4.9% | -3.9% | 24.1% | 10.6% | -16.6% | 5.0% |
MS Asset Management Revenue | 11,797 | 12,898 | 13,083 | 14,272 | 19,967 | 19,578 | |
Growth % | 10.3% | 9.3% | 1.4% | 9.1% | 39.9% | -1.9% | 8.6% |
Source: Company Data, Khaveen Investments
Investment Banking Segments
Investment banking represents the largest revenue contributor to both Morgan Stanley and Goldman Sachs, accounting for 55% and 77% of total revenue respectively. To determine the superior company, we compared their investment banking fee revenue growth which consists of advisory, equity and debt underwriting revenue as well as trading, brokerage revenue and market share.
1. Investment Banking Fee Revenue Growth
Total Investment Banking Fee Revenue ($ mln) | 2017 | 2018 | 2019 | 2020 | 2021 | 2022 | 10-year Average |
GS Investment Banking Fees | 7,076 | 7,430 | 6,798 | 9,141 | 14,168 | 7,360 | |
Growth % | 12.8% | 5.0% | -8.5% | 34.5% | 55.0% | -48.1% | 6.3% |
MS Investment Banking Fees | 6,003 | 6,482 | 6,163 | 7,674 | 10,994 | 5,599 | |
Growth % | 21.7% | 8.0% | -4.9% | 24.5% | 43.3% | -49.1% | 4.9% |
Source: Company Data, Khaveen Investments
Firstly, we examined the investment banking fee revenue for Goldman Sachs and Morgan Stanley. Based on the table above, both Morgan Stanley and Goldman Sachs' investment banking fee revenue growth were fairly similar with large declines in 2022 compared to their average growth rate but Goldman Sachs has a higher average growth compared to Morgan Stanley.
Company Data, Khaveen Investments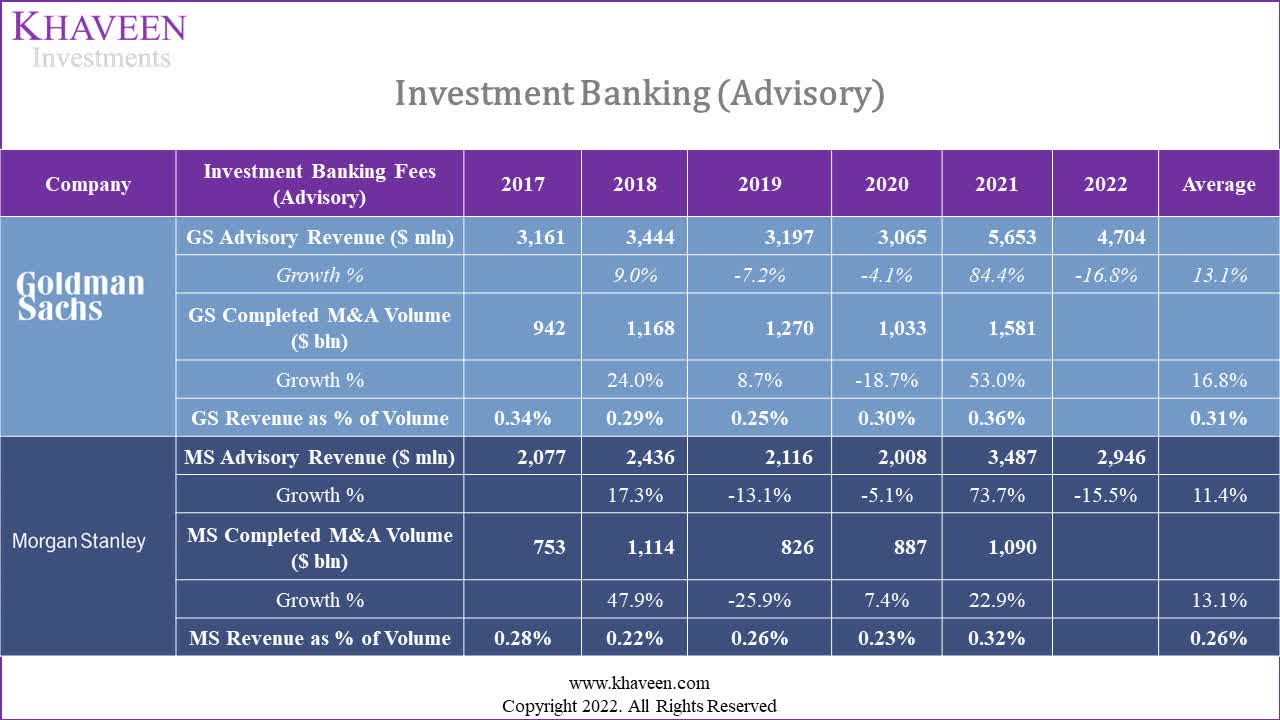
In terms of investment banking fee revenue, we compared both companies' revenue breakdowns. For its advisory segment, Goldman Sachs had a similar 5-year average revenue growth as Morgan Stanley and had a higher average completed volume growth than the company. Moreover, Goldman Sachs has a slightly higher revenue as a % of volume compared to Morgan Stanley.
In terms of 2022 growth, both companies have negative growth for the year as the global M&A value had declined by 35% in 2022 with lower volume in the top 5 sectors of technology, healthcare, finance, real estate and utilities and energy according to data from Dealogic. However, Goldman Sachs performed worse than Morgan Stanley in 2022 as its growth declined slightly more than Morgan Stanley.
Overall, we believe Goldman Sachs edges out Morgan Stanley with higher advisory revenue and volume growth track record despite its slight underperformance compared to Morgan Stanley in 2022.
Company Data, Khaveen Investments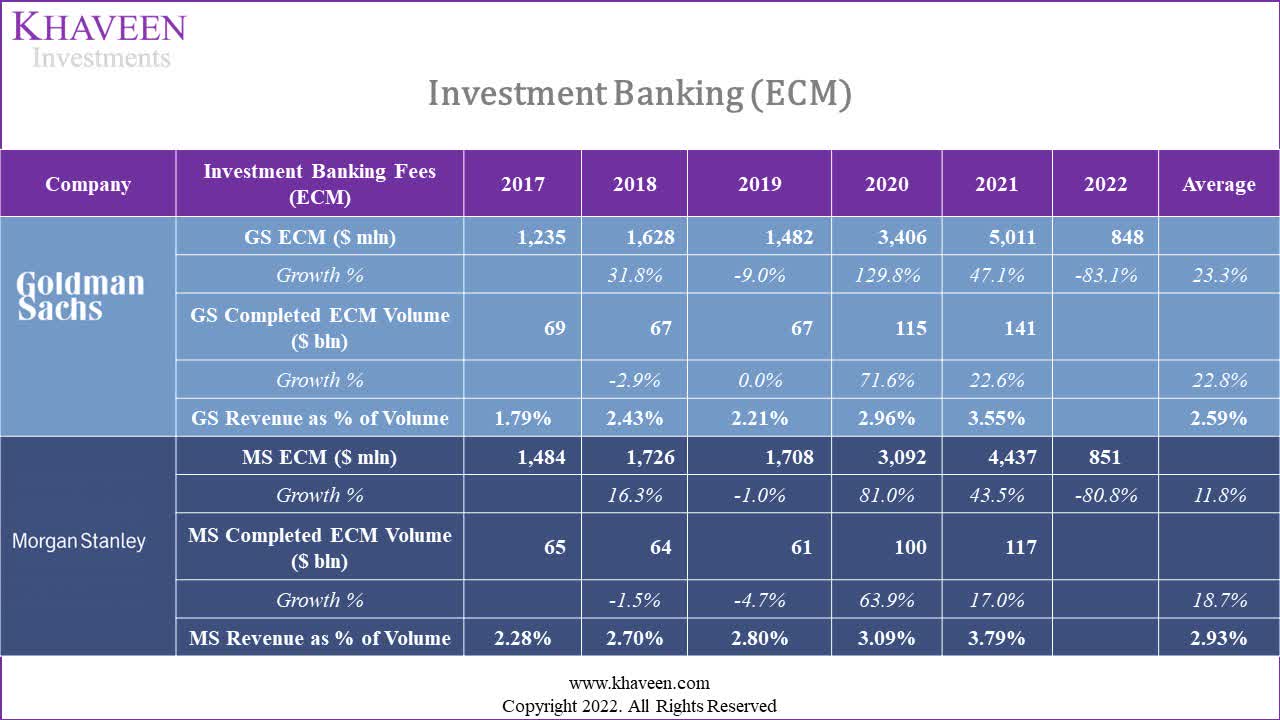
Furthermore, in the equity underwriting segment, both companies have strong average revenue growth but Goldman Sachs has a higher average than Morgan Stanley. Also, Goldman Sachs has a higher average volume growth than the company. Though, Morgan Stanley has a higher revenue as a % of volume compared to Goldman Sachs.
In 2022, both companies' revenues declined significantly by over 80%. This is as the global ECM deal value had declined by 65% in 2022 based on Dealogic with the US having the largest decline among the geographic regions at 81%. Thus, as both Morgan Stanley and Goldman Sachs are based in the US, we believe its substantial decline in revenue is reflected by the large decline of the US market.
That said, we believe Goldman Sachs edges out Morgan Stanley with a stronger revenue growth track record despite performing slightly worse than Morgan Stanley in 2022.
Company Data, Khaveen Investments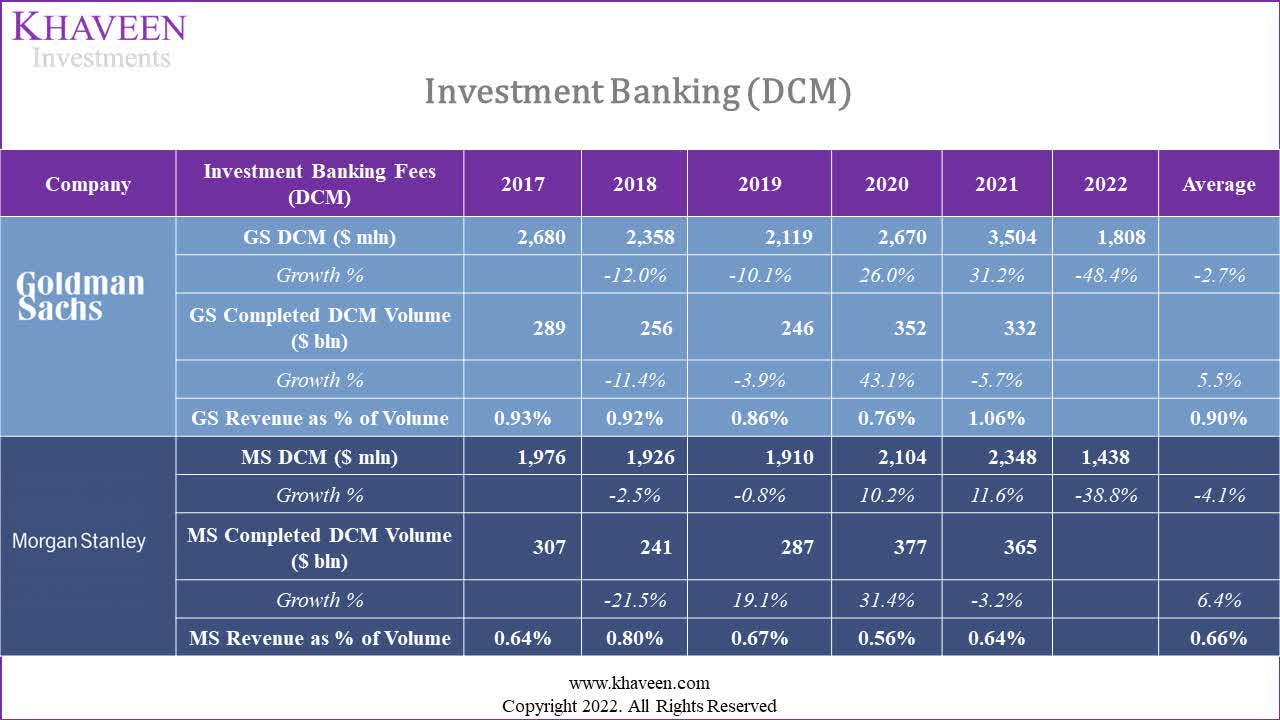
Moreover, in DCM, Goldman Sachs has a higher average revenue growth compared to Morgan Stanley despite slightly lower average volume growth. Also, Goldman Sachs has higher revenue as a % of revenue compared to Morgan Stanley. In 2022, both companies performed negatively with large declines in revenues. This is as the DCM global deal value had decreased by 27% with the US declining at a higher rate of 35%. Thus, as both companies are based in the US, we believe their poor performance in 2022 is reflective of the US market decline. Overall, we believe Morgan Stanley edges out Goldman Sachs with its better performance in 2022 compared to Goldman Sachs as well as a higher volume growth track record and superior revenue as % of volume.
All in all, for the Investment Banking Fee section, we believe Goldman Sachs has the advantage over Morgan Stanley with its superior performance and revenue growth track record. Additionally, we believe that Goldman Sachs is superior to Morgan Stanley in advisory and ECM while Morgan Stanley edges out it in DCM as explained above.
2. Trading Revenue
Investment Banking Revenue | 2017 | 2018 | 2019 | 2020 | 2021 | 2022 | 10-year Average |
GS Trading Revenue | 13,804 | 15,630 | 16,209 | 20,197 | 27,023 | 19,288 | |
Growth % | 3.7% | 13.2% | 3.7% | 24.6% | 33.8% | -28.6% | 3.4% |
MS Trading | 11,116 | 11,551 | 11,274 | 13,983 | 12,810 | 13,928 | |
Growth % | 8.9% | 3.9% | -2.4% | 24.0% | -8.4% | 8.7% | 7.8% |
Source: Company Data, Khaveen Investments
In terms of trading revenue, Goldman Sachs's trading revenue declined substantially while Morgan Stanley's trading revenue had positive growth which was driven by its Q1 2022 equity revenue (52% of trading revenue) which grew by 10%. Overall, we believe Morgan Stanley edges out Goldman Sachs in terms of trading revenue growth due to its superior performance in 2022 and growth track record.
3. Brokerage Revenue
Investment Banking Revenue | 2017 | 2018 | 2019 | 2020 | 2021 | 2022 | 10-year Average |
GS Brokerage | 3,051 | 3,199 | 2,988 | 3,548 | 3,619 | 4,034 | |
Growth % | -4.9% | 4.9% | -6.6% | 18.7% | 2.0% | 11.5% | 2.7% |
MS Brokerage | 4,061 | 4,190 | 3,919 | 4,851 | 5,521 | 4,938 | |
Growth % | -1% | 3% | -6% | 24% | 14% | -11% | 2.0% |
Source: Company Data, Khaveen Investments
Whereas for brokerage revenue, both companies also have had a fairly similar growth track record with low single-digit growth. However, in 2022, Goldman Sachs had positive growth while Morgan Stanley's revenue declined. This is following Goldman Sachs' expansion in China in 2022 as it took full ownership of JV of its securities business in China. Overall, we believe Goldman Sachs edges out Morgan Stanley due to its superior performance in 2022.
4. Market Share
Company Data, Khaveen Investments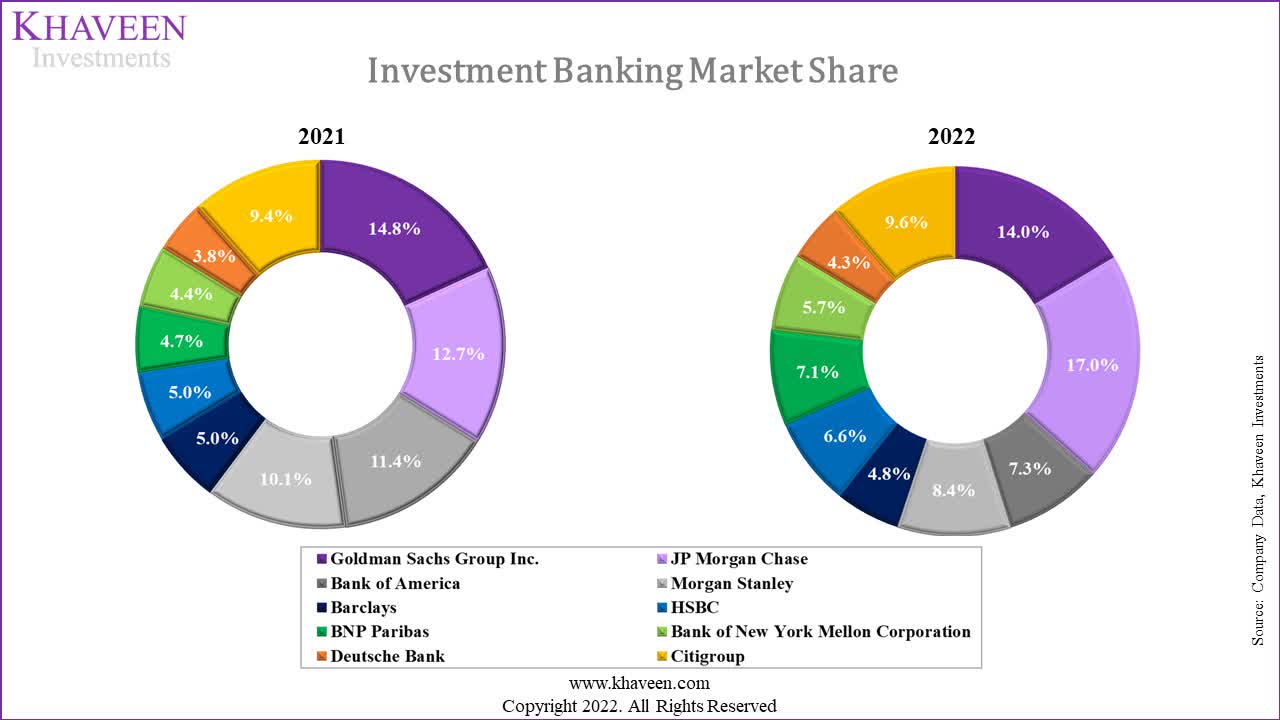
In terms of investment banking market share, Goldman Sachs has a higher market share compared to Morgan Stanley. However, both companies have lost market share in 2022. Goldman Sachs was overtaken by JPMorgan (JPM) which gained a share to become the market leader in 2022. This is despite JPMorgan's investment banking fee revenue also performing negatively in 2022 as it declined by 48%. Though, its trading revenue performed resiliently as it grew by 5.8% in 2022.
Overall, we believe that while both companies lost market share in 2022, Goldman Sachs is superior to Morgan Stanley with a higher share and is ranked second in the market.
Overall
Factor | Winner |
Investment Banking Fee Revenue | Goldman Sachs |
Trading Revenue | Morgan Stanley |
Brokerage Revenue | Goldman Sachs |
Market Share | Goldman Sachs |
Overall | Goldman Sachs |
Source: Company Data, Khaveen Investments
All in all, for the investment banking segment, we believe Goldman Sachs edges out Morgan Stanley overall due to its superior investment banking fee and brokerage revenue growth as well as its superior market position with a higher share than Morgan Stanley.
Asset Management Segment
Besides investment banking, both Goldman Sachs and Morgan Stanley have asset management businesses, accounting for 13.7% and 33% of total revenue respectively. To determine the superior company, we compared their total asset management revenue growth, AUM and market share.
1. Asset Management Revenue Growth
Asset Management Revenue | 2017 | 2018 | 2019 | 2020 | 2021 | 2022 | Average |
GS Asset Management | 5,867 | 6,590 | 6,189 | 6,923 | 8,059 | 9,005 | 6,347 |
Growth % | 8.5% | 12.3% | -6.1% | 11.9% | 16.4% | 11.7% | 6.4% |
MS Asset Management | 11,797 | 12,898 | 13,083 | 14,272 | 19,967 | 19,578 | 12,934 |
Growth % | 10.3% | 9.3% | 1.4% | 9.1% | 39.9% | -1.9% | 8.6% |
Source: Company Data, Khaveen Investments
Based on the table of both Goldman Sachs and Morgan Stanley's asset management revenue, Morgan Stanley has a slightly higher average revenue growth compared to Goldman Sachs with a surge in growth in 2021 following its acquisition of Eaton Vance. However, Goldman Sachs's performance in 2022 was superior to Morgan Stanley's as its revenue grew by double digits while Morgan Stanley had flattish growth. Thus, we believe Goldman Sachs edges Morgan Stanley with its superior performance despite a slightly lower average growth.
2. AUM
Asset Management ($ bln) | 2017 | 2018 | 2019 | 2020 | 2021 | 2022 | Average |
GS AUM | 1,494 | 1,542 | 1,859 | 2,145 | 2,470 | 2,547 | |
Growth % | 3.2% | 20.6% | 15.4% | 15.2% | 3.1% | 11.5% | |
MS AUM | 482 | 463 | 552 | 781 | 1,565 | 1,305 | |
Growth % | -3.9% | 19.2% | 41.5% | 100.4% | -16.6% | 28.1% |
Source: Company Data, Khaveen Investments
In terms of asset management AUM, Morgan Stanley has a higher average growth almost triple that of Goldman Sachs as the company's AUM surged in 2021 following its acquisition of Eaton Vance 2021 which had an AUM of $500 bln. However, Morgan Stanley's AUM declined by double digits in 2022 compared to Goldman Sachs which had positive growth. Also, Goldman Sachs has a higher AUM than Morgan Stanley. Thus, we believe Goldman Sachs edges out Morgan Stanley in terms of AUM as it had positive growth in 2022.
3. Market Share
Company Data, Khaveen Investments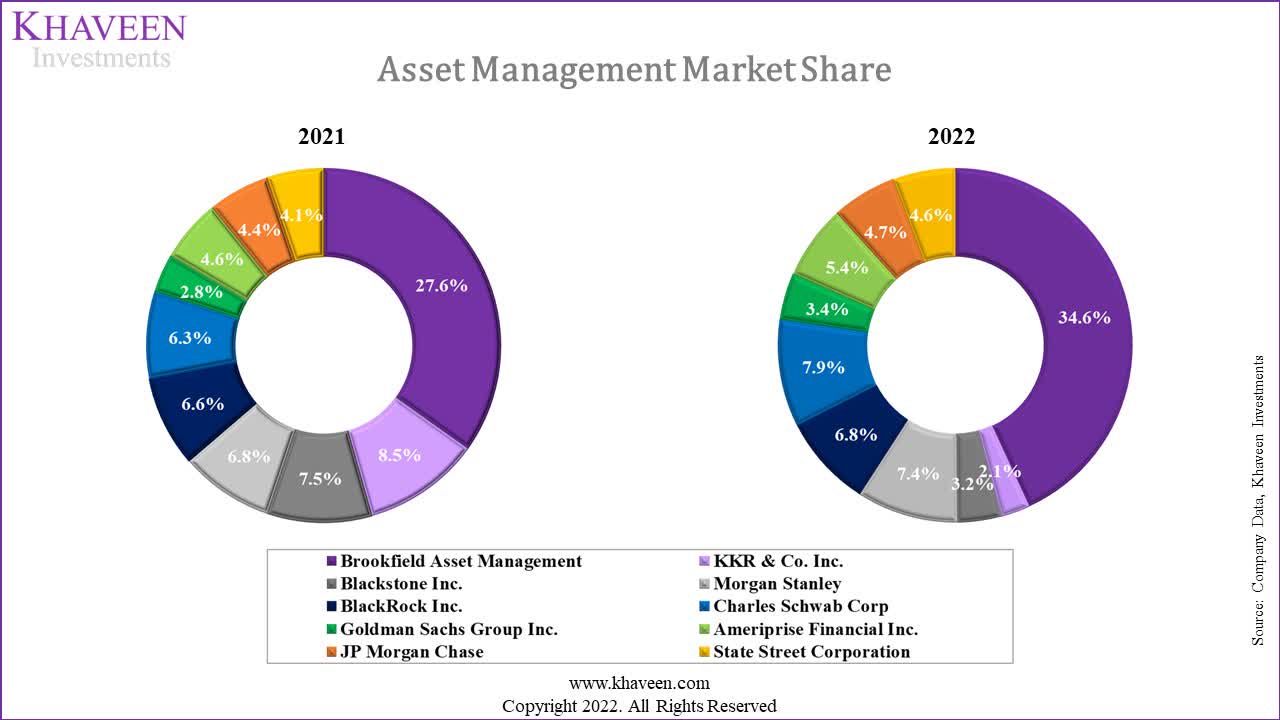
In terms of market share for asset management, Morgan Stanley has a higher share compared to Goldman Sachs. Both companies' market share increased in 2022 compared to 2021. However, we believe Morgan Stanley edges out Goldman Sachs with a higher market share than the company.
Overall
Factor | Winner |
Asset Management Revenue Growth | Goldman Sachs |
AUM | Goldman Sachs |
Market Share | Morgan Stanley |
Overall | Goldman Sachs |
Source: Company Data, Khaveen Investments
For the asset management segment, we believe Goldman Sachs edges out Morgan Stanley overall due to its superior asset management revenue growth in 2022 and larger AUMs despite its smaller market share than Morgan Stanley.
Financial Analysis
Finally, we compared Goldman Sachs and Morgan Stanley based on financial and valuation ratios to determine the better company based on capital ratio, profitability, efficiency, and valuation ratios.
1. Capital Ratio
Company | CET1 Capital Ratio (2022) |
JPMorgan Chase & Co. | 13.2% |
The Goldman Sachs Group, Inc. | 9.2% |
Morgan Stanley | 15.3% |
Bank of America Corporation (BAC) | 12.1% |
Citigroup Inc. (C) | 13.0% |
UBS Group AG (UBS) | 14.2% |
Credit Suisse Group Ltd (CS) | 14.1% |
Deutsche Bank AG (DB) | 13.4% |
Barclays PLC (BCS) | 13.9% |
Average | 13.2% |
Source: Company Data, Khaveen Investments
In terms of the capital ratio, Morgan Stanley has the highest CET1 capital ratio in the table above among competitors. In comparison, Goldman Sachs' capital ratio is below the average of its competitors. Thus, we believe Morgan Stanley edges out Goldman Sachs in terms of the capital ratio.
2. Profitability
Company | 5Y Net Income CAGR | ROA | ROE | ROTCE |
JPMorgan Chase & Co. | 9.0% | 0.9% | 12.5% | 15.3% |
The Goldman Sachs Group, Inc. | 21.3% | 0.7% | 9.2% | 11.6% |
Morgan Stanley | 12.5% | 0.9% | 10.4% | 15.2% |
Bank of America Corporation | 8.6% | 0.8% | 9.6% | 13.0% |
Citigroup Inc. | -4.8%** | 0.7% | 7.8% | 7.2% |
UBS Group AG | 51.1% | 0.7% | 12.4% | 14.1% |
Credit Suisse Group Ltd | N/A | -0.2% | -3.8% | -19.1% |
Deutsche Bank AG | 216.7%* | 0.2% | 4.3% | 5.2% |
Barclays PLC | 24.4%** | 0.3% | 7.3% | 9.4% |
Average | 42.4% | 0.6% | 7.7% | 8.0% |
*2-year
**4-year
Source: Company Data, Khaveen Investments
In terms of profitability, we compared the companies by 5-year net income CAGR, ROA, ROE and ROTCE. Based on the table, Morgan Stanley has a higher ratio for all profitability metrics compared except for a lower 5-year net income CAGR. Thus, we believe Morgan Stanley edges out Goldman Sachs.
3. Bank Efficiency Ratios
Company | Asset Turnover | Expense efficiency ratios | Revenue Per Employee |
JPMorgan Chase & Co. | 0.033 | 62.0% | 416,399 |
The Goldman Sachs Group, Inc | 0.031 | 68.5% | 909,369 |
Morgan Stanley | 0.045 | 66.8% | 651,073 |
Bank of America Corporation | 0.030 | 66.5% | 425,839 |
Citigroup Inc. | 0.030 | 73.3% | 296,471 |
UBS Group AG | 0.031 | 72.2% | 479,579 |
Credit Suisse Group Ltd | 0.023 | 118.1% | 311,920 |
Deutsche Bank AG | 0.019 | 78.2% | 329,060 |
Barclays PLC | 0.016 | 63.5% | 328,295 |
Average | 0.029 | 74.4% | 416,399 |
Source: Company Data, Khaveen Investments
In terms of efficiency, we compared the asset turnover and expense efficiency ratios. Based on the table, Morgan Stanley has a higher asset turnover ratio but a lower expense efficiency percentage than Goldman Sachs. Also, Goldman Sachs has a higher revenue per employee than Morgan Stanley. Thus, we believe Goldman Sachs edges out Morgan Stanley in terms of its efficiency ratio comparison.
Overall
Factor | Winner |
Capital Ratio | Morgan Stanley |
Profitability Ratios | Morgan Stanley |
Efficiency Ratios | Goldman Sachs |
Overall | Morgan Stanley |
Source: Khaveen Investments
Based on our ratio comparison, we believe Morgan Stanley edges out Goldman Sachs overall due to its superior capital ratio and profitability compared to Goldman Sachs.
Valuation
1. Valuation Ratios
Company | P/E | P/S | P/B | EV/S | EV/B | EV/E | PEG |
JPMorgan Chase & Co. | 11.66 | 3.22 | 1.42 | 3.03 | 1.34 | 10.96 | 1.17 |
The Goldman Sachs Group, Inc. | 12.1 | 2.59 | 1.05 | 11.3 | 4.56 | 52.56 | 1.25 |
Morgan Stanley | 15.89 | 3.05 | 1.63 | 5.25 | 2.81 | 27.36 | 49.29 |
Bank of America Corporation | 10.72 | 2.88 | 1 | 2.81 | 0.98 | 10.46 | 87.48 |
Citigroup Inc. | 6.85 | 1.29 | 0.49 | 4.01 | 1.52 | 21.25 | 0.72 |
UBS Group AG | 9.52 | 1.7 | 1 | 4.63 | 2.54 | 24.15 | 1.72 |
Credit Suisse Group Ltd | N/A | 0.47 | 0.24 | 2.92 | 1.57 | N/A | 2.89 |
Deutsche Bank AG | 7.25 | 0.86 | 0.37 | N/A | -0.66 | -12.87 | 0.12 |
Barclays PLC | 5.76 | 1.09 | 0.4 | 18.91 | 6.99 | 100.67 | 0.23 |
Average | 9.97 | 1.91 | 0.84 | 4.85 | 2.19 | 24.46 | 16.10 |
Source: Company Data, Khaveen Investments
For the valuation ratio comparison, we compared the company's P/E, P/S, P/B, EV/S, EV/B, EV/E, PEG and P/FCF ratios. As seen from the table, Goldman Sachs has a lower P/E, P/S, and P/B ratio compared to Morgan Stanley. However, Morgan Stanley has a lower EV/S, EV/B and EV/E ratio than Goldman Sachs. Additionally, Goldman Sachs has a lower PEG ratio than Morgan Stanley. Thus, we believe Goldman Sachs edges out Morgan Stanley.
2. DCF Analysis
Morgan Stanley
We updated our revenue forecasts for the company based on its 10-year average growth rate for its investment banking, trading, brokerage, asset management and other segments and net interest income.
Morgan Stanley Revenue Forecast ($ mln) | 2020 | 2021 | 2022 | 2023F | 2024F | 2025F | 2026F | 2027F |
Investment Banking | 7,674 | 10,994 | 5,599 | 5,875 | 6,165 | 6,469 | 6,788 | 7,123 |
Growth % | 24.5% | 43.3% | -49.1% | 4.9% | 4.9% | 4.9% | 4.9% | 4.9% |
Trading | 13,983 | 12,810 | 13,928 | 15,010 | 16,175 | 17,431 | 18,784 | 20,243 |
Growth % | 24.0% | -8.4% | 8.7% | 7.8% | 7.8% | 7.8% | 7.8% | 7.8% |
Commission and Fees | 4,851 | 5,521 | 4,938 | 5,037 | 5,138 | 5,242 | 5,347 | 5,454 |
Growth % | 23.8% | 13.8% | -10.6% | 2.0% | 2.0% | 2.0% | 2.0% | 2.0% |
Asset Management | 14,272 | 19,967 | 19,578 | 21,261 | 23,089 | 25,074 | 27,230 | 29,571 |
Growth % | 9.1% | 39.9% | -1.9% | 8.6% | 8.6% | 8.6% | 8.6% | 8.6% |
Other | 678 | 1,042 | 283 | 291 | 298 | 306 | 314 | 323 |
Growth % | -21.6% | 53.7% | -72.8% | 2.7% | 2.7% | 2.7% | 2.7% | 2.7% |
Total Non-Interest Revenue | 41,458 | 50,334 | 44,326 | 47,474 | 50,866 | 54,522 | 58,463 | 62,713 |
Growth % | 17.4% | 21.4% | -11.9% | 7.1% | 7.1% | 7.2% | 7.2% | 7.3% |
MS Net Interest Income | 7,299 | 9,421 | 9,342 | 10,547 | 11,908 | 13,445 | 15,180 | 17,139 |
Growth % | 17.1% | 29.1% | -0.8% | 12.9% | 12.9% | 12.9% | 12.9% | 12.9% |
Total MS Revenue | 48,757 | 59,755 | 53,668 | 58,021 | 62,774 | 67,967 | 73,643 | 79,852 |
Growth % | 17.4% | 22.6% | -10.2% | 8.1% | 8.2% | 8.3% | 8.4% | 8.4% |
Source: Company Data, Khaveen Investments
Based on a discount rate of 7%, our modified DCF model shows its shares are undervalued by 26.6%.
Khaveen Investments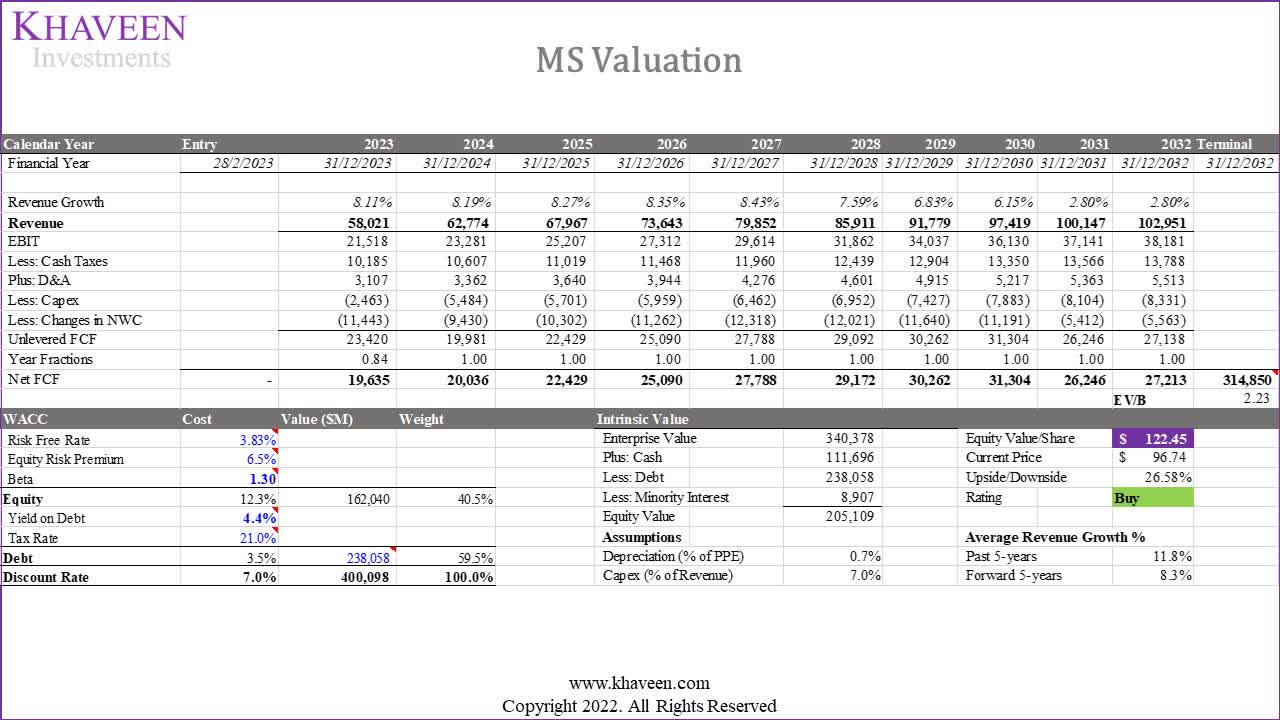
Goldman Sachs
Moreover, we updated our revenue forecasts for Goldman Sachs based on its 10-year average growth rate for its investment banking, brokerage, investment management and trading segments and net interest income.
Goldman Sachs Revenues Forecast ($ mln) | 2022 | 2023F | 2024F | 2025F | 2026F | 2027F |
Investment Banking | 7,360 | 7,933 | 8,551 | 9,216 | 9,934 | 10,708 |
Growth % | -48.1% | 7.8% | 7.8% | 7.8% | 7.8% | 7.8% |
Investment Management | 9,005 | 9,583 | 10,198 | 10,853 | 11,550 | 12,291 |
Growth % | 11.7% | 6.4% | 6.4% | 6.4% | 6.4% | 6.4% |
Commissions and Fees | 4,034 | 4,144 | 4,256 | 4,372 | 4,491 | 4,613 |
Growth % | 11.5% | 2.7% | 2.7% | 2.7% | 2.7% | 2.7% |
Market Making and Other Principle Transactions | 19,288 | 19,783 | 20,290 | 20,810 | 21,344 | 21,891 |
Growth % | -28.6% | 2.6% | 2.6% | 2.6% | 2.6% | 2.6% |
Goldman Sachs Total Non-Interest Revenue | 39,687 | 41,442 | 43,295 | 45,251 | 47,318 | 49,502 |
Growth % | -24.9% | 4.4% | 4.5% | 4.5% | 4.6% | 4.6% |
GS Net Interest Income | 7,678 | 8,538 | 9,495 | 10,559 | 11,742 | 13,057 |
Growth % | 18.7% | 11.2% | 11.2% | 11.2% | 11.2% | 11.2% |
Total GS Revenue | 47,365 | 49,981 | 52,790 | 55,810 | 59,060 | 62,559 |
Growth % | -20.2% | 5.5% | 5.6% | 5.7% | 5.8% | 5.9% |
Source: Company Data, Khaveen Investments
Based on a discount rate of 6%, our model shows its shares are undervalued by 28.8%.
Khaveen Investments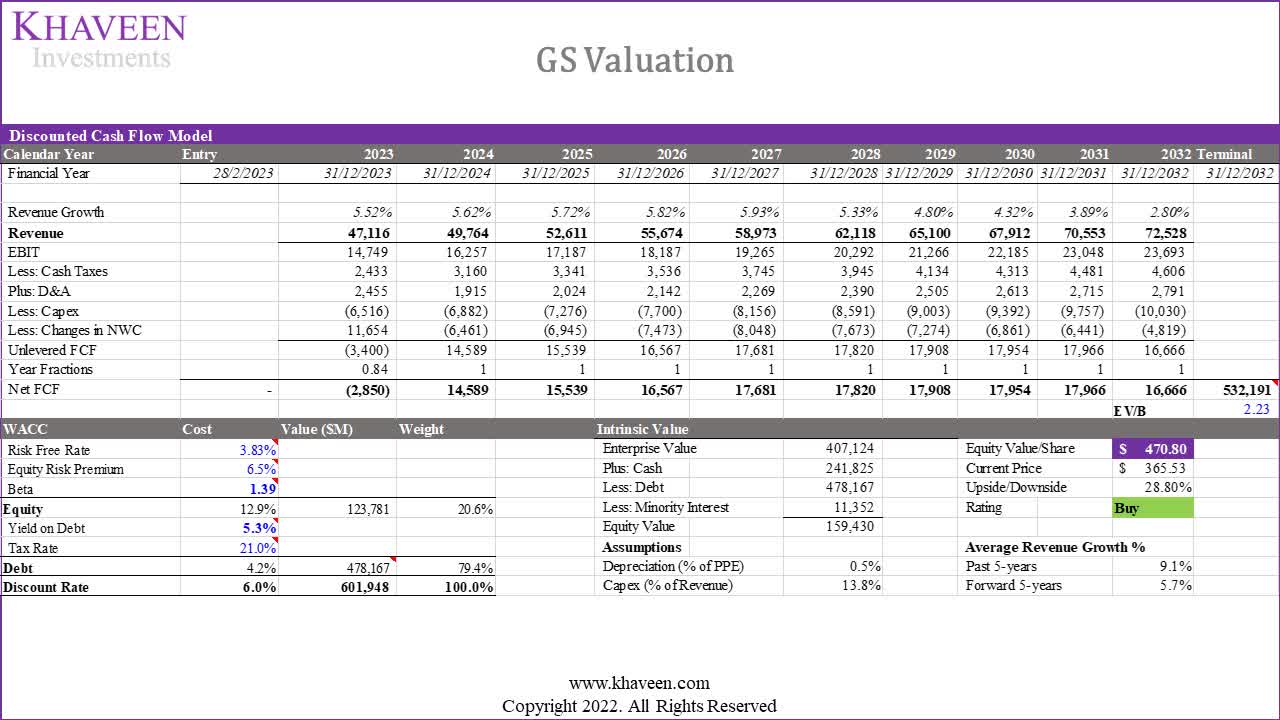
Overall, we believe Goldman Sachs edges out Morgan Stanley in terms of the valuation ratio comparison. However, based on our DCF analysis, we believe Goldman Sachs edges out Morgan Stanley with a slightly higher upside.
Overall
Factor | Winner |
Comparable Company Analysis | Goldman Sachs |
DCF | Goldman Sachs |
Overall | Goldman Sachs |
Source: Khaveen Investments
Risk: JPMorgan's Dominance
We believe one of the risks facing both Goldman Sachs and Morgan Stanley is the intense competition from JPMorgan. This is as JPMorgan has overtaken Goldman Sachs as the market leader in investment banking in 2022 with its resilient trading revenue growth of 5.6%. JPMorgan's total IB revenue growth was 3.5% compared to GS (-31.5%) and MS (-17%). Moreover, the company also gained market share in asset management and is ranked 5th despite its revenue decreased by 4.3% compared to GS (11.7%) and MS (-1.9%). This analysis is centered around the competition between Goldman Sachs and Morgan Stanley, but we have not looked extensively into JPMorgan's position relative to these two companies, which looks to be more promising.
Verdict
In conclusion, after analyzing both companies, we have determined that Goldman Sachs outperforms Morgan Stanley in the investment banking segment due to its higher investment banking fee and brokerage revenue growth, as well as its larger market share. Furthermore, in the asset management segment, Goldman Sachs also outperforms Morgan Stanley with its higher revenue growth and larger assets under management.
However, in our ratio comparison, Morgan Stanley demonstrates superior capital ratios and profitability compared to Goldman Sachs, which gives Morgan Stanley an overall edge based on financial analysis.
Taking all factors into consideration, our analysis indicates that Goldman Sachs is the superior company overall, as it outperforms Morgan Stanley in investment banking, asset management, and valuation, despite Morgan Stanley's better position in financial analysis.
Factor | Winner |
Investment Banking | Goldman Sachs |
Asset Management | Goldman Sachs |
Financial Analysis | Morgan Stanley |
Valuation | Goldman Sachs |
Overall | Goldman Sachs |
Source: Khaveen Investments
However, we note similar positive prospects for both companies. Based on our valuation, we rate Morgan Stanley as a Buy (upside of 26.58%) and Goldman Sachs also a Buy (upside of 28.8%).
Company | Price Target | Upside | Rating |
Morgan Stanley | $122.45 | 26.6% | Buy |
Goldman Sachs | $470.80 | 28.8% | Buy |
Source: Khaveen Investments
This article was written by

Disclosure: I/we have no stock, option or similar derivative position in any of the companies mentioned, but may initiate a beneficial Long position through a purchase of the stock, or the purchase of call options or similar derivatives in GS, MS over the next 72 hours. I wrote this article myself, and it expresses my own opinions. I am not receiving compensation for it (other than from Seeking Alpha). I have no business relationship with any company whose stock is mentioned in this article.
Additional disclosure: No information in this publication is intended as investment, tax, accounting, or legal advice, or as an offer/solicitation to sell or buy. Material provided in this publication is for educational purposes only, and was prepared from sources and data believed to be reliable, but we do not guarantee its accuracy or completeness.