TAN: Solar Stocks Good On Valuation, Weak On Technicals

Summary
- Solar equities performed generally well during 2022's turmoil.
- Recent price action has been lackluster as the fund consolidates off its 2021 peak.
- I see downside technical risks ahead for a handful of reasons, but the long-term value case is compelling.

ArtistGNDphotography
Solar stocks haven’t made many headlines lately after busy times in 2021 and 2022. Recall how the blue wave after the 2020 election was supposed to be a major tailwind for renewable energy stocks. Then last year’s Inflation reduction Act was another bullish piece of legislation. Price action has not cooperated recently, though. I see downside price risks ahead for the TAN Solar ETF based on the charts, but there’s also long-term value based on a few valuation multiples.
According to the issuer, the Invesco Solar ETF (NYSEARCA:TAN) is based on the MAC Global Solar Energy Index. The fund will invest at least 90% of its total assets in the securities, American depositary receipts (ADRs), and global depositary receipts (GDRs) that comprise the Index. The index is comprised of companies in the solar energy industry. The fund is rebalanced quarterly.
TAN is a popular way to play price trends and clean energy themes. The annual expense ratio is somewhat high at 0.69% and the dividend yield amounts to about 1% per year, though both the fund website and Seeking Alpha show a goose-egg yield. Tradeability and liquidity are high with TAN – the median 30-day bid/ask spread is just 8 basis points and the fund has a high AUM of $2.3 billion as of February 24. Average daily volume is slightly under 1 million while the weighted average market cap of TAN’s 52 positions is just shy of $9 billion.
Digging into the portfolio’s valuation, Morningstar notes that the price-to-earnings ratio is not far from the market’s multiple in the mid-teens while TAN trades at 2.1 times book value. The price-to-sales ratio is actually only about half that of the S&P 500’s at 2.1x. Trading just 2.4x sales, near the SPX’s 2.3 multiple. Considering the long-term earnings growth rate is near 20% on TAN with also-impressive sales advances, its valuation is attractive to me here.
A risk for solar stocks is a further rise in interest rates. Notice in the view below from Morningstar that it’s a high-growth fund with little in the way of yield, so the duration is very high on this mid-cap growth ETF.
TAN: Portfolio & Factor Profiles
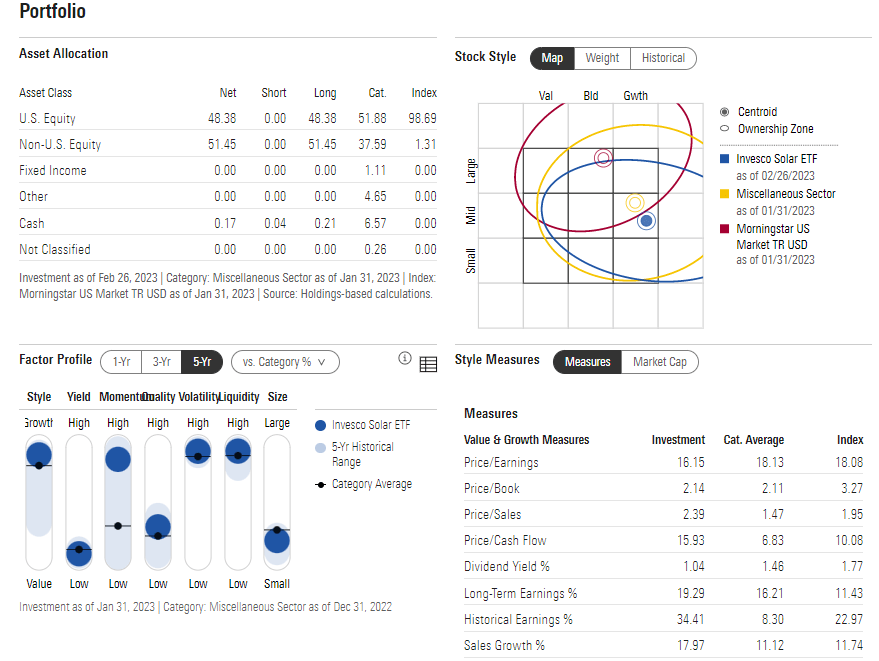
Morningstar
Digging deeper into the TAN portfolio, it is heavy in the Information Technology sector, but it also trades like a substitute for traditional oil & gas energy names. The portfolio houses a large overweight to the small Utilities sector as well. Industrials with ample investments in renewable solar energy is another material sector weight.
TAN is also a multinational fund, so keeping close tabs on movements in the US Dollar Index is critical. Moreover, goings-on in China will play a crucial role in a handful of the ETF’s largest holdings.
TAN Portfolio: Sector Allocation & Country Breakdown
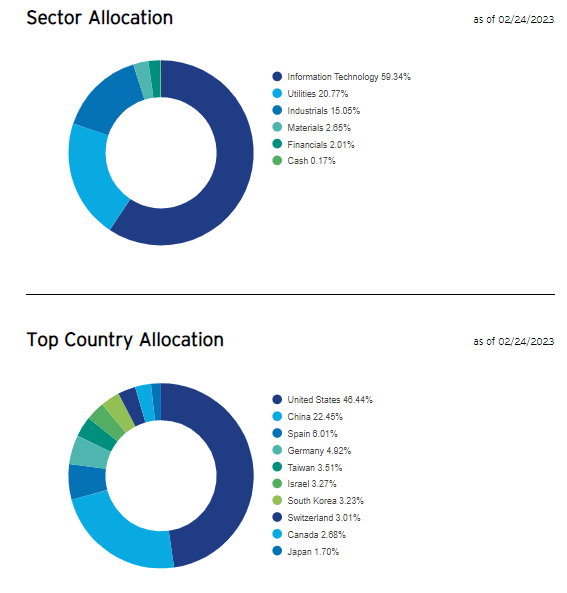
Invesco
With 57% of total assets within the top 10 positions, some due diligence is required on First Solar (FSLR), SolarEdge (SEDG), and Enphase Energy (ENPH).
Top Holdings
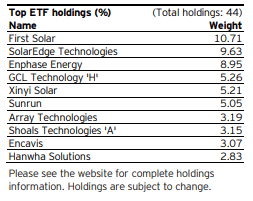
Invesco
The Technical Take
TAN has been frustrating the bulls and bears alike. Notice in the chart below that shares have been in consolidation mode arguably since early 2021. That more than 2-year span has seen the ETF range from $125 down to $55. Bullish news around the Inflation Reduction Act this past summer boosted TAN temporarily, but here we are back in the low $70s. I see risk of downside should the fund fall below $70 – in which case a quick move to the low to mid-$60s could be in play.
Also take a look at the breakdown already apparent in the RSI momentum gauge – it's thought that momentum turns before price, so this could be a bearish harbinger of what the ETF might do next. Supporting that thesis is falling volume during what may be the latter stages of the consolidation pattern. A breakdown on high volume could take place soon. Finally, there’s ample volume by price in the $65 to $85 range, so if TAN indeed drops, there will be a high amount of overhead supply on subsequent rallies.
TAN: Bearish RSI Breakdown, Declining Volume During the Price Consolidation
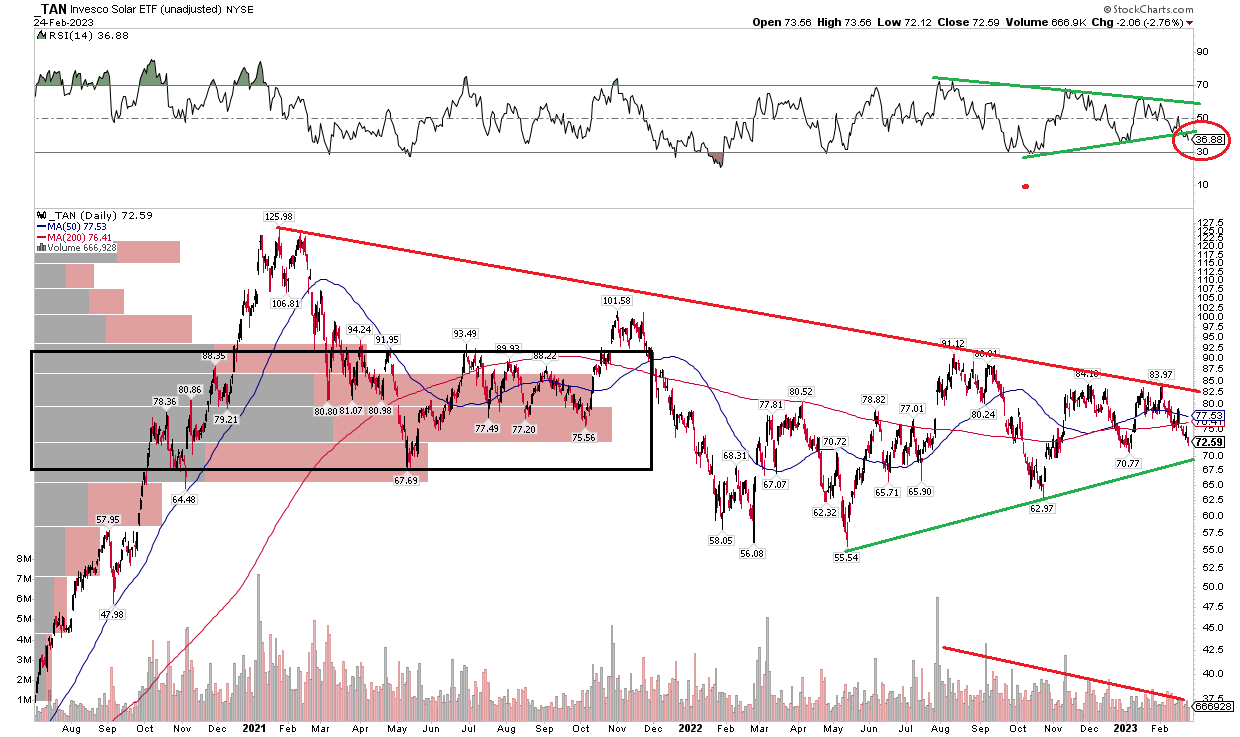
Stockcharts.com
Here is a look at TAN’s relative strength compared to the S&P 500. After a massive run-up from May through September last year, performance against the market has softened. In fact, relative strength is now the weakest in four months. A breakdown in this chart is another tell-tale sign that downside risks are real with TAN’s price.
TAN: Relative Strength Breakdown
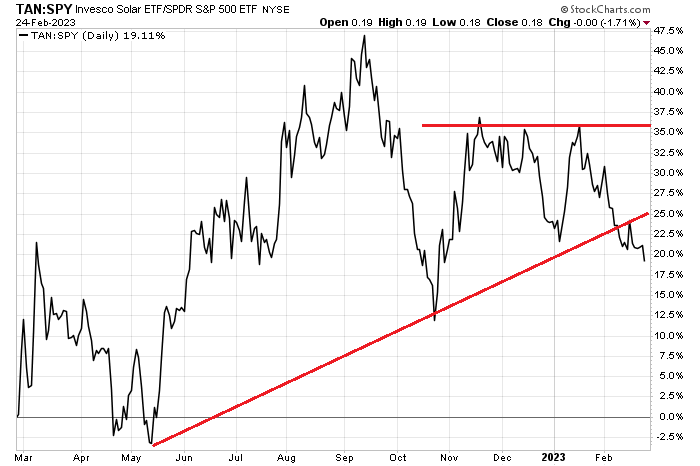
Stockcharts.com
Finally, seasonality suggests risks for further downside now through late March, according to data from Equity Clock. So, perhaps we will see a quick breakdown to support, then you can step in to scoop up shares close to the end of Q1.
TAN: Bearish Seasonal Risks Through Late March
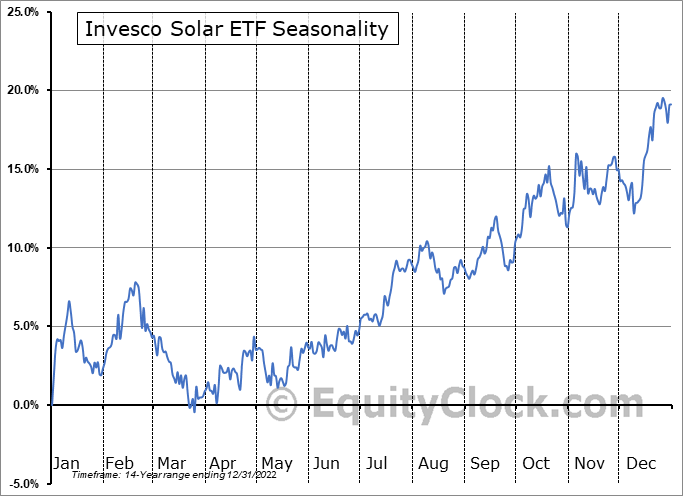
Equity Clock
The Bottom Line
I like the valuation on TAN at these levels, but the technical scene is suspect. Momentum has already broken down, and price could next. If that’s the case, then waiting for a dip to the low to mid-$60s could be a wise tactical play.
This article was written by

Disclosure: I/we have no stock, option or similar derivative position in any of the companies mentioned, and no plans to initiate any such positions within the next 72 hours. I wrote this article myself, and it expresses my own opinions. I am not receiving compensation for it (other than from Seeking Alpha). I have no business relationship with any company whose stock is mentioned in this article.