VNQI: Shares Stuck In A Downtrend, Wait For A Reversal

Summary
- Interest rates have jumped in February, putting pressure on many spots including global real estate.
- With a stronger dollar lately, too, the Vanguard Global ex-U.S. Real Estate ETF has underperformed.
- I see a solid long-term value case, but investors should wait for the technicals to improve.
CHUNYIP WONG
Global interest rates have been back on the rise for several weeks now. On Monday, the German 10-year yield jumped to its highest level since 2011, near 2.6%. In the US, T-bills yield near 5% while the 10-year inches toward 4% for the first time since late last year.
Higher interest rates generally put pressure on the Real Estate sector. What’s more, a rising US Dollar Index is a headwind for foreign firms. Both those factors are at play in the Vanguard Global ex-U.S. Real Estate ETF (NASDAQ:VNQI).
German Yields Jumping
Bloomberg, Holger Zschaepitz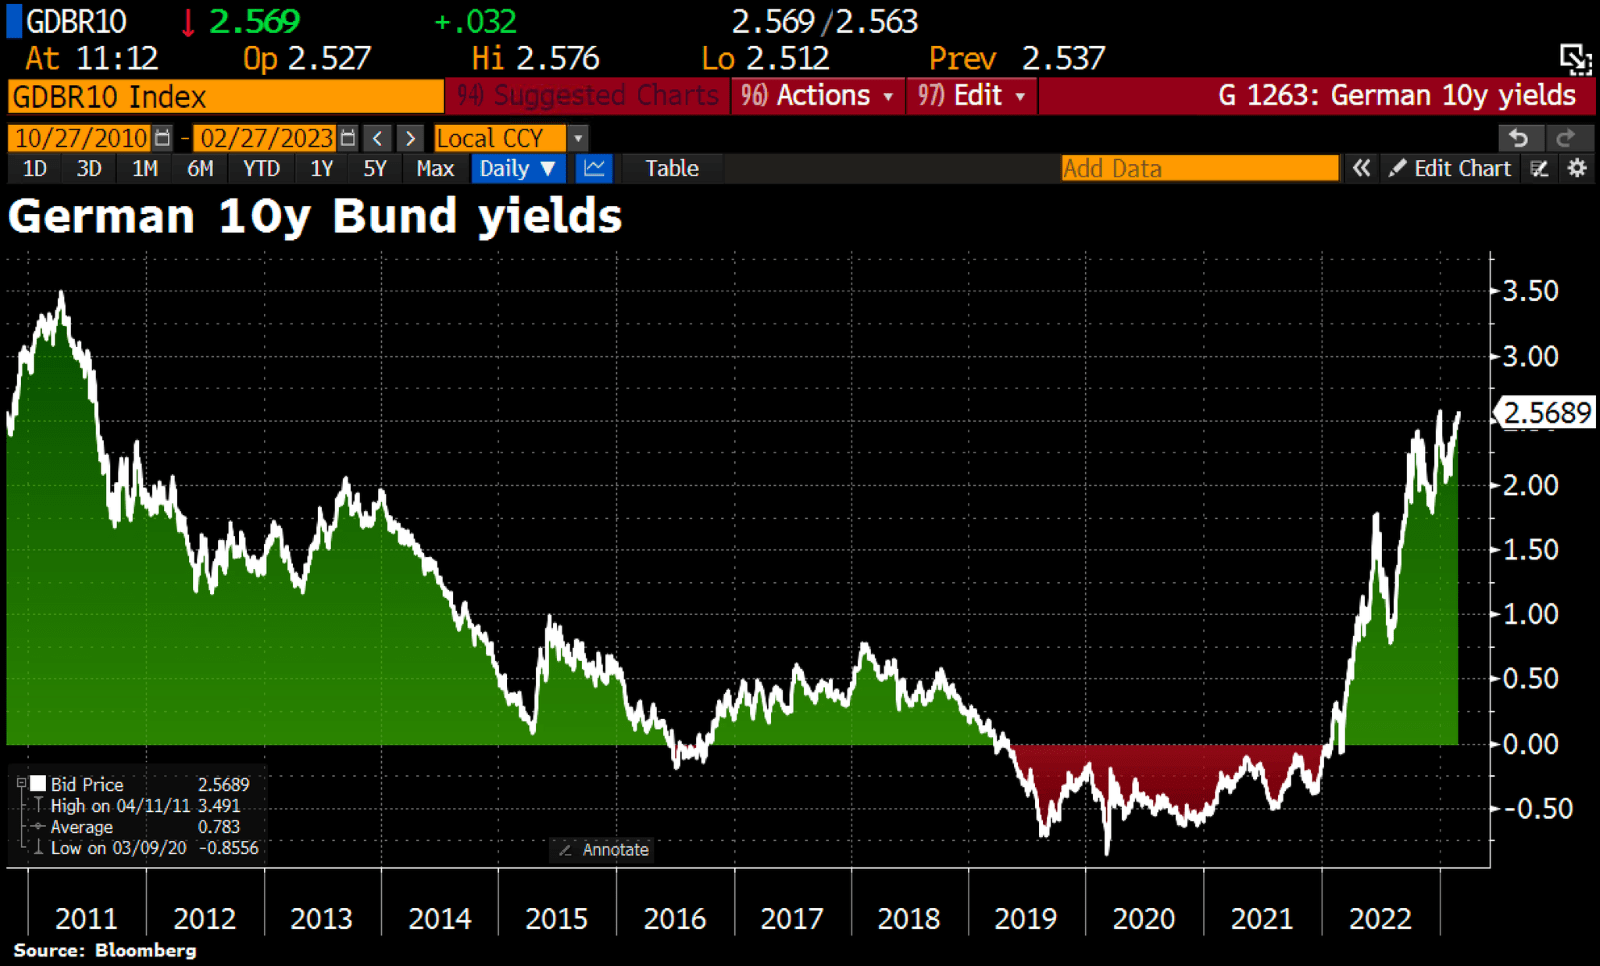
According to Vanguard, VNQI invests in stocks in the S&P Global ex-U.S. Property Index, representing real estate stocks in more than 30 countries. It’s a way to gain broad exposure to the international REIT market and is thought to be a broad gauge of foreign REITs and operating companies’ returns. The ETF offers investors the potential for high growth compared to bond funds, per Vanguard.
With just a 0.12% annual expense ratio and a median 30-day bid/ask spread of 0.14%, the cost is low but the tradeability can be sketchy during periods of low liquidity in the trading day. So, using limit orders around the market open is wise with VNQI. The issuer lists 25-day average volume of 224,000 shares and the fund’s AUM is high at $4.4 billion.
Digging into the portfolio, Morningstar puts VNQI toward the upper-right on the Style Box – indicating that it is a mid to large-cap value fund. I also like to eye the factor profile to get an X-Ray look at the return characteristics. VNQI is a high-yield, value fund with weak momentum (we will go through that later) and a somewhat poor quality of holdings. And that is reflected in its 11.5 price-to-earnings ratio and low price-to-book under 1. I like the valuation on VNQI, and its yield near 5% is attractive.
VNQI Portfolio & Factor Profiles
Morningstar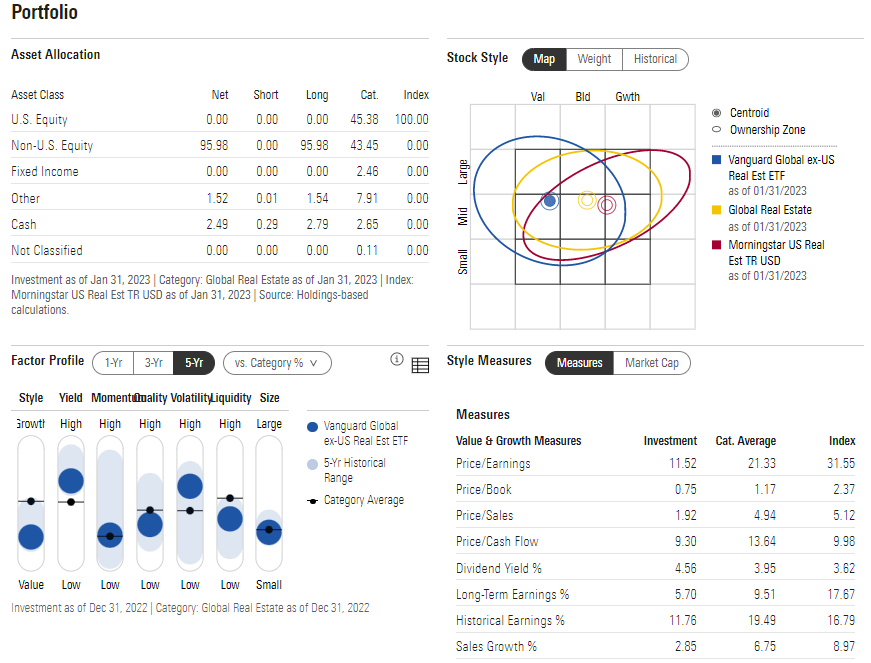
VNQI is cap-weighted and holds 671 stocks. The top 10 positions represent 18% of the fund and turnover is exceptionally low at just 10%. Investors should keep an eye on how Far East economies perform as more than 30% of the ETF is in Japan, Australia, and Hong Kong shares. Overall, the split is 80% developed, 20% emerging markets. The median market cap is just $5.5 billion, and Vanguard lists the earnings growth rate at a tepid 2.7%.
VNQI: More East Exposure Than Europe
Vanguard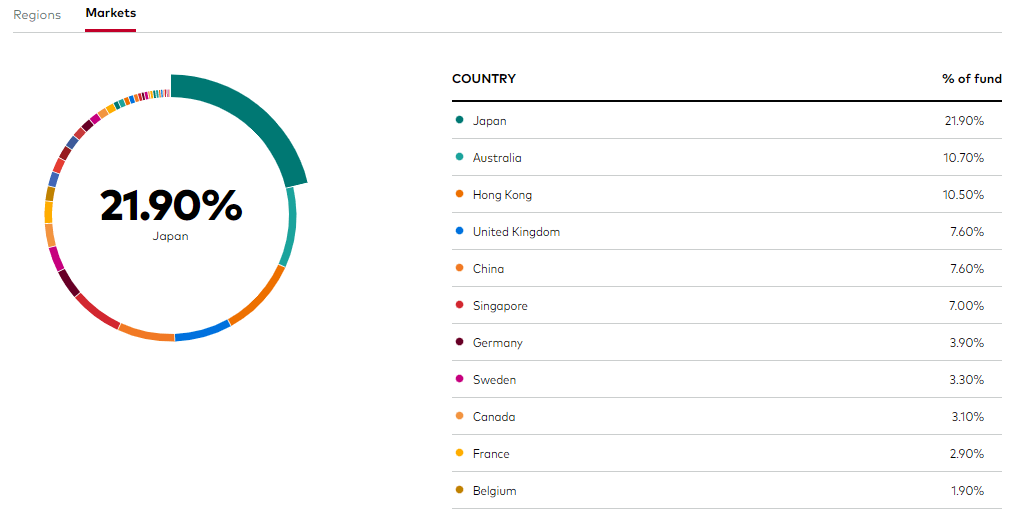
With a good valuation and high exposure to Asia, what does the chart suggest? I see bearish trends. The bulls had a chance to get a sustained rally going, but VNQI has fallen back below its falling 200-day moving average. There was resistance with selling pressure seen in the $45 to $47 range - a move above that zone would support a bearish to bullish reversal case. What’s not ideal for the bulls, though, is that VNQI’s RSI momentum has notched a low below the late December trough – that could have bearish implications for price.
I see support near $40 and at an old gap just below $39. Of course, those levels are not far from the latest price. So, a long position with a stop under $35 is actually still a reasonable long-term risk/reward play. Shorter-term traders want to see VNQI get above $47 for a momentum case to have a firmer footing.
VNQI: Resistance in the mid-$40s
Stockcharts.com
I also like to investigate relative strength. VNQI, compared to the broad non-US market, shows a pronounced downtrend over the past 3 years. Another arrow in the bears’ quiver.
VNQI Relative Weakness Ongoing
Stockcharts.com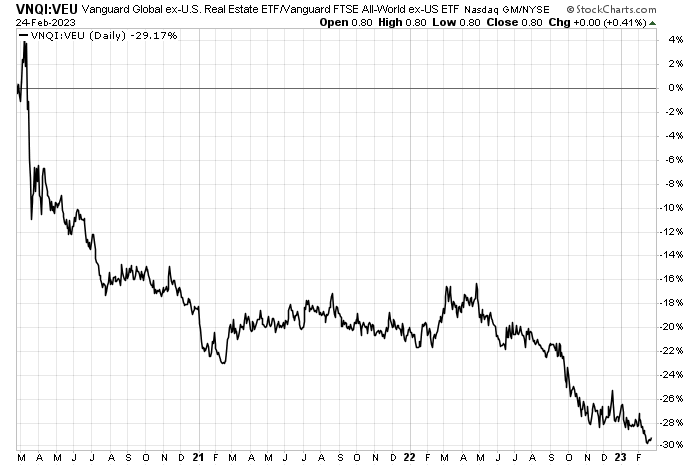
As for seasonality, VNQI tends to underperform the S&P 500 strongly starting in early March, according to Equity Clock – yet another short-term bearish factor.
VNQI: Bearish Seasonal Trends Take Hold
Equity Clock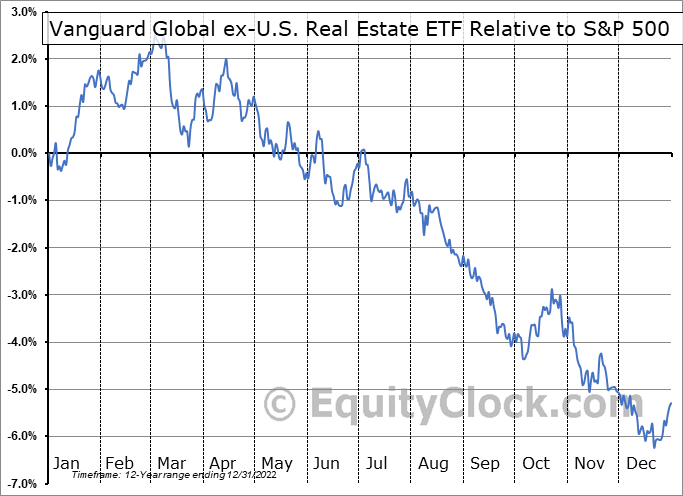
The Bottom Line
I’m a short-term seller of VNQI here. I see the fund getting back into the upper $30s, at which point a better long-term risk/reward setup takes shape. Still, VNQI is an ideal choice for long-term diversified investors for its low cost and decent tradeability considering how low the valuation is today.
This article was written by

Disclosure: I/we have a beneficial long position in the shares of VEU either through stock ownership, options, or other derivatives. I wrote this article myself, and it expresses my own opinions. I am not receiving compensation for it (other than from Seeking Alpha). I have no business relationship with any company whose stock is mentioned in this article.