Investor Activity In QLD Points To A Trading Range

Summary
- We believe investor activity in QLD, as well as those in other leveraged ProShares ETFs, now point to a trading range market.
- Leveraged ETFs have greater risks of underperforming during trading range markets. This underperformance grows the longer the trading range lasts.
- Even though QLD is only levered 2X, we still think it's best for longer-term investors to sell QLD and buy the basic QQQ index.
- Short-term traders can still use QLD, buying it when prices get oversold and selling when overbought.
Pgiam/iStock via Getty Images
Article Summary and Conclusion
This is follow up to our November 30th article on QLD: The ProShares 2X QQQ ETF Has A Strong Long Term Track Record. That article covered the long term performance of the fund compared to the underlying index. At the time we recommended buying QLD based on the theory of contrary opinion and the extreme degree of bearishness at the time. On publication date QLD was at $39.37. As of the writing of this article, it is $41.96, up 4.8%. Since then, market conditions and investor actions have changed.
We believe internal investor metrics in QLD, as well as those in other leveraged Proshares ETFs, now point to a trading range market. As you will see later, there have been historic in and out swings of cash flow in QLD over the last six months. This shows intense investor tension about the direction of the market and we believe it points to a trading range market.
Leveraged ETFs have greater risks of underperforming during trading range markets. This underperformance grows the longer the trading range lasts. Even though QLD is only levered 2X, which is much less than the 3X fund TQQQ, we still think it best to sell QLD and buy the basic QQQ index.
Using ProShares Investor activity as market indicators
We use investor activity in ProShares leveraged ETFs more as indicators for the market itself than whether that fund is the best vehicle to profit from those indications. In other words, certain investor activity in QLD, from past history, might indicate higher prices for the general market. It’s assumed this is because investor activity in the ETF is representative of what investors are thinking everywhere. It doesn’t always mean, however, that we think that a fund is necessarily the best vehicle to take advantage of the indicated move. That depends more on the time horizon and risk tolerance of the investor. We always try to distinguish this.
Risk Warning
The following warning about using highly leveraged ETFs is provided by ProShares.
ProShares Ultra QQQ seeks a return that is 2x the return of its index (target)for a single day, as measured from one NAV calculation to the next. Due to the compounding of daily returns, holding periods of greater than one day can result in returns that are significantly different than the target return and ProShares' returns over periods other than one day will likely differ in amount and possibly direction from the target return for the same period. These effects may be more pronounced in funds with larger or inverse multiples and in funds with volatile benchmarks. Investors should monitor their holdings as frequently as daily. Investors should consult the prospectus for further details on the calculation of the returns and the risks associated with investing in this product.
One should also read this detailed message from the SEC on the risks inherent in leveraged ETFs: Updated Investor Bulletin: Leveraged and Inverse ETFs
History of QLD Net Asset Value
QLD is a double leveraged index fund. Its NAV since inception is shown in the chart below. Its long term history and performance can be found in the earlier article The ProShares 2X QQQ ETF Has A Strong Long Term Track Record.
As the graph shows, from the low in March of 2020 to the high at the end of 2022, the price of QLD went from $18.17 to $90.82. This is a gain of 399%. From the high of $90.82 to the low $33.74 at the end of 2022, it declined 63%. Its currently up 22% from the year end low. These numbers show the profit potential and inherent risks of levered ETFs.
History of QLD NAV since inception (Michael McDonald)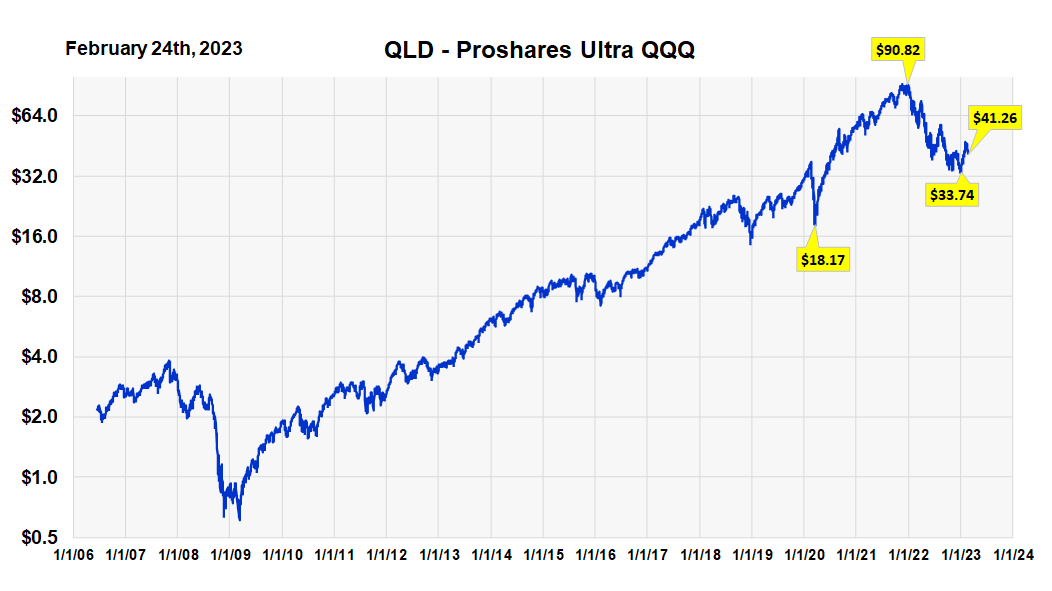
Total Assets Under Management - QLD
The chart below graphs the history of assets under management of QLD since inception. It’s the fourth largest fund in the ProShares family and, with $3.2 billion in assets, it accounts for 5.2% of the fund family. The fact that the assets chart has a similar pattern to the NAV chart indicates that the investor base in QLD hasn’t changed much. In itself this is not an indication one way or another about the fund or the outlook for the overall market.
History of QLD Assets under management (Michael McDonald)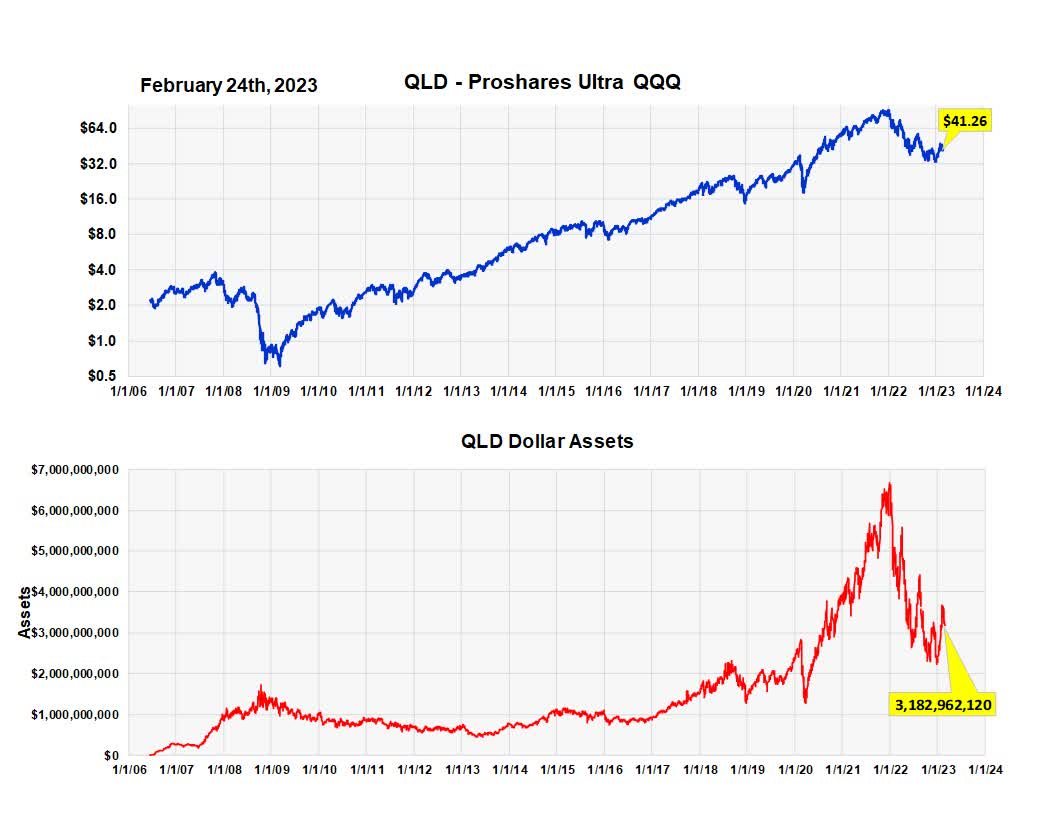
Buying levels in QLD
We have another way of measuring investor buying by measuring the dollar amount of daily buying in QLD as a percentage of total assets. Historically, peaks in the amount to buying of QLD usually occur near price lows as the black arrows indicate.
The ratio is currently 7.1%. As the chart shows an historically low number is 3.5%. The highest number over the last eight years was 27%. This shows the current number is in the middle of the range. This buying index is not telling us anything significant.
Average daily buying of QLD as percent of assets (Michael McDonald)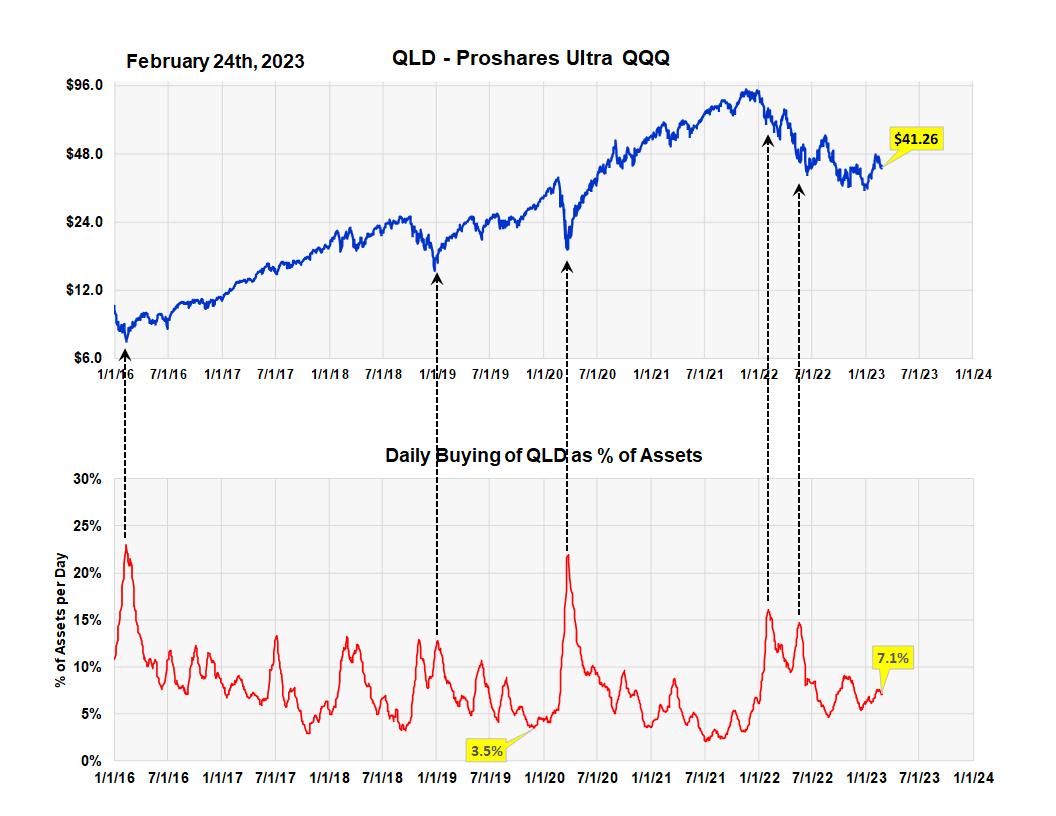
QLD cash flow
The chart below shows cash flow in and out of the fund. If more people sell than buy, there is a net outflow of money. If more buy than sell, there is a net flow of money into the fund.
As the chart shows investor timing in QLD is not very good. At price lows, when one would want a positive cash flow, it goes negative. At price highs, when one would want a negative cash flow, it goes positive.
While buying levels in QLD continue mid-range, selling levels have declined. So much so that the net cash flow into the fund, at .34%, is near record levels. This is graphically shown in the chart.
What catches our eye are the violent swings in cash flow over the last six months into and out of the fund. It has no historic precedent. To us this shows intense investor tension about the direction of the market and we believe it points to a trading range market.
Average daily cash flow in QLD over last forty days (Michael McDonald)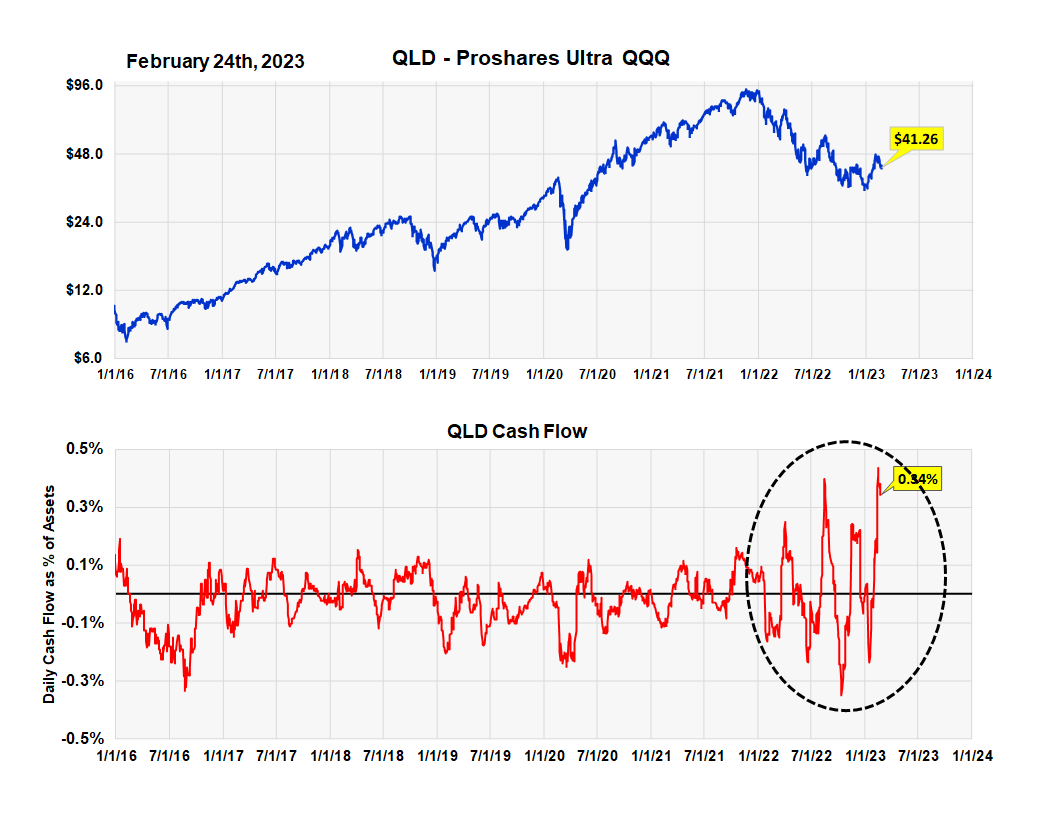
Takeaway
There have been large swings in cash flow into and out of QLD over the last six months. This shows intense investor tension about the direction of the market and we believe it points to a trading range market.
Leveraged ETFs have greater risks of underperforming during trading range markets. This underperformance grows the longer the trading range lasts. Even though QLD is only levered 2X, which is much less than the 3X fund TQQQ, we still think it best to sell QLD ETF and buy the basic QQQ index.
Additional Warning on Risks of Leveraged and Inverse Funds
The return of the Fund for periods longer than a single day will be the result of its return for each day compounded over the period. The Fund’s returns for periods longer than a single day will very likely differ in amount, and possibly even direction, from the Fund’s stated multiple (2x) times the return of the Index for the same period. For periods longer than a single day, the Fund will lose money if the Index’s performance is flat, and it is possible that the Fund will lose money even if the level of the Index rises.
Longer holding periods, higher Index volatility, and greater leveraged exposure each exacerbate the impact of compounding on an investor’s returns. During periods of higher Index volatility, the volatility of the Index may affect the Fund’s return as much as or more than the return of the Index.
The Fund presents different risks than other types of funds. The Fund uses leverage and is riskier than similarly benchmarked funds that do not use leverage. The Fund may not be suitable for all investors and should be used only by knowledgeable investors who understand the consequences of seeking daily leveraged (2x) investment results of the Index, including the impact of compounding on Fund performance. Investors in the Fund should actively manage and monitor their investments, as frequently as daily. An investor in the Fund could potentially lose the full value of their investment within a single day.
This article was written by

Disclosure: I/we have no stock, option or similar derivative position in any of the companies mentioned, and no plans to initiate any such positions within the next 72 hours. I wrote this article myself, and it expresses my own opinions. I am not receiving compensation for it (other than from Seeking Alpha). I have no business relationship with any company whose stock is mentioned in this article.