The Big-Picture Market Perspective Says That SPY Is Still In An Uptrend

Summary
- Equities appear to be in an uptrend off the October ’22 bottom – and are correcting inside that trend.
- The decline in 2022 was justified by a major change in thinking.
- Remember that stocks will tend to bottom way before a recession ends.
- The Fed will not likely lower interest rates for some time. This could be a year where patience is a virtue.
Buena Vista Images/DigitalVision via Getty Images
Most eyes are pinned on the economy and the Fed right now, causing conspicuous under and over-reactions on equity market action in the short term and tunnel vision among many participants. Unfortunately, the media feeds on this because it knows the topic will garner eyeballs, so it reaches for any related news or any person with an opinion to throw at us.
Recurring questions abound:
“What’s the latest inflation print?" “Is that CPI, PCEPI, or what?” “How will that change Fed thinking – is it good news or bad news?” “Will there be a soft landing, a hard landing, or no landing?” “Is a 2% target realistic or will the Fed claim a victory when we get to 3% and call it a day?” “How soon (if ever) will the Fed pivot to lower rates once inflation starts to come down?”
If you think you know the answers to these questions or believe the pundit of the day on the subject, you are fooling yourself. Neither they nor you have the answers. Even after the announcements are made, the markets have a hard time deciding whether the news is good or bad, changing direction several times in the minutes following some announcements.
Reading the news every day about what moved the markets tends to overfocus our attention on noise trading and away from the general move. General market trends run weeks to months and are very definable if you know how to identify them. Daily gyrations (caused by the headlines du jour) will often move counter to the trend and wreak havoc with your objectivity. To regain the larger perspective, which is much more important than the hourly or daily moves, you need to step back and take a higher-level view. When you do, you can more effectively parse out the short-term moves that are part of the trend from those that are part of the noise.
So, how do you do that?
I do it with a few charts, a discipline for interpreting them, and some basic behavioral analysis. I will share my current analysis for you below and then offer some background for those interested in learning more about my methodology.
The current picture
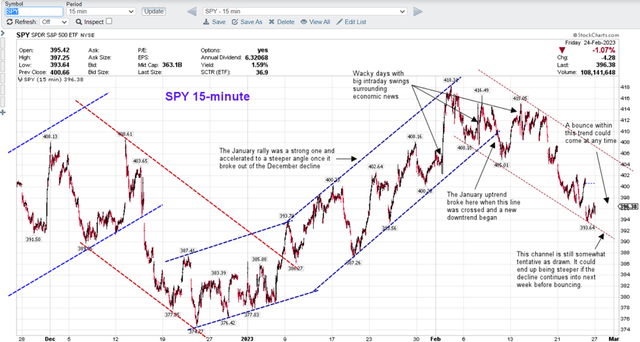
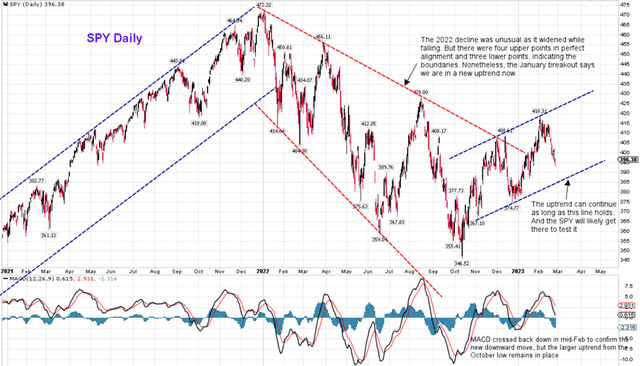
Below are two charts on NYSEARCA:SPY with closing prices from Friday, Feb 24:
- Short-term – Uses 15-minute price ticks and covers about 3 months of time
- Long-term – Uses daily price ticks and covers more than 2 years of time
These two charts can tell you all you generally need to know to see the larger picture. I will often look at the same charts on the QQQ as well, just to confirm my conclusions. The SPY and QQQ are very highly correlated, but sometimes a line or a break on one might not confirm the other, and that can be informative.
SPY 15-minute chart (Stockcharts.com)
SPY Daily Chart (Stockcharts.com)
In simple terms, here is what I take away from these charts:
- The year 2022 was clearly a big reckoning for the market. The post-pandemic recovery was in full swing. But after a nonstop up-year in 2021, the Fed began talking about “normalizing” interest rates and clearing off its bloated balance sheet. Unsurprisingly, a modest (and arguably overdue) correction set in. The correction was initially steep, but by the end of the first quarter, much of the decline had already been recaptured.
- In the second quarter, a boogeyman called inflation, which had not been seen in decades, came out of the shadows. As it sunk in for those who had never experienced this phenomenon before, and people realized that too much inflation is not good, it became apparent that the Fed would need to raise interest rates to keep it at bay. The Fed’s announcements to that effect shook things up more seriously, causing a dreadful second quarter with a low in June. Once again, though, the market recaptured a good bit of the decline in July and August.
- In the fourth quarter, it became apparent that the Fed was serious, inflation was stubborn, and that further tightening was necessary. A low for the year was set in October, though confidence in the strength of the economy enabled the markets once again to recapture much of the previous quarter’s decline. Meanwhile, however, a great deal of money came out of stocks and went into short-term bonds and T-Bills. This is important as it represented a change in mindset that would likely not reverse back into equities so quickly. No doubt, the quick rise in rates caused a fair amount of deleveraging as well – also something that is unlikely to reverse for a while.
- Overall the market took almost a year to digest the fact that high inflation was real, rates might never again be set at zero, and the economic growth was going to be ratcheted back by the Fed to prevent inflation, whatever the cost. The stepwise decline of 2022 and subsequent recoveries was not untypical of the way markets adjust to major new circumstances, especially when there is so much uncertainty surrounding the timing and degree of the consequences.
- Importantly, though, the minor peaks in early December and again in early February of ’23 clearly (according to this methodology anyway) put the 2022 decline to rest and began a new uptrend. The current downtrend on the short-term chart is a correction within this uptrend on the long-term chart. That means the uptrend remains intact, and since it has only been in place for a month or so, it has the ability to continue into March and possibly beyond.
- That means for now the 2022 decline is over, given the information currently known by market participants. If we do enter a recession, which we won’t officially know until after the fact, the market could certainly head lower. But we need to remember how the market reacts to recessions (see my article on that from December here) and it usually bottoms in the early goings of the recession, especially when the recession was so broadly anticipated in advance.
- What does this say about the rest of the year? Sorry, it’s not a crystal ball. It’s just for past and near-term context. However, it does provide parameters for determining the status of current trends in both time frames. A break of the current uptrend line on the long-term chart would be bearish. Until that happens, the momentum actually remains up. Material new information at any time (or the lack of it) will drive the next moves.
My take is that the markets and corporate America still have to digest the idea that interest rates of 5-6% may be the new normal for some time. That changes major decisions about where to put money for companies, pension plans, and individuals. At those rates, people might actually put money back in banks again, heaven forbid. And that process will likely continue for a while, i.e. months. If a recession comes this year, it will have had a great deal of time to have been priced in. If something else happens, like an escalation in the Ukraine war, that’s another story.
The idea of rates heading toward 5% or more should have largely been baked into the 2022 decline. An anticipated recession is also likely in the market’s price already. But since the jury is out on the timing and depth of the recession, the market is somewhat captive here. Meanwhile, a debt ceiling standoff, possible legislation on social security, the war in Ukraine, and even the 2024 election loom as unknowns. Given that the recession and inflation outcome may not become clear for months, it is reasonable to assume that the market will trend in shorter channels until more of the uncertainty is removed.
Accordingly, I believe patience will be a virtue for much of 2023. The good news is that patient investors with cash are in a better position than they have been in quite a while to park their cash in instruments with a reasonable yield or pick up a dividend stream. In addition, option premiums rise with rates, making call writing another way to benefit from patience.
Background on my trend analysis
I’ve practiced trend analysis for more than 30 years, statistically tested it, ran a newsletter using it, and wrote it up in my book “Far from Random – Using Investor Behavior and trend analysis to forecast market movements”, published by Bloomberg in 2009. (Sorry, the book is no longer in print, but I do have some original copies left if anyone is interested.)
The basic premises of Trend Channel Analysis (TCA as I call it) are as follows:
- The broad equity market trends either up or down virtually all the time – continually vacillating back and forth from uptrend to downtrend in multiple time frames. (You can go back decades on the S&P to see that this is the case, even during market extremes.)
- While moves from upchannel to downchannel reliably occur, trend channels all differ in length, slope, and character. Each is completely independent and there are no universal rules as to their shape or internal structure.
- Channels are defined by parallel lines bounding all data in the move, though on rare occasions, the lines converge or diverge as they did in 2022.
- Among other things, TCA is based on the herding principle and the law of large numbers. As such, it works very well at the market level, but is not reliable on individual stocks, which have smaller audiences and lots of individual idiosyncrasies.
- Channel lines cannot be drawn with confidence until a channel develops, so once a break occurs, you may need to wait until you can see its shape. Preliminary channel lines can be drawn but they can change as the channel matures.
- TCA is not a crystal ball. It is a tool for gaining big-picture context on whether the market is trending up or down. It cannot be expected to tell you exactly where or when a trend will end – only that it already has. Users need to recognize the value in that and not to set unrealistic expectations.
This article was written by
Disclosure: I/we have no stock, option or similar derivative position in any of the companies mentioned, and no plans to initiate any such positions within the next 72 hours. I wrote this article myself, and it expresses my own opinions. I am not receiving compensation for it (other than from Seeking Alpha). I have no business relationship with any company whose stock is mentioned in this article.
