Is Recent Investor Activity In SQQQ Signaling A Changing Market?

Summary
- Since inception, short-term timing by investors in SQQQ, as a group, has been more right than wrong.
- While most invest short term (days), their movements in an out, when taken collectively, seem to able to indicate long-term market trends.
- The large exit of money out of SQQQ last October, as a percent of assets, was the highest in history, producing a strong buy signal.
- The big question is: is the recent surge of money back into SQQQ a normal reaction after a major low, or a sign of trouble for the market?
- We tend to believe this back-and-forth movement by investors is pointing to a narrow, trading range market.
Pgiam/iStock via Getty Images
This is a follow up to our October 11th article: SQQQ Metrics Still Indicate A Bear Market Bottom. In that article we said investor activity in the fund pointed to the start of a bull market and recommended selling SQQQ. At the time it was priced at $63.20. It is currently at $38.89, down 40%.
Investor activity in SQQQ since December seems to now indicate the opposite. Historically, this movement back in is often normal after a strong buy signal, but at other times it can signal a short term market decline. We tend to believe this back and forth movement by investors in SQQQ is signaling a narrow trading range market.
We therefore think that short term traders can use SQQQ if they believe the market is overbought and about to experience a short term decline. Long-term investors should probably still avoid this short-term instrument.
Using ProShares investor activity as market indicators
We use investor activity in leveraged and inverse ProShare ETFs more as indicators for the market, as opposed to which fund is the best vehicle to profit from those indications. We assume that investor activity in the ETF is often representative of what investors are thinking everywhere, so the activity itself becomes a good indicator for the overall market.
So, if investor activity in a particular ETF points to higher (or lower) stock prices, it doesn't necessarily mean we think that ETF is the best vehicle to take advantage of the indicated move. That decision depends more on the time horizon and risk tolerance of the investor. We try to distinguish this.
Warning
There are large risks using SQQQ to try to profit from market moves. The risk of loss grows the longer one holds the fund. The following warning about using highly leveraged ETFs is provided by ProShares.
ProShares UltraPro Short QQQ (NASDAQ:SQQQ) seeks a return that is -3x the return of its index(target)for a single day, as measured from one NAV calculation to the next. Due to the compounding of daily returns, holding periods of greater than one day can result in returns that are significantly different than the target return and ProShares' returns over periods other than one day will likely differ in amount and possibly direction from the target return for the same period. These effects may be more pronounced in funds with larger or inverse multiples and in funds with volatile benchmarks. Investors should monitor their holdings as frequently as daily. Investors should consult the prospectus for further details on the calculation of the returns and the risks associated with investing in this product.
The return of the Fund for periods longer than a single day will be the result of its return for each day compounded over the period. The Fund's returns for periods longer than a single day will very likely differ in amount, and possibly even direction, from the Fund's stated multiple (3x) times the return of the Index for the same period. For periods longer than a single day, the Fund will lose money if the Index's performance is flat, and it is possible that the Fund will lose money even if the level of the Index rises.
Longer holding periods, higher Index volatility, and greater leveraged exposure each exacerbate the impact of compounding on an investor's returns. During periods of higher Index volatility, the volatility of the Index may affect the Fund's return as much as or more than the return of the Index.
The Fund presents different risks than other types of funds. The Fund uses leverage and is riskier than similarly bench marked funds that do not use leverage. The Fund may not be suitable for all investors and should be used only by knowledgeable investors who understand the consequences of seeking daily leveraged (3x) investment results of the Index, including the impact of compounding on Fund performance. Investors in the Fund should actively manage and monitor their investments, as frequently as daily. An investor in the Fund could potentially lose the full value of their investment within a single day.
One should also read this detailed message from the SEC on the risks inherent in leveraged ETFs: Message from SEC on leveraged ETFs.
SQQQ NAV
SQQQ is a highly leveraged, volatile fund. It's an inverse index fund meaning the price should go up when the market declines. Its NAV since inception is shown below. As one would expect, it did very poorly during the long, secular bull market falling from an adjusted price of $500,000 per share to $38.
SQQQ NAV since 2010 (Michael McDonald)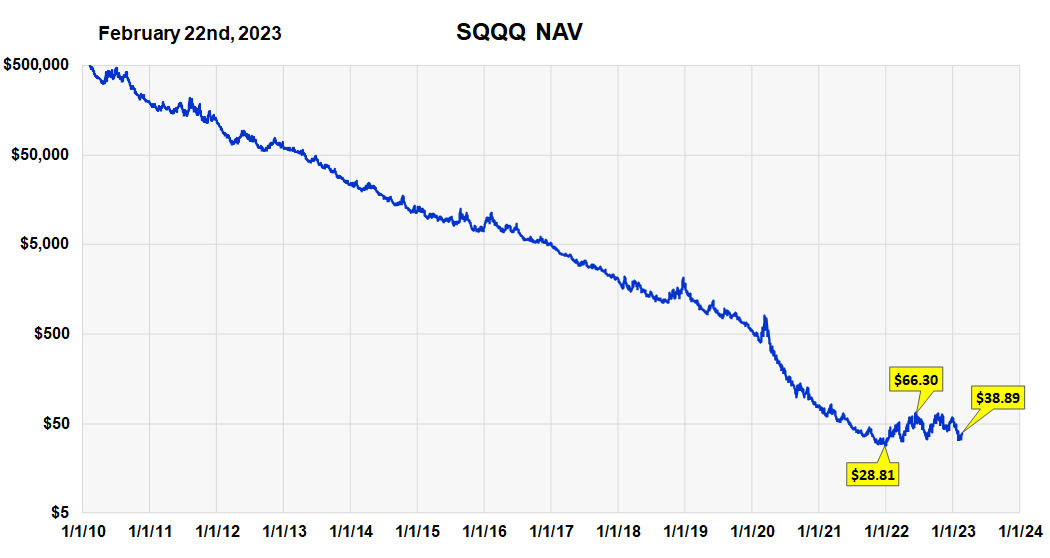
As the yellow price tag indicates, the fund started 2022 at a price of $28.81. During the bear market it reached a high of $66.30 by late May. This was a gain of 130%. It double topped in October and has since declined to $38.89 as of 2/22/23. While these moves look small on the chart they are significant price changes that dramatically highlight the opportunities and volatility in the fund.
(In this article, we plot the fund metrics against the underlying QQQ price index and not SQQQ. This makes it easier to see any correlations of investor activity with the stock market. It's too hard to see these using SQQQ because the extreme price decline washes out any visual correlation).
SQQQ Shares Outstanding
The consistent price decline in SQQQ has forced ProShares to regularly do reverse stock splits to lift the NAV back up to acceptable price levels. This is why we only show the SO graph from 2018 to present. This shrinkage in the adjusted number of shares makes it hard to glean any significant conclusion from long-term trends in shares outstanding for periods of time longer than this.
Shares outstanding of SQQQ (Michael McDonald)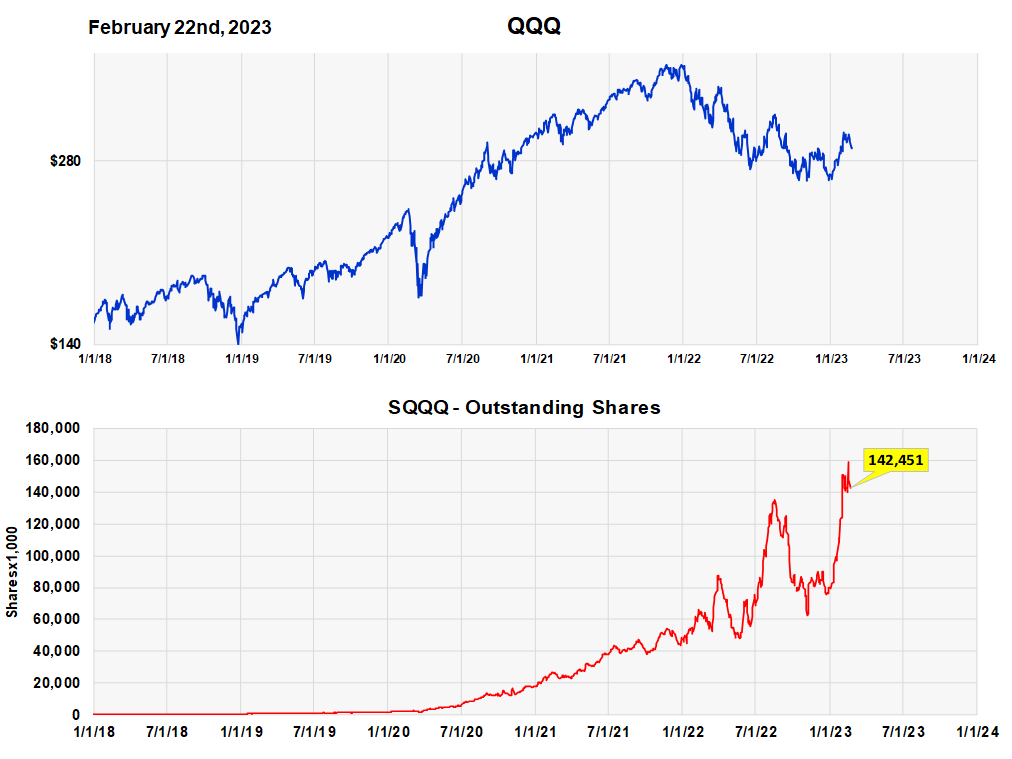
The chart of shares outstanding does indicate that investors in SQQQ as a group, seem to have shown rather good market timing. Peaks in the number of shares outstanding seem to occur at major market tops, where you would want it to occur. The number of shares outstanding also seems to shrink at market lows (price highs of SQQQ) as one would hope.
The current number of 142,451 shares, is just slightly below the recent highs of a few days ago. It's too early to tell if this is a warning sign for the market or is somewhat normal.
Total Assets Under Management - SQQQ
SQQQ is the third largest fund in the ProShares ETF family and, with $5.5 billion in assets, it accounts for 8.5% of the total. The fact that total assets rose since November during the market advance and price decline in SQQQ, is due to the large number of traders who bought the fund into the rally.
Chart of Total Assets in SQQQ since inception (Michael McDonald)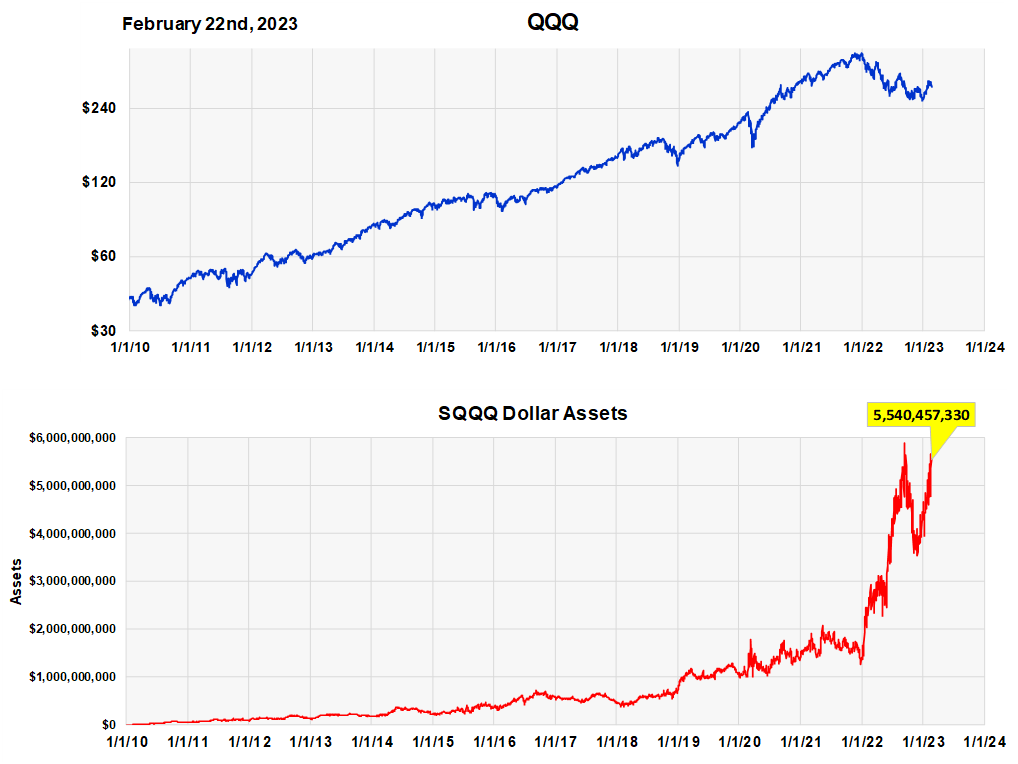
Buying levels in SQQQ
We have another way of measuring investor activity and that's by measuring the dollar amount of daily buying of SQQQ as a percentage of total assets. It's currently 106%. A low percent is 20%. The highest number, which occurred last year, is 280%. These are quite extreme swings in buying activity
The black arrows show that high buying levels in SQQQ seem to occur at market price lows. The current ratio is still a high ratio and should imply further price gains. However, we believe the next chart, which shows total cash flow in and out of the fund, is more insightful at this time.
Average daily buying in SQQQ as a percent of total assets (Michael McDonald)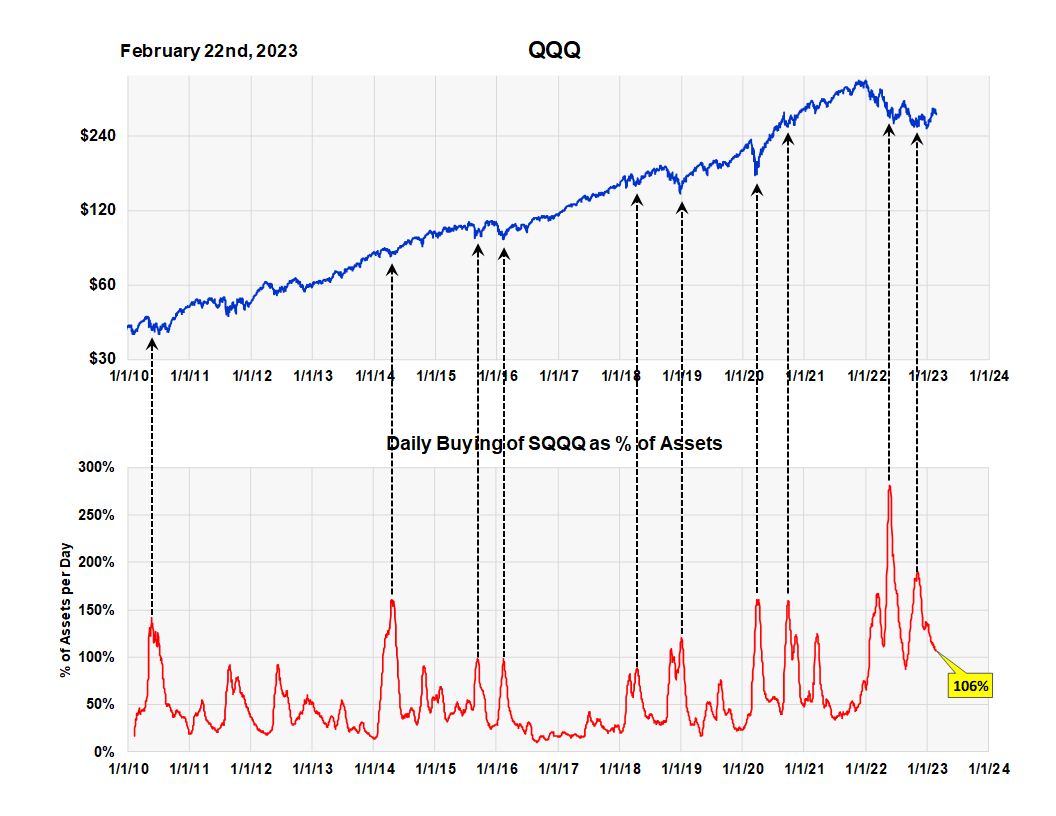
SQQQ cash flow
While buying levels in SQQQ continue to be high, selling levels have declined quite a lot. So much so that the net cash flow into the fund is now very positive. It was the record negative cash flow in SQQQ last October (see last black arrow) that prompted the buy signal on the market and the sell signal in SQQQ.
If one studies the graph, a large surge back into the fund after a large surge out is common, so we are not sure if it's signaling a reversal in trend or not. Our feeling is that this large back and forth flow of money into SQQQ is signaling strong tension in investor opinion about the market and may indicate the continuance of a narrow trading range. This conclusion is reinforced by relatively small price changes in the face of these large investment swings.
Average forty day cash flow per day in SQQQ. (Michael McDonald)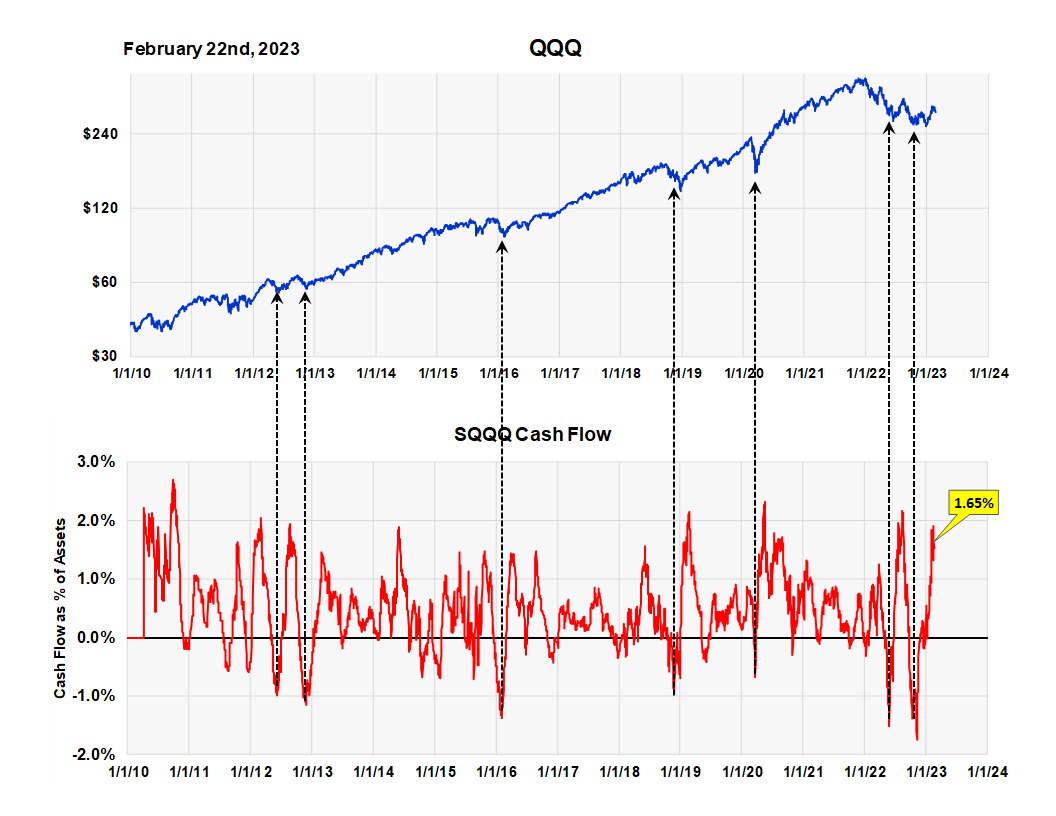
Takeaway
We think this rapid back and forth swing of investors into and out of SQQQ is signaling a narrow trading range market. If we are right, traders can use SQQQ to try to profit from short term downward market swings when the market becomes overbought. But trading positions should only be limited to days in the market.
This article was written by

Disclosure: I/we have no stock, option or similar derivative position in any of the companies mentioned, and no plans to initiate any such positions within the next 72 hours. I wrote this article myself, and it expresses my own opinions. I am not receiving compensation for it (other than from Seeking Alpha). I have no business relationship with any company whose stock is mentioned in this article.