The Budget Outlook - Part III A Fiscal Mess

Summary
- The Federal Reserve is in the midst of a tightening cycle with the objective of beating down inflation even at the expense of economic growth.
- CBO released its ten-year budget outlook in mid-February.
- The CBO assumptions of uninterrupted economic growth and an absence of negative externalities are reasonable in most circumstances.
- This time, though, the odds of a recession seem quite high as the Federal Reserve is in the midst of a tightening cycle.
- The publicly held debt is forecast to rise to $46.4 trillion by 2033 and the debt to GDP ratio would go from slightly less than 100% currently to nearly 120% in 2033.
BackyardProduction/iStock via Getty Images
Our recent reports on the federal budget: The Federal Budget: Part 1 - Feeding At The Trough and The Federal Budget: Part II - Is This Time Any Different?, laid out in stark detail the failure of past efforts to gain control over the federal budget. Both political parties have repeatedly abrogated fiscal responsibility in favor of political expediency. It is often said that the road to hell is paved with good intentions. The record of the past twenty years attests to this. A by-product of this failure is shown on Chart I attached. It documents the historical record of aggregate economic growth overlaid with a ratio of federal government outlays to GDP.
From the early 1960s to about the century’s end real GDP growth averaged about 3.25% yearly. Since the year 2000 real GDP growth has been a paltry 1.25% on average, pulled down in part by the 2008-09 financial crisis; a subsequent weak economic recover; and most recently by the pandemic. Is it mere coincidence that from 1960 to 2000 federal outlays comprised a fairly steady 20% of GDP, but since 2000 the ratio has moved up to about 23%. It certainly supports the notion that the more government you get, the less economic growth you get in return.
Chart II attached shows the breakdown of federal outlays into its mandatory and discretionary components. Net interest on the debt is its own category. Mandatory programs are those not requiring new appropriations e.g. social security and Medicare. Discretionary programs like national defense and education require new appropriations every year. The chart shows the lines intersected in the early 1960s with mandatory spending taking a steadily increasing share of the total ever since. Indeed, entitlement programs have accounted for all the growth of federal spending since GDP growth downshifted secularly, which is when the outlays to GDP line moved up from 20%.
As shown on Chart II federal spending really exploded in the 2020-22 period as the government responded to the COVID-19 pandemic with massive support. Be mindful that the government’s initial rescue effort was branded as a temporary buffer to the economy’s spring 2020 shutdown and an anticipated summer reopening. But in Washington it seems that temporary is a rarity, and as the pandemic lingered so too did the national health emergency and the spending that went with it. Table I attached shows that pandemic related spending totaled $1.6 trillion in 2020; $1.75 trillion in 2021; and $442 billion in 2022. In 2021 this spending was supplemented with the Biden administration’s $1.9 trillion American Rescue Plan.
The administration is finally declaring an end to the health emergency as of May 11, 2023, which will terminate pandemic relief programs. In its current budget outlook, the Congressional Budget Office CBO) assumes an end to these programs in 2023, even though the administration is still seeking funds for student loan forgiveness and mortgage and rent relief. These are being put on hold pending court decisions and Congressional inaction.
CBO released its ten-year budget outlook in mid-February and the Biden team is scheduled to release its own budget in early March. The Biden budget will undoubtedly include various tax and spending proposals laid out in the President’s State of the Union. But the CBO forecast is based on current law. Thus, its outlook assumes the Trump administration Tax Cut and Jobs Act sunsets at the end of 2025. CBO includes the $1.9 trillion American Rescue Plan; the $1 trillion infrastructure plan; the $50 billion CHIPS Act; and the $0.535 trillion Inflation Reduction Act. The outlook assumes there are no business recessions nor any economic emergencies over the forecast period.
The assumptions uninterrupted economic growth and an absence of negative externalities are reasonable in most circumstances even though ten-year periods rarely escape such events. This time, though, the odds of an occurrence seem quite high as the Federal Reserve is in the midst of a tightening cycle with the objective of beating down inflation even at the expense of economic growth. Moreover, for obvious external shocks there is the ongoing war in Ukraine and the high likelihood that supplemental appropriations will continue being requested and granted to provide military support. There is also increasingly bellicose rhetoric between this country and China, and of course Iran and North Korea are ongoing pests.
CBO’s ten-year budget outlook is presented in summary form on Table II attached. The outlook is sensitive to macro assumptions pertaining to economic growth and interest rates, although with mandatory spending continuing to take an increasing share of outlays that sensitivity is being blunted. At any rate CBO forecasts that real GDP growth will continue the sub-par performance of the past twenty years. The treasury ten year note yield is forecast at 3.8% every year which is higher than every year since 2007, but perhaps not high enough. Given these assumptions the federal deficit is shown to have fallen in 2022 from the pandemic bulge of 2020-21, and then stabilize at around $1.4 trillion in 2023. Then it is shown to rice steadily through 2033. Cumulatively CBO projects that the deficit will add $20.3 trillion to the federal debt over the forecast period. Thus, the publicly held debt is forecast to rise to $46.4 trillion by 2033 and the debt to GDP ratio would go from slightly less than 100% currently to nearly 120% in 2033.
If realized, this mosaic shows that all the economic stimulus leveled at the economy during and immediately after the pandemic is leaving in its wake little to no improvement in the economy’s underlying growth rate; the highest inflation and interest rates in the last fifteen years; and a whole lot more debt. This debt must be financed and Table II shows that interest payments will reach $1 trillion in 2028 and $1.4 trillion by the end of the forecast period. Interest payments will absorb a steadily rising portion of total outlays, reducing flexibility in the budget and very likely crowding out overall spending with discretionary programs being the first to be affected.
This is a disturbing prognosis particularly since we would regard it as a best case. As noted earlier the assumptions of uninterrupted growth and an absence of external shock are heroic to say the least. More concretely, this year’s budget is already running above expectations due to higher interest rates, falling capital gains revenue, and defense supplementals. Looking forward, the Federal Reserve is no longer remitting funds to the treasury as policy has shifted from quantitative easing to quantitative tightening. The fed has turned from a buyer to a seller of securities as have other dependable buyers like China and Japan. Moreover, most countries are beginning to allocate more resources to national defense. This will require funding which implies an increasing supply of sovereign debt globally. This in turn would raise the specter of higher interest rates and even higher interest payments on the national debt.
In addition, there are very questionable assumptions included in the Inflation Reduction Act. For example, expanded IRS enforcement is forecast to generate a net $100 billion of revenue over the forecast period. Green energy subsidies are estimated to be about $30 billion. We would submit that IRS enforcement will generate a fraction of this amount while green energy subsidies could be about five times the $30 billion that is forecast. Remember back in 2010 the federal government takeover of student loans was advertised as a money saver that would pay for Obamacare.
This exercise is not to imply that all is lost and the only thing saving the country from becoming a banana republic is that the dollar is still the world’s reserve currency. However, the dollar standard is built on confidence and confidence can be very fragile. Indeed, regional currency blocks are surfacing, and digital currencies are lurking in the underbrush. Thus, remedies to the fiscal mess need to be found.
There are viable cures, but they require difficult choices and responsible action from the legislature. The most direct remedy would be a step up in the economic growth rate. Economic growth is a function of the growth rate of the labor force and productivity. Labor force growth has been restrained by low participation and negative demographics. Participation will likely recover with the elimination of pandemic relief programs. Not much can be done about negative demographics in the short run, but an offset would be responsible immigration reform. Productivity growth would benefit from less federal regulation and a greater emphasis on discretionary government spending. We estimate that if economic growth were one percentage point higher than forecast over the next ten years, the cumulative deficit would be about $2 trillion lower than is currently forecast. But achieving this would require action from Congress.
Another obvious remedy centers on entitlement reform. This will become urgent as the Medicare trust fund will become insolvent by 2028 and the social security trust fund will swing to a deficit not long thereafter. By 2030 Medicare and Medicaid will be the largest line item in the federal budget. Historically Congress does act but only in time of crisis. An entitlement fix was shunned ten years ago as recommendations from the Simpson-Bowles commission were ignored because programs were still solvent. But in the 1980s the Greenspan commission was charged with shoring up a bankrupt social safety net. Congress approved a combination of benefit adjustments and tax changes, and the system achieved a fifty-year life extension.
Congress is increasingly dysfunctional, and this is stymieing effective action. But it was not always this way. For most of the nineteenth century a single committee in the House and Senate determined the total annual budget and made funding trade-offs. This process was abandoned in the 1880-1920 period and deficits proliferated. It was reinstated by the Coolidge administration and appropriation authority was once again consolidated into a single committee. From 1921-1930 federal spending growth slowed and the budget was balanced even as the administration managed to cut taxes three times in the decade.
With the 1930s depression and New Deal legislation entitlement programs expanded. The single committee system was disbanded. Currently jurisdiction for entitlement legislation is dispersed among more than a dozen committees in each branch of Congress. Of course, no committee is accountable for total spending and each committee has reason to expand its programs and advocate for as much benefit expansion as it can get away with. Collectively a lot has been gotten away with and the result is now obvious.
A reversion back to a single committee system and meaningful entitlement reform will involve very difficult choices. Is Congress up to the task? In the meanwhile, the obvious fallback option would be to adopt measures to accelerate the economy’s underlying growth rate. This brings us full circle to the ongoing debate over whether the private sector or public sector is best equipped to successfully achieve this goal. The record of the period from 1960 to 2000 versus the period from 2000 to the present shows the clear winner to be an expansion of the private sector and a diminution of the public sector.
Chart I
Real Gross Domestic Product, Percent Change (5-yr avg centered)and Federal Spending/GDP 1964-2031 (CBO)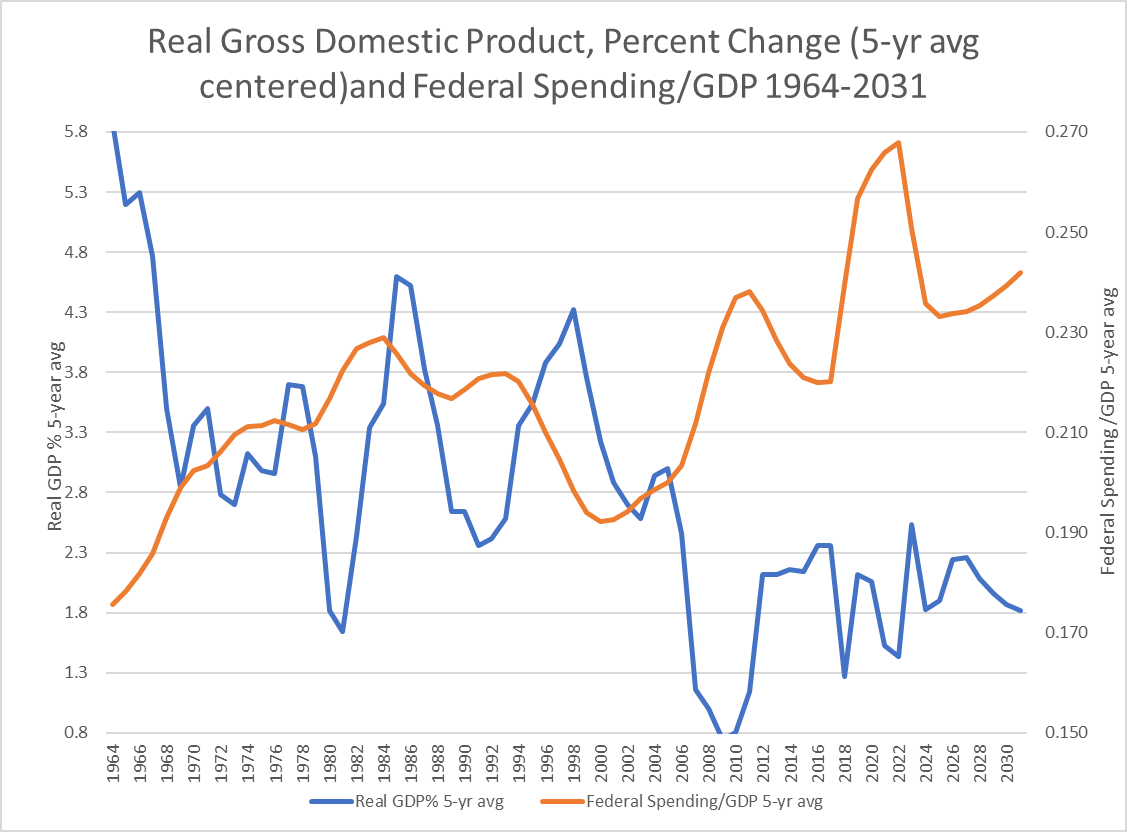
Table I Pandemic Related Spending
Major Program or Category | FY 2020 | FY 2021 | FY 2022 Totals | |||||
$billions | ||||||||
Refundable Tax Credits | 414 | 778 | 291 | 1483 | ||||
Unemployment Compensation | 476 | 397 | 22 | 895 | ||||
Small Business Administration | 577 | 323 | 23 | 923 | ||||
Coronavirus Relief | 149 | 243 | 106 | 498 | ||||
totals | 1616 | 1741 | 442 | 3799 | ||||
Source: created by author with data from CBO
Table II CBO Budget Forecast
$trillions | ||||||||||||||
2020 | 2021 | 2022 | 2023 | 2024 | 2025 | 2026 | 2027 | 2028 | 2029 | 2030 | 2031 | 2032 | 2033 | |
Real GDP % | -2.8 | 5.9 | 1.9 | 0.3 | 1.8 | 2.7 | 2.4 | 2.3 | 2 | 1.9 | 1.9 | 1.8 | 1.8 | 1.7 |
GDP Price % | 1.3 | 4.5 | 7.0 | 3.7 | 2.5 | 2.1 | 2.1 | 2.0 | 2.0 | 2.0 | 2.0 | 2.0 | 2.0 | 1.9 |
Revenues | 3.4 | 4.0 | 4.9 | 4.8 | 4.8 | 5.0 | 5.3 | 5.7 | 5.9 | 6.1 | 6.4 | 6.6 | 6.8 | 7.1 |
Outlays | 6.6 | 6.8 | 6.3 | 6.2 | 6.4 | 6.7 | 7.0 | 7.4 | 7.8 | 8.0 | 8.5 | 8.9 | 9.3 | 9.9 |
Mandatory | 4.6 | 4.8 | 4.1 | 3.8 | 3.8 | 4.0 | 4.2 | 4.4 | 4.7 | 4.8 | 5.1 | 5.4 | 5.7 | 6.1 |
Discretionary | 1.6 | 1.6 | 1.7 | 1.7 | 1.9 | 2.0 | 2.0 | 2.1 | 2.1 | 2.2 | 2.2 | 2.3 | 2.3 | 2.4 |
Net interest | 0.3 | 0.4 | 0.5 | 0.6 | 0.7 | 0.8 | 0.8 | 0.9 | 1.0 | 1.1 | 1.1 | 1.2 | 1.3 | 1.4 |
Deficit | -3.1 | -2.8 | -1.4 | -1.4 | -1.6 | -1.8 | -1.7 | -1.7 | -1.9 | -1.8 | -2.1 | -2.3 | -2.5 | -2.9 |
Debt Held by the Public | 21.0 | 22.3 | 24.3 | 25.7 | 27.4 | 29.2 | 30.9 | 32.6 | 34.6 | 36.4 | 38.6 | 40.9 | 43.5 | 46.4 |
Debt Held by the Public % GDP | 99.8 | 98.4 | 97 | 98 | 100.4 | 102.1 | 103.3 | 104.5 | 106.5 | 107.7 | 109.9 | 112.2 | 114.8 | 118.2 |
10-Year Note % | 0.9 | 1.4 | 2.9 | 3.9 | 3.8 | 3.8 | 3.8 | 3.8 | 3.8 | 3.8 | 3.8 | 3.8 | 3.8 | 3.8 |
Source: created by author with data from CBO
Chart II
Mandatory and Discretionary Spending as % of Total Federal Outlays Actual 1962-2022, CBO 2023-2033
Mandatory and Discretionary Spending as % of Total Federal Outlays Actual 1962-2022, CBO 2023-2033 (CBO)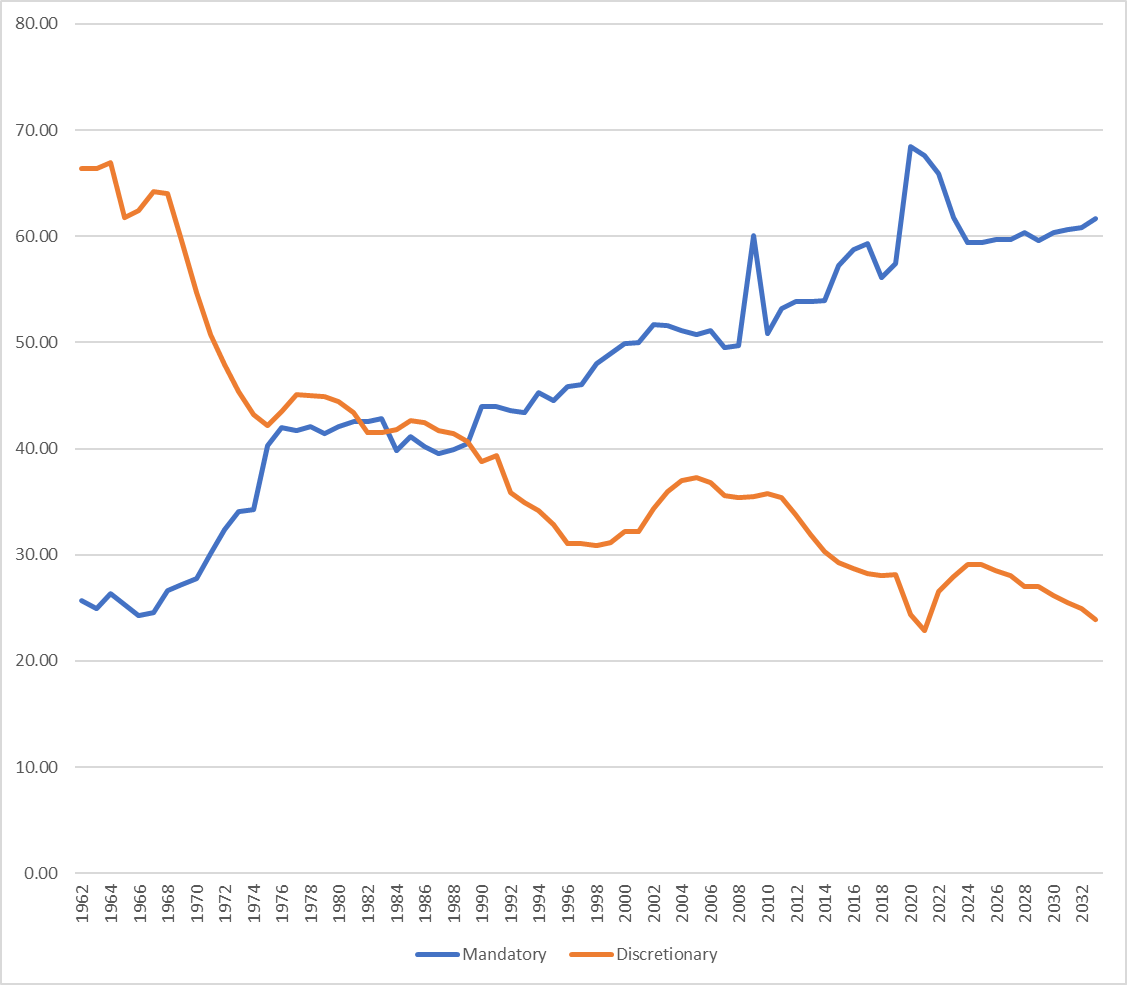
Please note that this article was written by Dr. Vincent J. Malanga and Dr. Lance Brofman with sponsorship by BEACH INVESTMENT COUNSEL, INC. and is used with the permission of both.
This article was written by

Disclosure: I/we have no stock, option or similar derivative position in any of the companies mentioned, and no plans to initiate any such positions within the next 72 hours. I wrote this article myself, and it expresses my own opinions. I am not receiving compensation for it (other than from Seeking Alpha). I have no business relationship with any company whose stock is mentioned in this article.
Additional disclosure: Please note that this article was written by Dr. Vincent J. Malanga and Dr. Lance Brofman with sponsorship by BEACH INVESTMENT COUNSEL, INC. and is used with the permission of both.