Value Investing For The Future: Why IWD Shines Over IUSV

Summary
- IWD and IUSV track the S&P 900 Value Index and the Russell 1000 Value Index. Over the last ten years, IUSV has outperformed by 23% with marginally higher volatility.
- However, I expect that will change going forward. S&P Value Indices are less value-oriented after last year's rebalancings, demonstrated by Microsoft and Amazon listed as IUSV's #1 and #3 holdings.
- IWD is the better choice based on expected earnings growth, valuation, and earnings momentum. Backtested results of each ETF's current portfolio also support this view.
- This article also highlights the fundamentals for the SPDR S&P 1500 Value Tilt ETF, a lesser-known top performer with a 209% ten-year gain.
- Looking for a portfolio of ideas like this one? Members of Hoya Capital Income Builder get exclusive access to our subscriber-only portfolios. Learn More »
IvelinRadkov
Investment Thesis
Over the last ten years, the iShares Core S&P U.S. Value ETF (NASDAQ:IUSV) outperformed the iShares Russell 1000 Value ETF (NYSEARCA:IWD) by 28%. With marginally higher volatility and $53 billion in assets under management, IUSV seems like a no-brainer. However, my review of the fundamentals of each indicates IWD is more appropriate. After the latest reconstitution of S&P Dow Jones Indices, IUSV shareholders have less estimated earnings growth, a higher valuation, and weaker earnings momentum. I advise you to refrain from letting an ETF's historical returns guide your investment decisions today. When presented with the latest fundamentals and reviewing the backtested results of each fund's current holdings, I'm confident you'll agree that IWD is the superior value ETF.
Macro Perspective: Vanguard Favors Value
According to Vanguard, U.S. value equities are more likely to outperform U.S. growth equities over the next decade. The median expected ten-year annualized returns are 5.7% for the category compared to 4.1% for growth.
Vanguard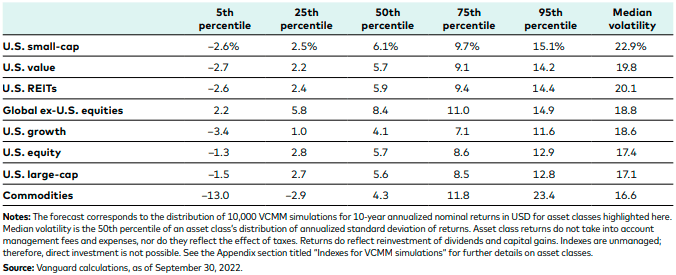
Ten years is challenging to predict. I wouldn't bet the farm based on these projections. However, value and growth typically traded leads going back to 1972. The following five-year rolling returns chart demonstrates how significant gaps quickly close. U.S. large-cap growth stocks significantly outperformed during the dot-com bubble, then gave back those gains to value stocks over the next decade. After the worst of the Great Financial Crisis, growth stocks outperformed again, possibly topping out in late 2021. U.S. large-cap value outperformed by 31% in 2022, but rolling five-year returns remain 2.18% under (8.01% vs. 10.19%). Vanguard likely considered these patterns, which seems reasonable from a common sense perspective.
Portfolio Visualizer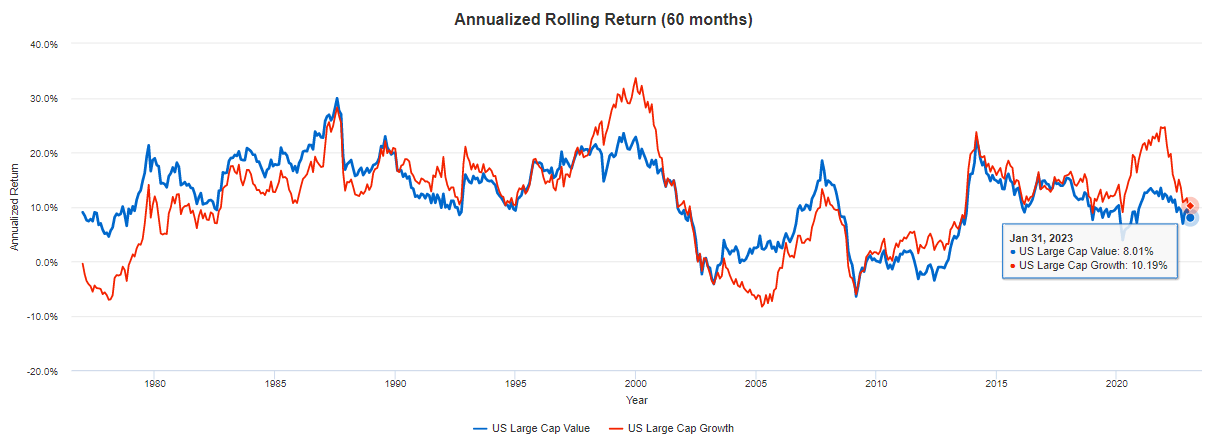
Still, not all value ETFs are equal. Let's take a closer look at how IUSV and IWD differ.
IUSV and IWD Comparison
IUSV Strategy and Top Holdings
IUSV tracks the S&P 900 Value Index, selecting from a universe of 900 of the largest U.S. securities. This Index includes the same securities that comprise the S&P 500 Index and the S&P MidCap 400 Index, is free-float market-cap weighted, and rebalances annually in December. S&P Style Indexes are created by assigning growth and value scores to each component based on the following metrics.
S&P Dow Jones Indices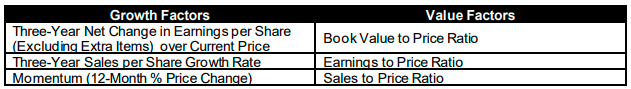
The objective is to divide the market capitalization of the S&P 900 Index equally into growth and value indices while limiting stock overlap. However, stocks can appear in the S&P 900 Value Index and the S&P 900 Growth Index with different weights. For example, Microsoft (MSFT) has a 4.59% weighting in IUSV and a 5.89% weighting in the iShares Core S&P U.S. Growth ETF (IUSG). Essentially, IUSV is a broad-market portfolio that leans value. Below are the fund's top ten holdings, which total 21%.
iShares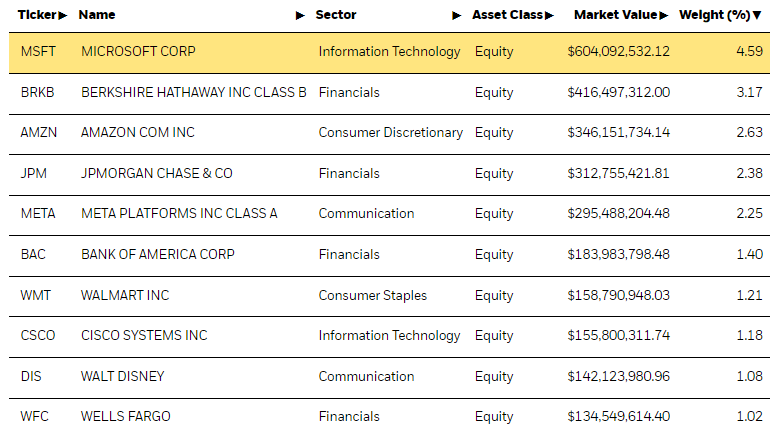
Several top holdings are surprising finds in a value-oriented ETF. Amazon (AMZN) and Meta Platforms (META) stand out; their three-year sales growth rates are approximately 20%. However, Amazon's one-year estimated sales growth is 10.48%, and the stock declined by 50% last year. Meta Platforms' estimated sales growth is worse at 4.96%, and its shares plunged by 64% in 2022. In effect, their growth scores weakened, and value scores improved.
IWD Strategy and Top Holdings
IWD tracks the Russell 1000 Value Index and follows a similar approach as IUSV. According to its Index Page, the Index includes Russell 1000 companies with lower price-book ratios, lower two-year estimated earnings per share growth, and lower five-year historical sales per share growth. The crucial difference is using estimated earnings growth rather than S&P's historical measures. It's my preference, especially in fast-changing markets like today. I described how Amazon and Meta Platforms are forecast to be lower-growth companies. That's happening nearly across the board for U.S. equities as we move through earnings season, and I want an ETF that better reflects those forward-looking views.
IWD's top ten holdings total 18% of the portfolio, less than IUSV's 21%. It's slightly less concentrated due to a more significant number of holdings (846 vs. 705). However, the concentration at the industry level is nearly identical. Both are well-diversified ETFs.
iShares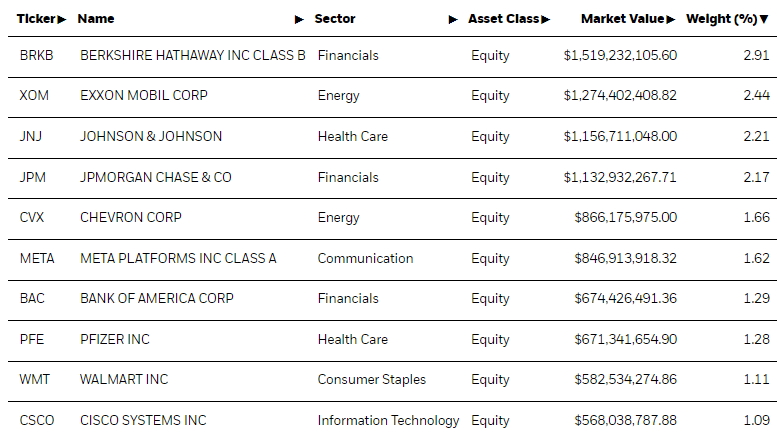
Still, we see some overlap with IUSV. Berkshire Hathaway (BRK.B), JPMorgan Chase (JPM), Bank of America (BAC), Walmart (WMT), and Cisco Systems (CSCO) have similar weightings in each ETF. However, IWD overweights Johnson & Johnson by 1.31%. In addition, IWD holds Exxon Mobil (XOM), Chevron (CVX), and Pfizer (PFE) but not Microsoft or Amazon. I like IWD's additional Energy sector exposure as a just-in-case inflation hedge, and I find its 8% total exposure to the sector reasonable.
Sector Exposures
The following table highlights sector exposures for IUSV, IWD, and the SPDR S&P 1500 Value Tilt ETF (VLU). VLU is a lesser-known value ETF that was a top performer over the last ten years and shares many of the same characteristics as IUSV and IWD.
Morningstar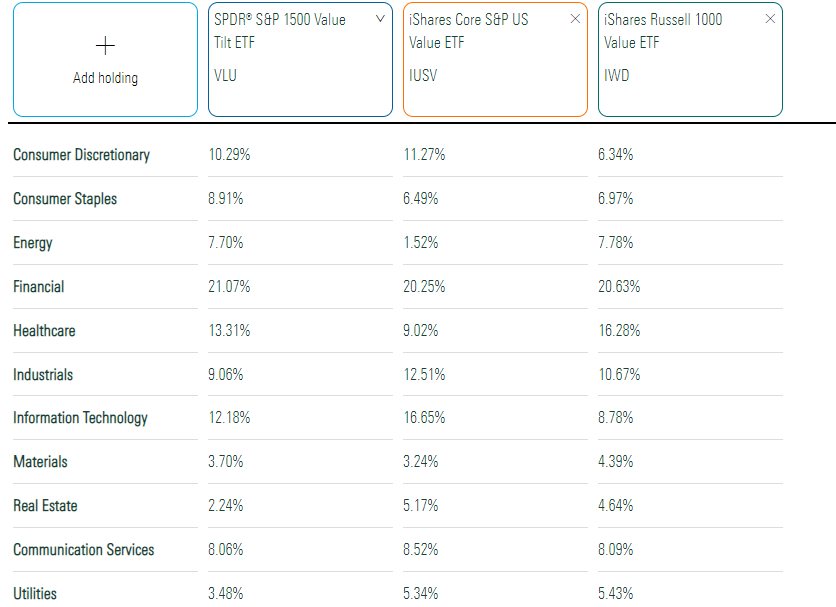
Exxon Mobil and Chevron explain IWD's higher Energy sector allocation relative to IUSV. In contrast, excluding Microsoft and Amazon contribute to IWD's lower Technology and Consumer Discretionary weightings, and IWD has 7% more Health Care exposure.
It's worth noting that IUSV's Index rebalanced in December, but IWD's doesn't until late June. Therefore, IWD's sector composition may change at that time. The changes could be substantial, like with S&P Dow Jones Indices, as described in this article on the SPDR S&P 500 Value ETF (SPYV).
Other Fund Facts
IUSV is the cheapest of the three, with a 0.04% expense ratio. It's also more established, with $52.28 billion in assets under management. Both launched in 2000, while VLU is the newcomer with a ten-year track record.
Morningstar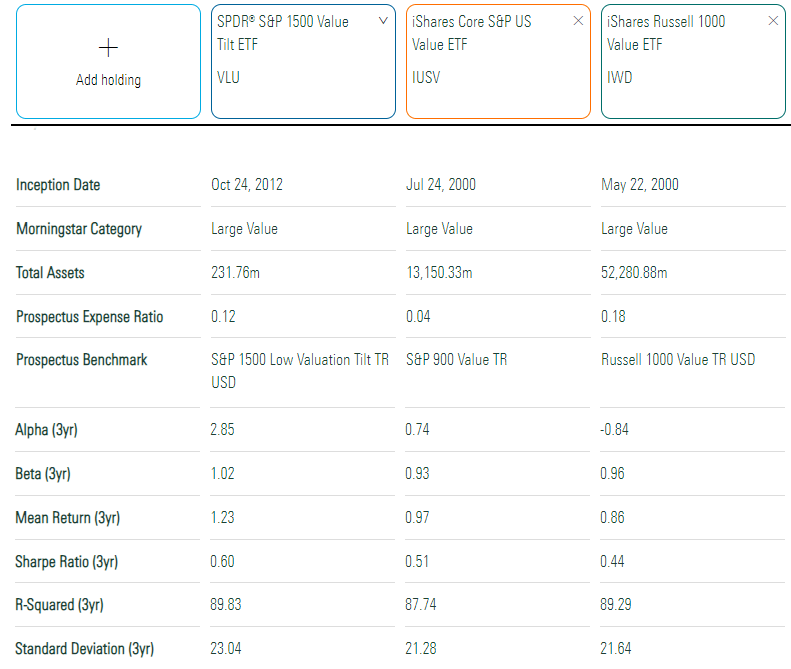
Still, VLU was the clear outperformer over the last three years despite its smaller size. VLU's risk-adjusted returns (Sharpe Ratio) were also the best.
Performance Analysis
Over the last ten years through January 2023, IUSV gained 181.47% compared to 158.22% for IWD. VLU was the top performer with a 209.40% total return. I've listed returns for these and other large-cap value ETFs in the table below.
The Sunday Investor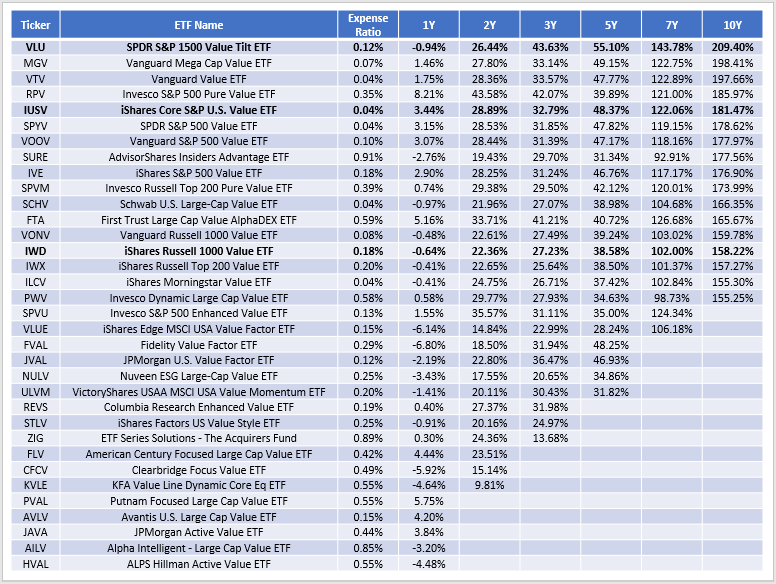
As shown, there are many value ETF choices. IUSV, IWD, and VLU work for broad-market exposure with a value lean. Pure and enhanced value ETFs like RPV, SPVM, and SPVU exist for investors wanting more direct exposure to value factors but are often much more volatile. Vanguard also offers MGV and VTV as low-cost options with excellent track records.
For the 26 funds with a minimum three-year history, the median expense ratio is 0.18%. ETFs at or below this midpoint gained 31.19% on average. Meanwhile, funds with expense ratios above 0.18% gained 29.14%. Conservative investors experienced these same benefits over the last year, too. Low-cost ETFs gained 0.65%, while higher-fee ones declined by 0.24%.
Portfolio Visualizer provides additional risk and return metrics for IUSV, IWD, and VLU. Since VLU's inception in October 2012, VLU gained an annualized 12.00% compared to 11.20% and 10.22% for IUSV and IWD. IWD's risk-adjusted returns (Sharpe and Sortino Ratio) were the worst.
Portfolio Visualizer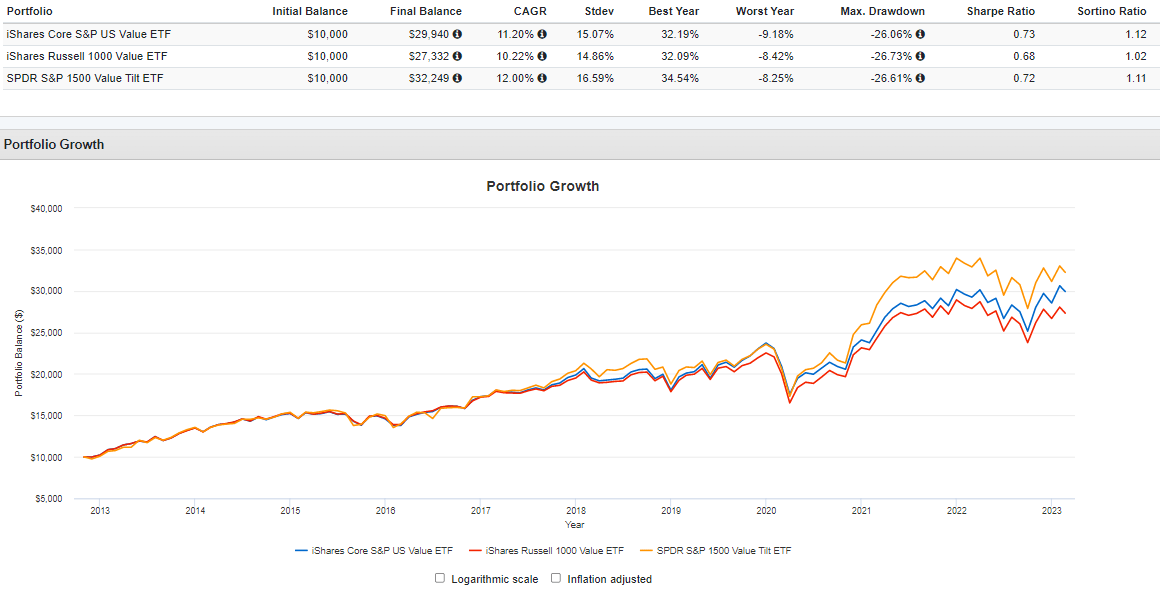
The following table compares IUSV and IWD based on rolling returns since September 2000. These results generally favor IUSV, though most outperformance occurred recently. In 2019, IUSV beat by 5% and is up another 2.5% in 2023.
Portfolio Visualizer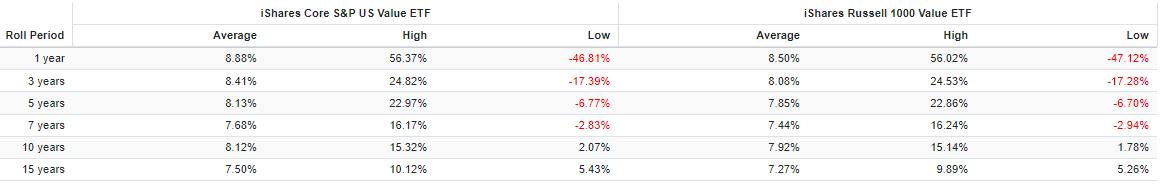
ETF Analysis
IUSV Industry Fundamentals
Historical results easily favor IUSV, but its fundamentals are weaker today. Consider the following industry fundamentals for its top 25 industries. Unlike IUSV's historical screens, these are primarily forward-looking metrics demonstrating a relatively weak growth and valuation combination.
The Sunday Investor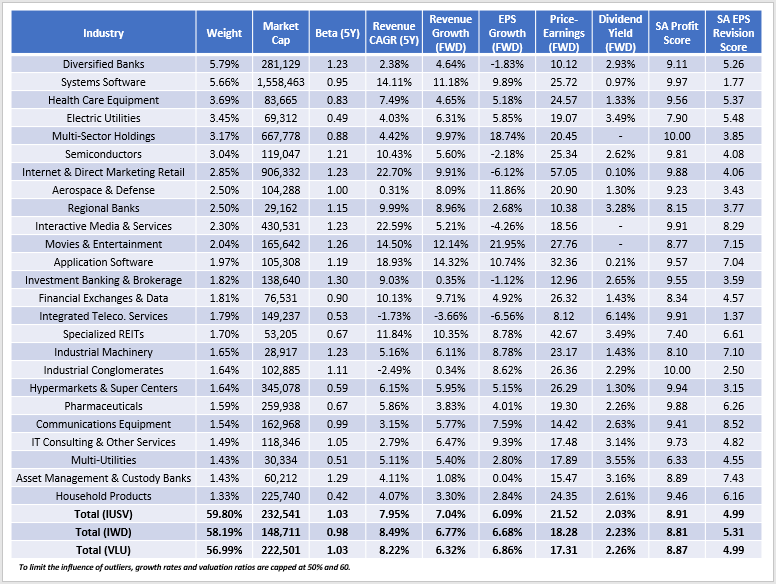
IUSV has a 1.03 five-year beta compared to 0.98 for IWD, indicating slightly higher volatility. This ETF might work well in a strong economy, but I don't anticipate that for much of the year. Vanguard projects Q4 year-over-year GDP growth of just 0.25%. The report also notes how equities "have yet to drop materially below their fair-value range," as is typical in a recession.
Vanguard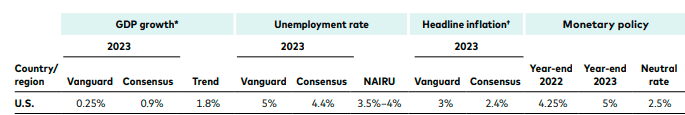
Given these projections and market uncertainty, I prefer less-volatile portfolios like IWD. Investors can reduce volatility further by investing in large-cap dividend ETFs. However, growth expectations are typically lower. I recently described how the SPDR S&P 500 High Dividend ETF (SPYD) has a negative expected earnings growth rate.
IUSV's 6.09% estimated earnings growth is lower than IWD's 6.68%, and the top five stocks it overweights are mainly responsible. Consider the following growth rates for Microsoft, Amazon, Meta Platforms, NIKE (NKE), and United Parcel Service (UPS).
Seeking Alpha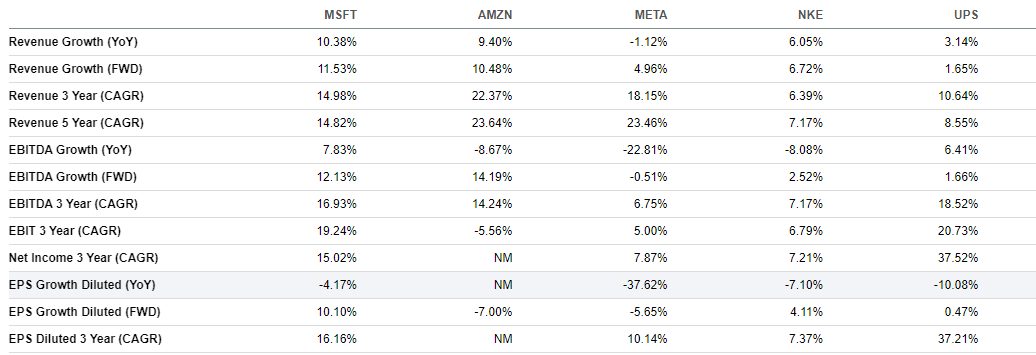
In all cases, estimated earnings growth is less than the three-year annualized rate. It's why they now qualify for IUSV, but shareholders should not accept the negative growth that Amazon and Meta Platforms feature. Besides, valuation ratios remain elevated. I'm unsure where they fall on the value/growth spectrum, but I'm uncomfortable with them representing nearly 10% of the portfolio.
Seeking Alpha
IWD Industry Fundamentals
In contrast, IWD trades at 18.28x forward earnings, 3.24 points cheaper than IUSV. Systems Software concentration, led by Microsoft, is reduced from 5.66% to 0.97%, resulting in a cheaper and more growth-oriented portfolio.
The Sunday Investor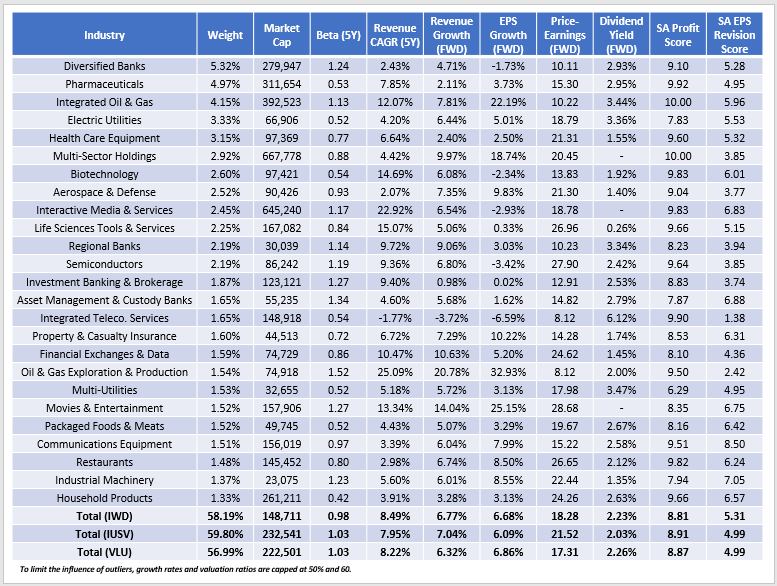
IWD overweights Exxon Mobil, Johnson & Johnson, Chevron, Pfizer, and Thermo Fisher Scientific by a combined 7.72%. Estimated growth rates are higher overall, with Pfizer as the clear outlier.
Seeking Alpha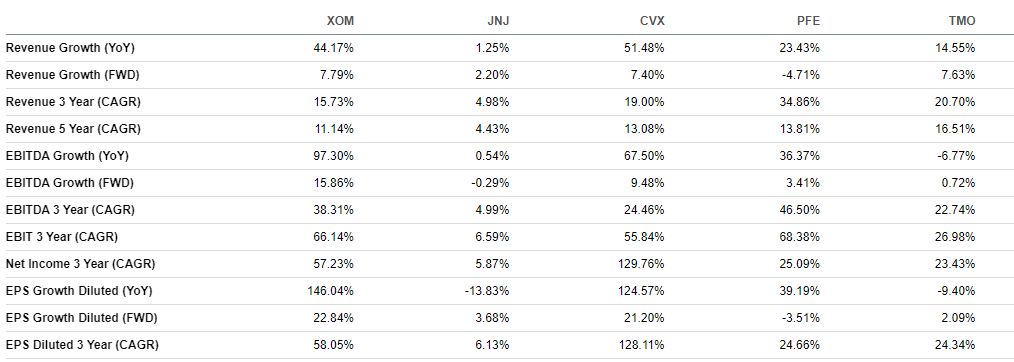
However, none are excessively overvalued, and it's easier to understand why they were selected. Exxon Mobil still trades at 10.01x forward earnings despite a 43% share price gain over the last year.
Seeking Alpha
IWD also has a slightly higher gross dividend yield (2.23% vs. 2.03%). Still, with the expense ratio difference, it should be negligible. All three ETFs have acceptable Profitability Scores, which I calculated using individual Seeking Alpha Factor Grades. Lastly, IWD's 5.31/10 EPS Revision Score gives it an edge over IUSV and VLU. I use this score as an indicator of analyst sentiment, and IWD's is higher because it excludes more Technology stocks. For example, Microsoft's latest earnings surprise was flat for the fourth consecutive quarter. We no longer see double-digit surprises that would support ultra-bullish market sentiment like in 2020, so it's best to stay disciplined and limit exposure to these types of stocks for now.
Seeking Alpha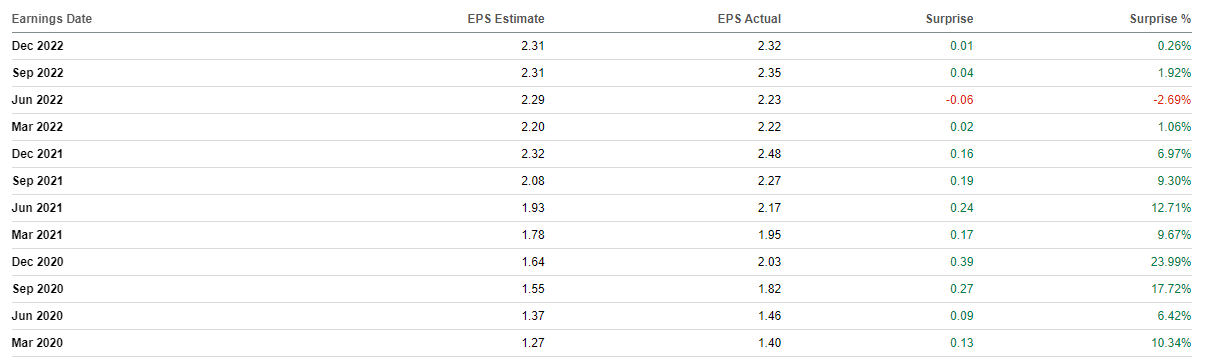
Investment Recommendation
IWD is superior to IUSV today based on its lower volatility, higher estimated earnings growth rate, cheaper valuation, and stronger earnings momentum. Undoubtedly, IUSV has a better track record, and I understand this may be considered a contrarian view. However, if we're to rely on backtested results, the least we can do is compare how each fund's current portfolio performed historically. This approach strips out the impact of Index reconstitutions and provides a better apples-to-apples comparison. I've run those simulations for numerous periods and summarized them below.
The Sunday Investor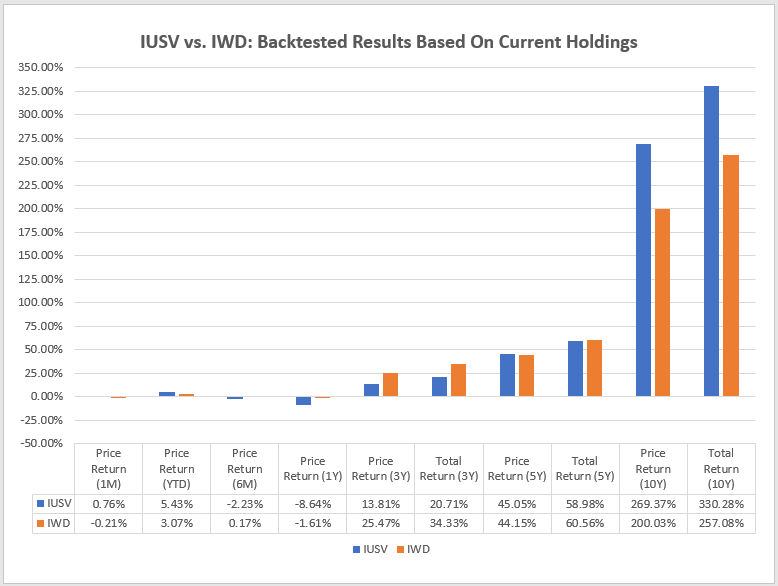
Over the last three years, IWD's current portfolio gained 34.33% vs. 20.71% for IUSV. In contrast, IUSV beat IWD by 73% in the previous ten years. The critical question is which period is more relevant. I think it's the more recent one that favors IWD, and that's supported by Vanguard's ten-year projections, weaker GDP growth estimates, and a mean reversion observation among U.S. value and growth stocks. Substantial Technology gains, which IUSV overweights, are unlikely to repeat. Therefore, IWD is not a contrarian play at all. I expect it will outperform IUSV as we advance, and I look forward to providing an update midway through the year when its Index reconstitutes.
The Sunday Investor Joins Income Builder
The Sunday Investor has teamed up with Hoya Capital to launch the premier income-focused investing service on Seeking Alpha. Members receive complete early access to our articles along with exclusive income-focused model portfolios and a comprehensive suite of tools and models to help build sustainable portfolio income targeting premium dividend yields of up to 10%.
Whether your focus is High Yield or Dividend Growth, we’ve got you covered with actionable investment research focusing on real income-producing asset classes that offer potential diversification, monthly income, capital appreciation, and inflation hedging. Start A Free 2-Week Trial Today!

This article was written by

I perform independent fundamental analysis for over 850 U.S. Equity ETFs and aim to provide you with the most comprehensive ETF coverage on Seeking Alpha. My insights into how ETFs are constructed at the industry level are unique rather than surface-level reviews that’s standard on other investment platforms. My deep-dive articles always include a set of alternative funds, and I am active in the comments section and ready to answer your questions about the ETFs you own or are considering.
My qualifications include a Certificate in Advanced Investment Advice from the Canadian Securities Institute, the completion of all educational requirements for the Chartered Investment Manager (CIM) designation, and a Bachelor of Commerce degree with a major in Accounting. In addition, I passed the CFA Level 1 Exam and am on track to become licensed to advise on options and derivatives in 2023. In November 2021, I became a contributor for the Hoya Capital Income Builder Marketplace Service and manage the "Active Equity ETF Model Portfolio", which as a total return objective. Sign up for a free trial today! Hoya Capital Income Builder.
Disclosure: I/we have a beneficial long position in the shares of BRK.B, MSFT, WMT either through stock ownership, options, or other derivatives. I wrote this article myself, and it expresses my own opinions. I am not receiving compensation for it (other than from Seeking Alpha). I have no business relationship with any company whose stock is mentioned in this article.