Buy ASPY - Bye Market Volatility

Summary
- ASPY ETF is a long/short ETF.
- ASPY positions the portfolio according to 3 risk environments.
- Returns from ASPY will diversify your portfolio beyond equity, bond and precious metal returns.
Everybody has plans until they get hit for the first time - Mike Tyson Pascal Le Segretain/Getty Images Entertainment
"Everybody has plans until they get hit for the first time" - Mike Tyson
Reactive Market Timing
Everyone appears to be a genius in a bull market.
- You analyze stocks for deep value and prices go up.
- You let your pet monkey throw darts at a board to randomly pick stocks and prices go up.
- You select the most volatile and risky small-cap stocks you can find and prices go up as if on leverage.
And then the tides turn. Those same stocks that had you out-performing the market reverse direction sharply. Your portfolio is hemorrhaging. The market is down 30% and your portfolio is down 50%! When will the pain end?
You want the agony to end. In frustration you either go to cash to wait for a market bottom or you rotate into stocks which have held up under the storm like utilities. As if on cue, the market capitulates and rebounds sharply. You watch your former high-risk stocks rocket up from their lows as your low-risk portfolio barely moves.
The above situation describes what I like to call Reactive Market Timing. The investor doesn't really plan to time the market. But because he doesn't have a well-established plan, he reacts in a knee-jerk fashion based on emotion.
The solution? Think ahead and have a plan.
Investors With Guts of Steel
One solution to this problem stems from you having already lived through a couple market crashes. You know what to expect. You anticipate that your portfolio could be cut in half. As the market drops you do nothing or possibly even buy more stock. If this is you, congratulations. You have developed an internal fortitude that few investors have.
Manage Downside Risk with Diversification?
But hold on a second… doesn't diversification manage the risk of falling prices in a bear market? If we select a variety of stocks from different sectors and from different countries, won't the winners offset the losers?
The problem is that a crashing market is like a contagion - it spreads. A severe market crash in Asia will affect America and vice versa. Diversification is most powerful in calm markets. But it loses its effectiveness when you need it the most.
Proactive Market Timing
Another solution is to have a proactive market timing plan. Wait, wait, wait! Pretty much everything you read on the subject will tell you to avoid market timing. We've all seen those diagrams where they remove the 10 worst market days as well as the best 10 market days. The conclusion is that you shouldn't try to time the market.
To which I say, sure, but only if you can look the bear straight in the eye and not flinch. If you are truly prepared to handle a drawdown of more than 50% about once a decade, then you may just want to forget about market timing. Assuming that total return is your main objective.
On the other hand, maybe your main goal isn't total return.
- You could be a new investor who cannot stomach the thought of losing half of your investment in a crash.
- Or you might be nearing the point where you will be drawing on your portfolio to supplement retirement and you do not want excessive risk taking.
In these instances, you may be willing to accept a return slightly below the market for the possibility of reducing the risk of a crashing portfolio. Which brings me back to the option of a proactive market timing plan.
How ASPY Positions for Risk
ASYMshares ASYMmetric S&P 500® ETF (NYSEARCA:ASPY) attempts to manage volatility risk by determining the level of market risk and then positioning the portfolio appropriately.
- LOW RISK = 75% Net long
- MEDIUM RISK = 0% Net exposure
- HIGH RISK = 25% Net short
The goal is to make similar returns to the market when risk is low and prices are trending up, to sit on the sidelines or possibly make non-market-based returns when risk is elevated and to make a modest gain in bear markets.
These are lofty goals and much depends on how they determine market risk.
Determining Market Risk
ASPY determines market risk is 2 ways:
- Upward trending prices
- Volatility of prices
When the market is trending down and when volatility is high it is assumed to be a bear market. When the market is trending down and volatility is low then risk is elevated. And when the market is trending up and volatility is low then risk is low.
asymshares.com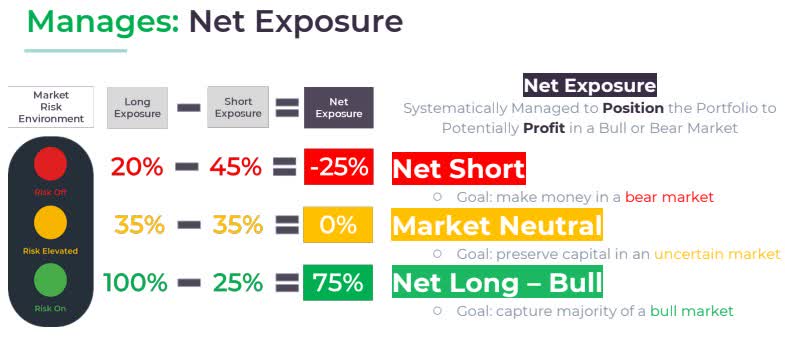
How does ASPY measure trend and volatility?
Measuring Trend and Volatility
The market trend is considered upward when market prices are above its 200-day moving average. This is a fairly common approach. How does this one rule work?
In Portfolio123, I simulate holding the five lowest volatility stocks in each sector as found in the S&P 500 index provided that the market is above its 200-day moving average. Using just one of the two market risk rules and toggling between 100% invested or 100% cash I get this backtest.
portfolio123.com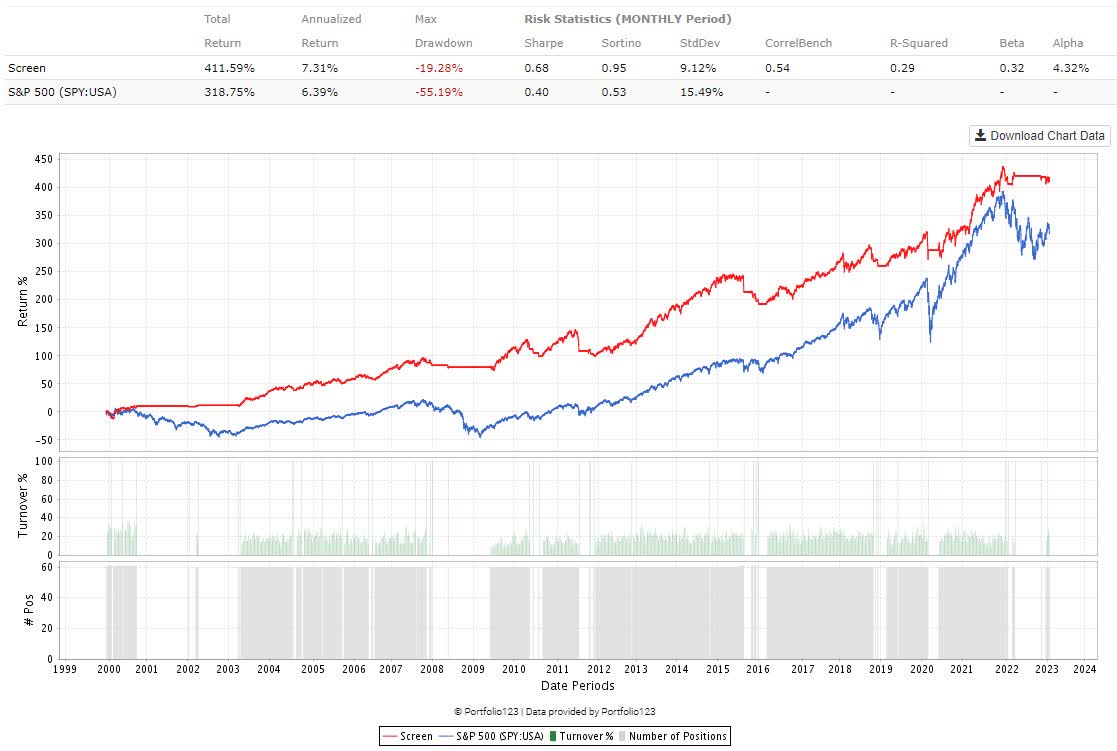
What about the second measure? This is a proprietary measure that looks at price dispersion. When the recent volatility is high, market risk is high. Volatility in this instance is measure by looking at trailing 30-day price dispersion. That this means is that they look at the average dispersion of prices from the mean. When there is high dispersion in the recent period, the risk is elevated.
asymshares.com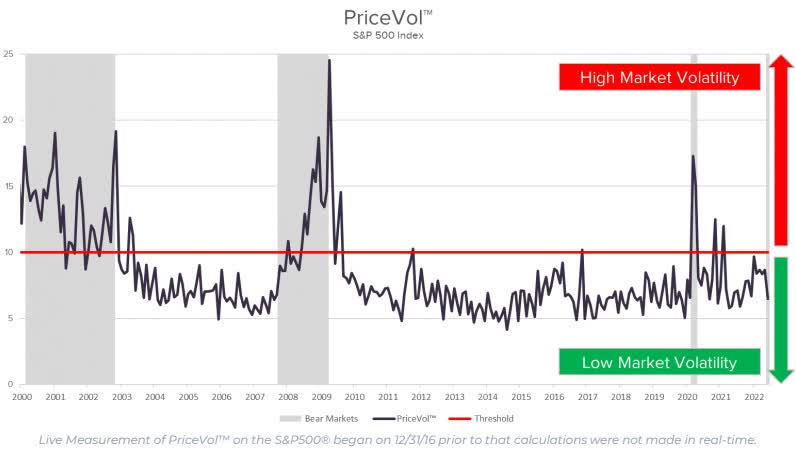
I believe this to work because when risk is high, there will be a large gap between recent returns in high risk and low risk securities. People will sell the one and buy the other. This can occur in steep market declines or at market bottoms.
The PriceVol indicator further separates these two by looking at skew. If volatility is high and the average short-term relative return is positive, this is more likely a volatile rally such as after the market bottoms. If volatility is high and the skew is negative, this likely means we are in a bear market.
This is a simulation where I attempt to replicate one part of the PriceVol indictor that will invest in low volatility stocks when market dispersion is low. I don't attempt to account for positive or negative skew.
asymshares.com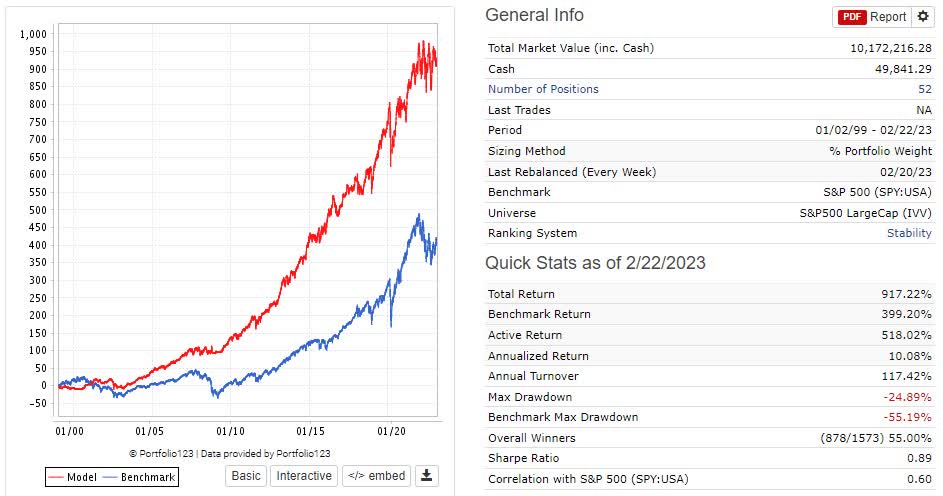
As you can see, this is quite good at identifying lower risk investing periods.
And what is the possibility when we combine these two risk indicators with a portfolio of low volatility stocks and dynamic weighting based on market conditions? Let's look at the index for that answer.
Analyzing the ASPY Index
The ASPY ETF passively follows the ASYMmetric 500 index. Keep in mind that when discussing the index, we need to acknowledge that it doesn't represent a live track record. An index can be built using in-sample data. For a live track record we need to refer to the ETF. Portions of the index will show us a simulated return of the strategy, or a backtest. As well, the PriceVol indicator only began to be measured live starting on December 31, 2016. You may think of the index as what the ETF hopes to accomplish whereas the ETF performance is what the fund is actually doing going forward.
After that disclaimer, let us have a look at the ASPY index since the end of 1999 versus the S&P 500 index.
asymshares.com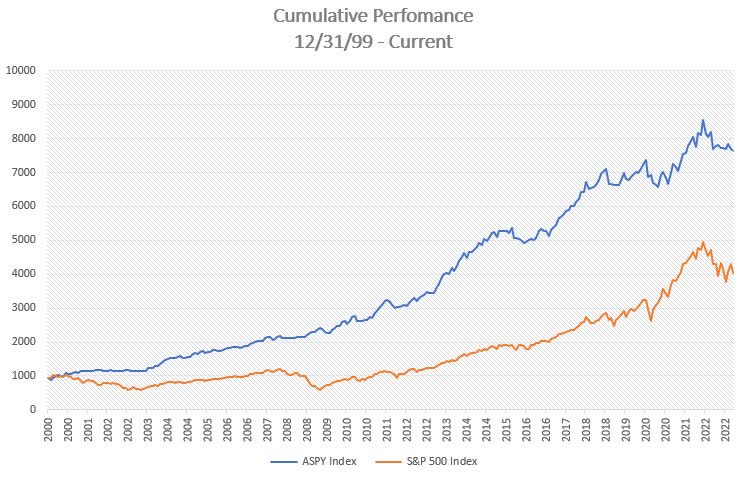
The return profile since the end of 1999 is quite strong. I sure hope that future returns are similar to the index.
My Overall Take
As a whole, I really like this ETF. You are getting a very sophisticated and dynamic strategy for a very reasonable fee. I am very pleased to see hedge-fund-like systems starting to be offered to retail investors at a fraction of the cost and with no lock-up period.
Will this strategy always work? No. I have not found any system that does. There are risks to any strategy as I will outline below. But the advantage of this ETF is that it uses an intelligent methodology which has worked historically to reduce risk of a crashing portfolio in a bear market. It should provide you with diversified returns beyond what you could get with bonds, equity and gold.
I really like the idea of lowering your market exposure when risk is high. Yet you can still generate returns in markets with elevated risk due to factor spreads, or the difference between the low volatility premium and the broad market. In bear markets you can generate returns on the low volatility premium plus a small bet on market direction.
asymshares.com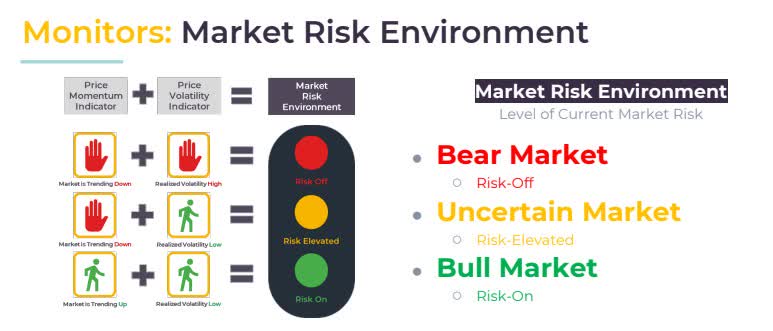
My recommendation would be to pair an ETF such as this with other ETFs like TACK, AZTD and DEEP so that you are not putting all your eggs in one strategy basket.
Now some people will point out the low AUM as a risk factor. I don't agree. Fees are higher on these sophisticated ETFs so that they do not need as much AUM to be profitable. And even if an ETF does delist in the future, you generally don't receive any big losses as the underlying positions are sold and your capital returned. It isn't like when a stock delists and the price crashes. The biggest risk if the ETF delists is that you have the burden of redeploying capital in another strategy.
Some Risks to Consider
Of course, it would be prudent to consider some of the risks.
There is a risk that markets will behave much differently in the future. Market volatility and moving averages may not capture and describe volatility risk going forward. You may hedge or go short at the wrong times which could reduce gains and exacerbate losses.
There is a risk of having below market returns when holding low volatility stocks immediately following a bear market. Low volatility stocks typically do not go up as much as riskier stocks in the early stage of a market recovery.
The long book in the fund weights the sectors the same as the S&P 500. This may or may not be optimal from a risk point of view. Although I believe they are doing it to mirror the S&P 500 as closely as they can while focusing on the lower risk stocks within each sector.
Final Thought
A dynamic long/short fund with relatively low fees is a most welcome sight in a sea of plain vanilla ETFs. This fund isn't for everyone. If markets rebound sharply from here, it may not earn as much as the broad market. But if markets drop, it will also not lose nearly as much. That's the point of this fund. And after the initial recovery, I expect low volatility holdings to gain more steam. This ETF will likely be suitable for investors who want to invest but are nervous about the ever changing risk-to-reward profile of the market. It is a fund I will be investing in shortly.
This article was written by

Disclosure: I/we have no stock, option or similar derivative position in any of the companies mentioned, and no plans to initiate any such positions within the next 72 hours. I wrote this article myself, and it expresses my own opinions. I am not receiving compensation for it (other than from Seeking Alpha). I have no business relationship with any company whose stock is mentioned in this article.