Alphyn Capital Management Q3 2022 Letter To Investors

Summary
- Alphyn Capital Management LLC (“ACML”) is a registered investment advisor in New York. We help clients invest in high quality public companies to both preserve and grow their wealth over the long-term.
- The Master Account returned 20.4% net in Q4 2022 vs 7.6% for the S&P500.
- While I cannot predict future performance, I will continue to act with patience and discipline: to buy undervalued assets and hold onto them as they compound over time.
Wasan Tita
Performance
As reported by our fund administrator, the Master Account, in which I am personally invested alongside SMA clients, returned 20.4% net in Q4 2022 vs 7.6% for the S&P500. As of December 31, 2022, the top ten positions comprised approximately 78% of the portfolio, and the portfolio held approximately 1% in cash.
QTD | 1-year | 3-years | Inception | |
ACML | 20.4% | -20.8% | -1.9% | 2.9% |
S&P500 TR | 7.6% | -18.1% | 7.6% | 13.2% |
| ACML performance is net of fees and standard costs. |
Some optimism following a strong quarter
The portfolio strongly rebounded this quarter, a positive end to a challenging year.
As you know, I believe in long-term results and do not read too much into any quarter-to-quarter performance. If anything, the quarter is a good reminder not to overtrade the portfolio or try to time the market. Imagine the anguish we would have felt had we decided to “cut some losses” earlier in the year and missed out on the 4th quarter performance.
I remain optimistic about our portfolio (and committed! I still have the vast majority of my own money in the strategy) and will explain why in this letter.
One of the biggest challenges of value investing is the negative emotional biases that can make it difficult to stay the course when facing losses. But some underperformance is to be expected. As Joel Greenblatt says, even the top performing managers underperform for years at a time. His studies showed that 97 percent of those with the best 10-year record spent at least three of those ten years in the bottom half of performance. In addition, 79% of the top performers had at least three years in the bottom quartile of performance, and 47% of those with the best 10-year record spent at least three years in the bottom 10 percent.
While I cannot predict future performance, I will continue to act with patience and discipline: to buy undervalued assets and hold onto them as they compound over time. This requires a long-term perspective and the ability to weather short-term market fluctuations and periods of underperformance.
Our top performers neatly encapsulated Alphyn’s barbell strategy. On the one hand, a couple of “high skew” investments had a material impact on the portfolio as the investment theses began to play out. Though riskier, these companies have the chance to gain value rapidly if or when their investment thesis begin to play out as happened this quarter. I’ll discuss the specifics in the next section of this letter.
On the other hand, some of our public Holdcos, a mainstay of the portfolio, continued to execute their long-term business plans. I view these Holdcos as "junior Berkshires" - diversified businesses run by outstanding capital allocators and business builders, with "synthetic leverage" but at earlier stages of their development. Accordingly, it makes sense to refresh our memories about their investment merits. To do so, I will borrow from Warren Buffett’s excellent 2014 letter on the benefits of “conglomerates.” When managed well, they:
- Allow for the movement of capital from businesses with limited investment opportunities to those with greater promise,
- Without incurring taxes or other costs that individual investors would typically feel,
- While reducing obstacles to the redeployment of capital as conglomerates allocators are “not bound by historical biases or pressures from colleagues with a vested interest in maintaining the status quo, allowing for more objective decision-making.”
- Moreover, conglomerates can purchase shares in public companies, which, as Mr. Buffett explains, is “not an option for most companies, but it has proved beneficial for Berkshire. It allows the company to consider a broad range of options and to realize gains from marketable securities that can be used to make large acquisitions that would otherwise be beyond its financial capabilities. Essentially, the world is open to Berkshire, with a range of opportunities far beyond those available to most companies.”
The key is to know which "conglomerates” are run by capable, shareholder-friendly business builders and allocators. And while I acknowledge there is only one Berkshire and one Mr. Buffett in the world, I am very happy with the companies we own.
For the detractors – this was mostly a reversal of all the things that were appealing to the market over the last couple of years – the 2 “FAAMG” companies we own are (I believe temporarily) out of favor. Markets go through cycles, and even the best businesses will have periods of underperformance. Some of our smaller tech-growth companies continue to be punished; fortunately, we own them in a relatively smaller size.
Overall, the price declines in 2022 took some of the froth out of the market, which is painful but healthy. In my opinion, our companies are robust, conservatively valued, and have good prospects.
Portfolio – top and bottom performers1
Top Performers | Contribution | Bottom Performers | Contribution | |
WANdisco Plc | 10.5% | Amazon Inc | -1.3% | |
Exor Nv | 3.2% | IAC Inc | -0.7% | |
Fairfax Financial Ltd | 2.6% | Brookfield Corp | -0.5% | |
Alvotech Sa | 1.1% | Wayfair Inc | -0.4% | |
VanEck Gold Miners ETF | 0.8% | Alphabet Inc | -0.3% |
| As calculated in the Master Account brokerage statement. |
WANdisco (OTCPK:WANSF)
WANdisco continues to announce strong revenue growth, with several significant contracts. This growth has been reflected in the stock, which has rallied following three recent announcements. The first announcement includes a follow-on contract worth $13.2 million with a large European automotive components supplier, bringing the combined value of the three agreements to $25.3 million. The second announcement includes a deal worth $31 million with a second tier-1 global telecommunications supplier, highlighting the company’s ability to migrate large scale data from edge platforms to the cloud without requiring any system downtime. Finally, the third announcement includes a Commit-to-Consume agreement worth $5 million with a large global software company, demonstrating continued demand for WANdisco’s solutions in the software industry.
The company has identified the transport and telecommunications industries as key verticals with their need for large-scale sensor and telematics data transfers. Furthermore, these contracts open up opportunities for follow-on deals as clients’ data needs grow.
Exor (OTCPK:EXXRF)
Exor presented an update at its investor day in November. Several exciting things are going on under the hood. The core holdings (Ferrari, Stellantis, CNH) posted solid 20%+ revenue gains. Management also reiterated their focus on investing in three segments, Healthcare (non-cyclical, structural tailwinds), luxury (resilient with demographic tailwinds), and technology. Most interesting were the details of the reorganization of Exor’s investment activities into a new asset management company, Lingotto. The asset manager will have $2.5bn of AUM, with a mandate to invest in public and private companies. The 20-person team will be led by Matteo Solari on the public side, a veteran of the hedge fund Eton Park, and Nikhil Srinivasan, who previously saw over $500bn in AUM as Chief Investment Officer at numerous insurance companies. Lingotto is currently funded by Exor Covéa, to which Exor sold its insurance business ParnerRe, but will be open to outside capital in the future. Like some of our other holdings, such as KKR and Brookfield, Exor will benefit from the dual compounding of investing its balance sheet (with €6.5bn to deploy) and third-party capital.
Fairfax (OTCPK:FRFHF)
Fairfax shares have remained flat over five years despite this quarter's solid share price performance. I had a conversation with someone in the company's investor relations department and asked what feedback they might be getting from investors regarding the medium-term share price performance. Were investors still upset with the company for the expensive and ill-timed macro hedges from years ago? His response was interesting: growth investors are attracted to different companies during boom times, and deep value investors look for badly beaten down companies that could rebound aggressively. Unfortunately, Fairfax doesn't easily fit into either of those categories and has largely been ignored for the last few years.
I read a report recently that described Fairfax as a "non-obvious growth stock," and I think the description is appropriate. From looking at the share price over the last five years, you would not know that Fairfax has been executing on several metrics. Consider that Fairfax's "gross premiums written" per share has compounded almost 18% from 2015-2021. It grew a further 19% in the first nine months of 2023). The insurance business is, of course, the engine of Fairfax's growth. With Fairfax's disciplined underwriting, insurance has averaged 2% profit for the last five years. Insurance also generates float, which the company reinvests. Float per share has grown 7% a year from 2017-2022, and Fairfax's investment portfolio has, in turn, increased from just under $28bn in 2015 to $51.5bn as of Q3 2021. As Fairfax generates a total return of approximately 5.7% on its investments, on a simplified calculation, we can see how this process has led to an additional $1.3bn in profits for the company. As a result, Fairfax's book value per share has grown by over 13% per year for the last six years. When one also considers the company's capital allocation, such as the sale of its pet insurance business which added $42/share gain on sale, buybacks, and the opportunity for increased profitability in the bond portfolio from higher interest rates, and growth from improving the operations of some of its privately held businesses, it has plenty of opportunity to continue compounding at faster rates. The share price should eventually catch up with the company's underlying economics.
Alvotech (ALVO)
Alvotech is one of our “high-skew” names, accounting for a smaller allocation to a slightly more “speculative” name, but one I still believe has significant potential. The company had developed a lower cost biosimilar drug to Humira, the world’s best-selling pharmaceutical product with $20bn in annual sales. Revenues and profits from this one biosimilar could be very significant for Alvotech, even if they only capture a single-digit percentage of the $20bn market.
Unfortunately, the company suffered what I consider an “own goal” when it failed to pass a routine site inspection by the US Food and Drug Administration. Unsurprisingly this harmed the share price, so on December 1st, founder Robert Wessman took over the CEO role. I would expect a successful 3-time founder such as Mr. Wessman will ensure the facilities are up to scratch for the re-inspection.
However, there was some good news on December 22nd, when the FDA confirmed it would reinspect the facilities Q1 2023, following which full approval is expected, with a commercial launch in the US on July 1st, 2033. The stock price has since rallied.
VanEck Gold Miners ETF (GDX)
Our exposure to gold is a hedge against potential monetary debasement and political brinkmanship. A sustained rally in gold would be very positive for the gold miners, who have cleaned up their balance sheets. Beyond noting the correlation between a weakening US dollar from November onwards, there is limited benefit to commenting too much on quarterly gyrations.
Amazon (AMZN)
I read an excellent analysis of Amazon’s retail margins published by In Practise – a primary research service that puts out high quality, well researched interview transcripts with former employees of public companies.
Their analysis delved into Amazon’s retail business, an area of concern for investors. Many worry that the segment will never be profitable and that without AWS, Amazon, after 20+ years, still cannot make money in retail. Recent increases in capital expenditure and the resulting decline in quarterly free cash flow have amplified these concerns. Furthermore, Amazon’s public financial reporting obscures some details and makes it difficult to estimate the actual margins of the retail business.
In Practise interviewed a former executive at the company responsible for collating financial reports for Brian Orlovsky, Amazon’s CFO, and asked him to estimate some cost allocations between the different divisions to arrive at a “retail business only” profit and loss estimates. (Shown below with permission).
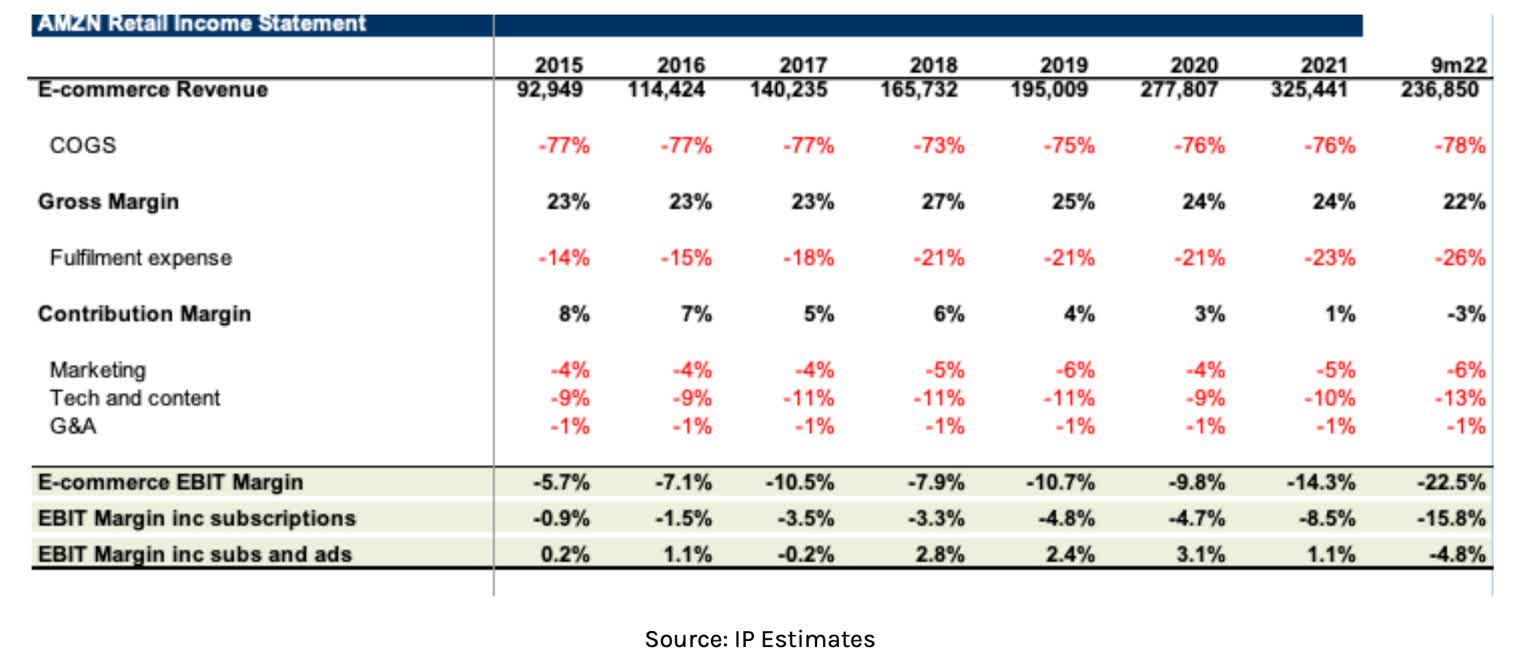
A few things become clear from the table. First, e-commerce revenue has grown substantially from $93bn in 2015 to $237bn for nine months of 2022, and gross margins have been remarkably consistent in the high 70’s.
Second, Fulfilment expenses have increased tremendously, from 14% of revenues in 2015, to 26% in 2022. That is approximately a 6-fold increase in dollar terms. As a result, the contribution margin, or the profit on each item sold, has gone from 8% profit to 3% loss.
So, it seems that Amazon loses money for every order, even before including marketing, technology, and general and administrative costs. On the face of it, a sorry state of affairs.
Amazon’s true e-commerce profitability has been obscured by aggressive growth investments, and normalizing for these, the underlying operations are profitable. In particular, Amazon has invested well ahead of demand to grow fulfillment operations, especially with initiatives such as 2-day and then 1-day shipping. In addition, the post-Covid e-commerce slowdown, well documented in the financial media, caught Amazon off-guard and exacerbated the situation. (Even Amazon can’t predict the future perfectly!). Moreover, Tech and Content expenditures have grown from 9% of sales to 13% of sales. One interesting fact from the expert interviews was that 15-20% of tech costs are for “venture type” investments that are lossmaking. Somewhat similar to how Alphabet throws billions into its “moonshot” investments.
Suppose Amazon were to slow down fulfillment expenditure to be more aligned with 2018 levels (before the rapid scaling of cost and introduction of faster shipping) and cut out the “moonshot-like” lossmaking technology investments. In that case, it could add approximately $20bn to cash flow, resulting in low-to-mid single-digit EBIT margins, in line with highly respected retail stalwarts Costco and Walmart.
Few companies could turn on that kind of cash flow almost at will.
The thesis on Amazon is that they are investing, on the one hand, in becoming the “rails” of e-commerce, with logistics and fulfillment operations that have surpassed those of FedEx in size. On the other hand, Amazon Prime subscriptions attract consumers who want to receive free 2-day shipping and additional services such as movies and other content. The combination of the two ads to Amazon’s famous marketplace “flywheel,” where sellers are attracted to the access to consumers as well as all the logistics/fulfillment, and consumers are attracted to the range of merchandise, as well as fast shipping. Amazon continues to invest in its powerful moat.
IAC
Most of what I wrote about IAC in the third quarter letter remains applicable: the DotDash-Meredith merger is tracking behind expectations partly because of the more difficult advertising environment, partly because of a few hiccups with the integration, which should be largely behind the company. Moreover, IAC released encouraging data showing that as they migrate former Meredith internet properties to the DotDash platform, traffic initially takes a hit before eventually returning to solid growth and surpassing prior levels from the 6-month mark onwards. On this basis, they are optimistic for the second half of 2023. It is too early to tell how Mr. Levin’s direct leadership of Angi has improved performance, and I will monitor it going forward. In the meantime, MGM continues to be a solid investment for IAC, and there have been hints that under IAC’s ownership, some of the private and earlier stage companies are doing well. E.g., Care.com has grown revenues by 70% since IAC acquired it.
Brookfield (BAM)
On December 9th Brookfield spun out its management company, which takes the “Brookfield Asset Management” name and BAM ticker. BAM is an “asset lite” alternatives manager, which means that it invests fee money raised from external investors instead of its own balance sheet cash, on which it charges both management and performance fees. BAM has approximately $400bn in Fee Paying Assets Under Management and is set to grow its AUM, and therefore its fees and earnings, by around 20% per annum for the next few years, with most already contracted out. In addition, BAM is well positioned for the current interest rate environment: approximately 60% of BAMs funds invest in real assets (for example, real estate, infrastructure, and clean energy), and about 25% in credit (drawing on subsidiary Oaktree’s expertise in distressed credit, which could benefit from less benign interest rates). The spin, therefore, is an effort to “unlock value” by highlighting BAM’s attractive financials and growth prospects, hopefully leading to a valuation uplift. Asset lite alternative managers with similar financial characteristics trade for 20x P/E vs. 10-12x for “asset heavy” competitors. The parent company, now called Brookfield Corp and with ticker BN, should benefit from this revaluation, too, as it owns 75% of BAM.
It is tempting to try and devise clever ways to arbitrage the valuation discrepancy between BN, given its discount to net asset value, and BAM. The asset manager BAM is attractive because it can benefit from faster growth (fees should grow in line with AUM growth). Yet, there is more scope for capital allocation with BN. Firstly, BN can invest its share of profits from BAM in its balance sheet investments. This dual compounding should add up to significant growth, even if, in the short term, the market does not attribute extraordinarily high multiples to “asset heavy” businesses. Second, BN can buy back shares whenever the company is undervalued. Finally, I think it usually pays to ride along with Mr. Flatt and co. as they take advantage of wild mispricings. For example, as recently as April 2021, Brookfield took Brookfield Property Partners private for approximately $18/share after the price had fallen from roughly $26/share as the market worried about the potential impact of Covid and work-from-home on the rental income from its commercial real estate. So, I am happy to own both shares following the distribution.
Wayfair (W)
As I have mentioned a few times in these letters, I mistimed buying Wayfair shares, as I misjudged the extent of the “revenue pull forward.” In other words, people stuck at home during covid lockdowns spent more than they usually would on stuff for their homes, and this trend reversed sharply in 2021/2. Given the steep decline in Wayfair’s price, I decided to tax loss harvest, reentering the position following a full 30 days to ensure we did not fall foul of the wash rule.
As I wrote in my Q2 2022 letter, “I will be looking for evidence of better operational controls over the next few quarters.” There has not been a tremendous amount of information so far; however, on November 29, the company released a trading update for the Thanksgiving Day through Cyber Monday 5-day peak shopping period, disclosing “a low single-digit sales increase in the US compared to the same period in 2021.” Price promotions drove the sales, funded by vendors, as Wayfair holds little inventory itself. The promotions, therefore, have little impact on Wayfair’s gross margins. Management has received the message from investors on reigning in costs and profitability, an area entirely within their control and focused on sales growth.[1] As sales normalize over the next 12 years, following an unusual period in home goods retailing, Wayfair should receive its fair share of the market given its attractive customer proposition: wide selection, in-stock availability, and fast delivery, given its significant investment in logistics. The company trades at a little under 0.5x sales, so it shouldn’t take much to recover.
Alphabet (GOOG, GOOGL)
Alphabet received an open activist letter from TCI Fund on November 15, 2022.[2] The letter called out that Alphabet has too many highly paid employees. They suggest that Alphabet establish and publicly disclose an EBIT margin target for the Google Services segment and that management compensation should be linked to this target to ensure accountability. They also asked Alphabet to reduce annual operating losses in its “Other Bets” division, which includes Waymo (self-driving cars), and increase share buybacks, given $116bn cash on the balance sheet and relatively low valuation (16x P/E normalized for “other bets losses”).[3]
The letter from TCI Fund highlights the need for accountability and efficient capital allocation at Alphabet. While I agree with the letter’s suggestions, tech companies must balance economics with investing for the future. For example, in November 2022, a company called OpenAI released a program called ChatGPT, which has received a lot of interest. This computer program can understand and respond to natural language, like how people speak and write. It uses advanced machine learning techniques to generate human-like text based on the input it receives. Interacting with ChatGPT is quite remarkable – one feels like they are texting with a human, and watching the program write entire articles based on a few short prompts is impressive. This kind of technology is not entirely new, many companies, Alphabet included, have been developing versions for some years. What surprised observers was the speed with which ChatGPT caught the public’s imagination, and the many use cases teams of people are working on using the technology.
Ultimately, from Google’s perspective, the fear is this technology could eventually change online search. For example, if people find direct answers to their questions in a text chat, they may not need to click on links to other websites. Without the need for links, there are fewer opportunities to click on ad links. Digital ads account for more than 80 percent of Alphabet’s revenue, so this could be a potential challenge for the company if they do not respond with initiative. So while Alphabet has its own AI, LaMDA, which is reputedly more capable, the sense is the company has been caught somewhat flat footed. It is up to Alphabet to now integrate this new technology into future versions of its search. It certainly has the head start and platform to do so.
Portfolio – other changes
Trades in the last quarter were mainly driven by tax loss harvesting (switching between and consolidating Prosus-Naspers, harvesting then re-entering Wayfair after 30 days), and some rebalancing of the portfolio.
Samer Hakoura
Alphyn Capital Management, LLC
DisclaimerAlphyn Capital Management, LLC is a state registered investment adviser. The description herein of the approach of Alphyn Capital Management, LLC and the targeted characteristics of its strategies and investments is based on current expectations and should not be considered definitive or a guarantee that the approaches, strategies, and investment portfolio will, in fact, possess these characteristics. Past performance of specific investment advice should not be relied upon without knowledge of certain circumstances of market events, nature and timing of the investments and relevant constraints of the investment. Alphyn Capital Management, LLC has presented information in a fair and balanced manner. Alphyn Capital Management, LLC is not giving tax, legal or accounting advice, consult a professional tax or legal representative if needed. Reference or comparison to an index does not imply that the portfolio will be constructed in the same way as the index or achieve returns, volatility, or other results similar to the index. Unlike indices, the model portfolio will be actively managed and may include substantially fewer and different securities than those comprising each index. Results for the model portfolio as compared to the performance of the Standard & Poor’s 500 Index (the “S&P 500”) for informational purposes only. The S&P 500 is an unmanaged market capitalization-weighted index of 500 common stocks chosen for market size, liquidity, and industry group representation to represent US equity performance. The investment program does not mirror this index and the volatility may be materially different from the volatility of the S&P 500. Performance results of the master portfolio are presented for information purposes only and reflect the impact that material economic and market factors had on the manager’s decision-making process. No representation is being made that any investor or portfolio will or is likely to achieve profits or losses similar to those shown. Results are net of all standard fees calculated at the highest rate charged, expenses and estimated incentive allocation. Model portfolio returns are inclusive of the reinvestment of dividends and other earnings, including income from new issues. The return is based on annual returns since inception and does not give effect to high water marks, if any. Returns may vary for investors who are restricted from participating in new issues. Hypothetical performance results are unaudited and do not reflect actual results of any accounts managed by Alphyn Capital Management, LLC. Hypothetical performance results are for illustrative purposes only and are not necessarily indicative of performance that would have been actually achieved if an investment utilized the strategy during the relevant periods, nor are these simulations necessarily indicative of future performance of the strategy. Inherent limitations of hypothetical performance may include: 1) hypothetical results are generally prepared with the benefit of hindsight; 2) hypothetical results do not represent the impact that material economic and market factors might have on an investment adviser's decision-making process if the adviser were actually managing client money; 3) there are numerous factors related to the markets in general, many of which cannot be fully accounted for in the preparation of hypothetical performance results and all of which may adversely affect actual investment results. There is no assurance that any of the securities discussed herein will remain in an account’s portfolio at the time you receive this report or that securities sold have not been repurchased. The securities discussed do not represent an account’s entire portfolio and, in the aggregate, may represent only a small percentage of an account’s portfolio holdings. It should not be assumed that any of the securities transactions or holdings discussed were or will prove to be profitable or that the investment recommendations or decisions we make in the future will be profitable or will equal the investment performance of the securities discussed herein. The graphs, charts and other visual aids are provided for informational purposes only. None of these graphs, charts or visual aids can and of themselves be used to make investment decisions. No representation is made that these will assist any person in making investment decisions and no graph, chart or other visual aid can capture all factors and variables required in making such decisions. This report is for informational purposes only and should not be construed as investment advice. It is not a recommendation of, or an offer to sell or solicitation of an offer to buy, any particular security, strategy or investment product. Our research for this report is based on current public information that we consider reliable, but we do not represent that the research or the report is accurate or complete, and it should not be relied on as such. Our views and opinions expressed in this report are current as of the date of this report and are subject to change. Any reproduction or other distribution of this material in whole or in part without the prior written consent of Alphyn Capital Management, LLC is prohibited. |
Footnotes1 There is no assurance that any of the securities discussed herein will remain in an account’s portfolio at the time you receive this report or that securities sold have not been repurchased. It should not be assumed that any of the securities transactions or holdings discussed were or will prove to be profitable. See “Disclaimers” at the end for more details. 2 As I was writing this letter, shortly after the quarter end management announced aggressive costs cuts, approximately $750m, and a return to “adjusted EBITDA” profitability in 2023. I personally dislike adj. EBITDA but concede it is a step in the path to true profitability. The news was well received by the market. 3 https://www.tcifund.com/files/corporateengageement/alphabet/15th%20November%202022.pdf 4 Google seems to have received the message too and announced a 6% reduction of its workforce, 12,000 people, on the same day as Wayfair |
Editor's Note: The summary bullets for this article were chosen by Seeking Alpha editors.
Editor's Note: This article discusses one or more securities that do not trade on a major U.S. exchange. Please be aware of the risks associated with these stocks.

Additional disclosure: Copyright © Alphyn Capital Management, LLC