Morgan Stanley's Focus On Wealth Management Is Working

Summary
- Morgan Stanley has rallied so far in 2023.
- The company is maintaining its emphasis on wealth and investment management.
- Declining asset-based fees have been partly offset with higher interest income.
- The Wall Street consensus rating is a buy, but the consensus 12-month price target is only 5.2% above the current share price.
- The market-implied outlook (calculated from options prices) continues to be bullish.

Nikada
Morgan Stanley (NYSE:MS) held up remarkably well over the past year, with a total return of 6.6%, as compared to -5.3% for the Financial Select Sector SPDR ETF (XLF) and -4.7% for the S&P 500 (SPY). The longer-term performance for MS is also notable, with 3-, 5-, and 10-year annualized returns of 24.0%, 14.6%, and 16.7% per year, respectively. For context, the S&P 500 has 3-, 5-, and 10-year annualized returns of 8.3%, 10.3%, and 12.5% per year.
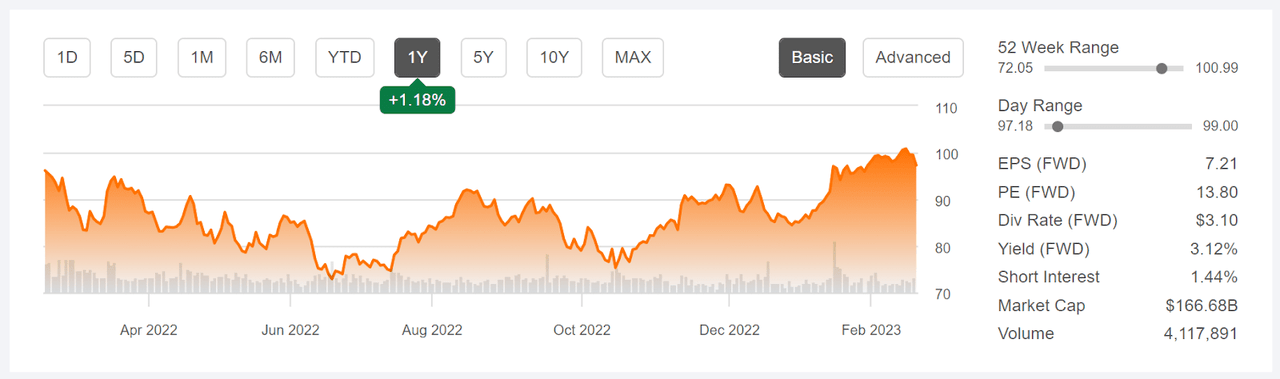
12 Month price history and basic statistics for MS (Seeking Alpha)
Morgan Stanley has 3 business segments: Institutional Securities, Wealth Management, and Investment Management. The company is focusing on Wealth Management and Investment Management as the growth engines. Wealth management is projected to continue to grow at a brisk pace (see slide 9), with increasing margins over time. The growth is partly attributable to acquisitions. MS owns ETrade, Eaton Vance, Smith Barney, Solium, and Mesa West. As a long-term ETrade user, I find the integration process to have been seamless so far. Net interest income (NII) in the wealth management business rose substantially with rising interest rates. NII in Q4 of 2022 was 52% higher than Q4 in 2021. The higher NII helped to offset lower asset-based fees that resulted from broad declines in the stock market.
MS reported Q4 2022 results on January 17, 2023, beating expectations for EPS by 5.7%. The earnings beat for Q4 has to be considered relative to the fairly low expected EPS of $1.19 per share, lower than the realized EPS in any of the previous 10 quarters. The company reports Q1 results for 2023 on April 19, 2023, with expected EPS that is 10.4% below the result from Q1 of last year. The longer-term growth outlook is muted, with a consensus outlook for EPS growth over the next 3 to 5 years of only 0.72% per year. Morgan Stanley has a Seeking Alpha Growth Grade of D-.
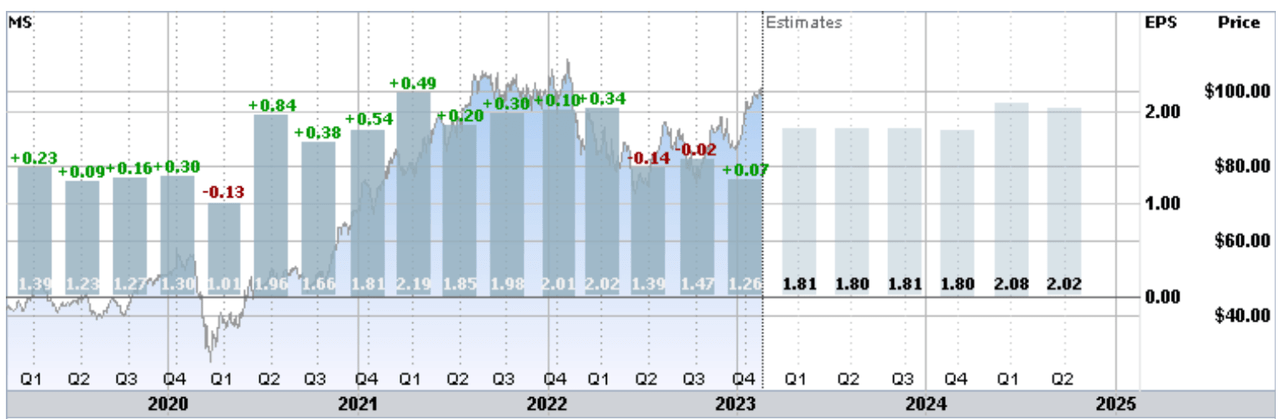
Trailing (4 years) and estimated future quarterly EPS for MS. Green (red) values are amounts by which EPS beat (missed) the consensus expected value (ETrade)
With the strong share gains in recent months, valuation is worth monitoring. The forward and TTM P/E ratios are 13.8 and 15.5, respectively. These values are quite high compared to the past 5 years.
The forward dividend yield of 3.1%, buybacks (adding 6% in return in 2022), and very high dividend growth rates over the past 10 years show management’s commitment to returning cash to shareholders.
I last wrote about MS on April 12, 2022, at which time the shares were trading at about $84.50, and I maintained a buy rating. From the closing price on that date, MS has returned a total of 21.9% as compared to -7.2% for the S&P 500 (SPY) and -2.1% for the Financial Select Sector SPDR ETF (XLF). At that time, the Wall Street consensus rating on MS was a buy. Largely as a result of a substantial drop in share price early in 2022, the consensus 12-month price target corresponded to about 30% total return over the next year. The TTM P/E was a very reasonable 10.5 and the dividend yield was 3.3%. The market-implied outlook, a probabilistic price forecast that represents the consensus view from the options market, was bullish to mid-June of 2022 and slightly bullish to mid-January of 2023, with expected volatility of 36% (annualized). As a rule of thumb for a buy rating, I want to see an expected total return that is at least ½ the expected volatility. The Wall Street consensus price target corresponded to an expected return far above this threshold. Maintaining a buy rating was a straightforward decision.
For readers who are unfamiliar with the market-implied outlook, a brief explanation is needed. The price of an option on a stock reflects the market’s consensus estimate of the probability that the stock price will rise above (call option) or fall below (put option) a specific level (the option strike price) between now and when the option expires. By analyzing the prices of call and put options at a range of strike prices, all with the same expiration date, it is possible to calculate the probable price forecast that reconciles the options prices. This is the market-implied outlook and represents the consensus view among buyers and sellers of options. For a deeper discussion than is provided here and in the previous link, I recommend this outstanding monograph published by the CFA Institute.
I have calculated an updated market-implied outlook for MS and I have compared this with the current Wall Street consensus outlook in revisiting my rating.
Wall Street Consensus Outlook for MS
Seeking Alpha calculates the Wall Street consensus outlook for MS by aggregating the views of 27 analysts who have published ratings and price targets over the past 90 days. The consensus rating is a buy, as it has been for all of the past 3 years. The consensus price target is 5.2% above the current share price, corresponding to 8.3% expected total return. The recent rally has resulted in little remaining upside over the next year.
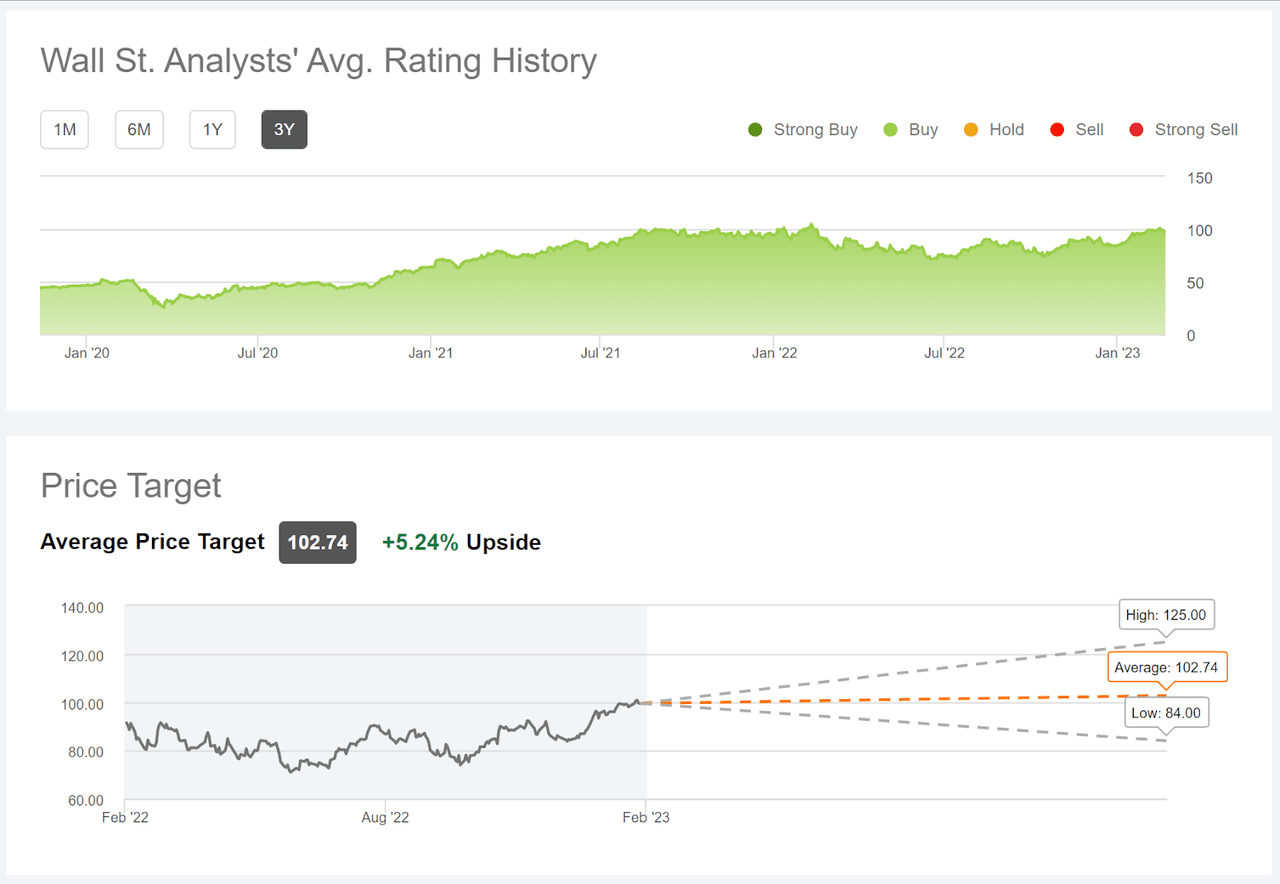
Wall Street analyst consensus rating and 12-month price target for MS (Seeking Alpha)
The bullish consensus rating over the past 3 years, a period over which MS has returned 24.0% per year, is encouraging. In addition, the spread in the individual analyst price targets is not too high, indicating some consistency.
Market-Implied Outlook for MS
I have calculated the market-implied outlook for MS for the 3.8-month period from now until June 16, 2023 and for the 11-month period from now until January 19, 2024, using the prices of call and put options that expire on these dates. I selected these specific expiration dates to provide a view to the middle of 2023 and through the entire year.
The standard presentation of the market-implied outlook is a probability distribution of price return, with probability on the vertical axis and return on the horizontal.
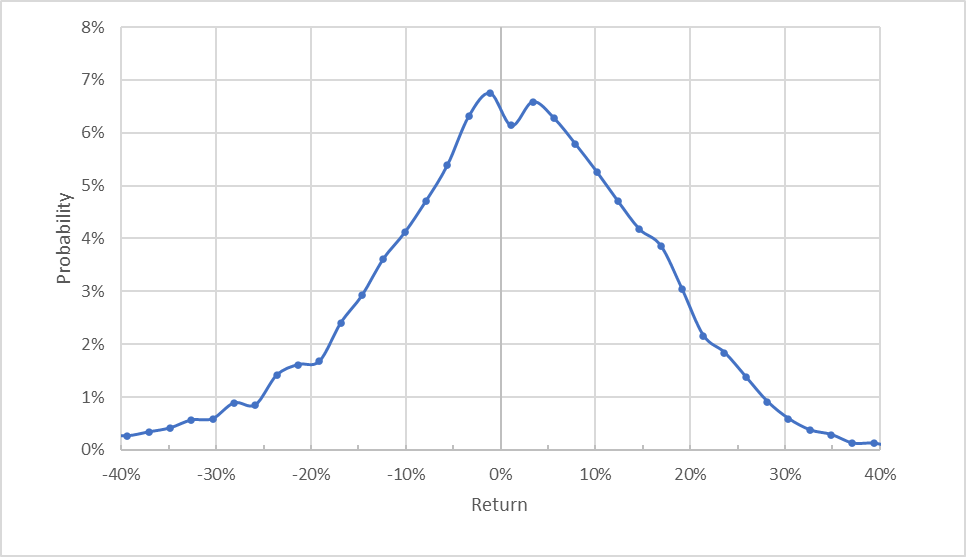
Market-implied price return probabilities for MS for the 3.8-month period from now until June 16, 2023 (Author's calculations using options quotes from ETrade)
The market-implied outlook to the middle of 2023 is generally centered around 0% return, but the shape of the distribution is tilted to favor positive returns. Compare, for example, the probability of having a return of +10% to the probability of a -10% return. This shift in probabilities suggests a bullish outlook from the options market. The expected volatility calculated from this distribution is 27.4% (annualized). For comparison, ETrade calculates an implied volatility of 25% for the options on MS expiring on June 16th. The expected volatility for MS has fallen since my previous post.
To make it easier to compare the relative probabilities of positive and negative returns, I rotate the negative return side of the distribution about the vertical axis (see chart below).

Market-implied price return probabilities for MS for the 3.8-month period from now until June 16, 2023. The negative return side of the distribution has been rotated about the vertical axis (Author's calculations using options quotes from ETrade)
This view shows that the probabilities of positive returns are consistently higher than those of negative returns of the same size, across a wide range of the most-probable outcomes (the solid blue line is above the dashed red line over almost all of the left ¾ of the chart above). This asymmetry in probabilities corresponds to a bullish outlook.
Theory indicates that the market-implied outlook is expected to have a negative bias because investors, in aggregate, are risk averse and thus tend to pay more than fair value for downside protection. There is no way to measure the magnitude of this bias, or whether it is even present, however. The expectation of a negative bias reinforces the bullish interpretation of this outlook.
The market-implied outlook for the next 11 months is also bullish, with consistently elevated probabilities of positive vs. negative returns (the solid blue line is above the dashed red line over almost the entirety of the chart below). The expected volatility calculated from this distribution is 27.5% (28.8% annualized).
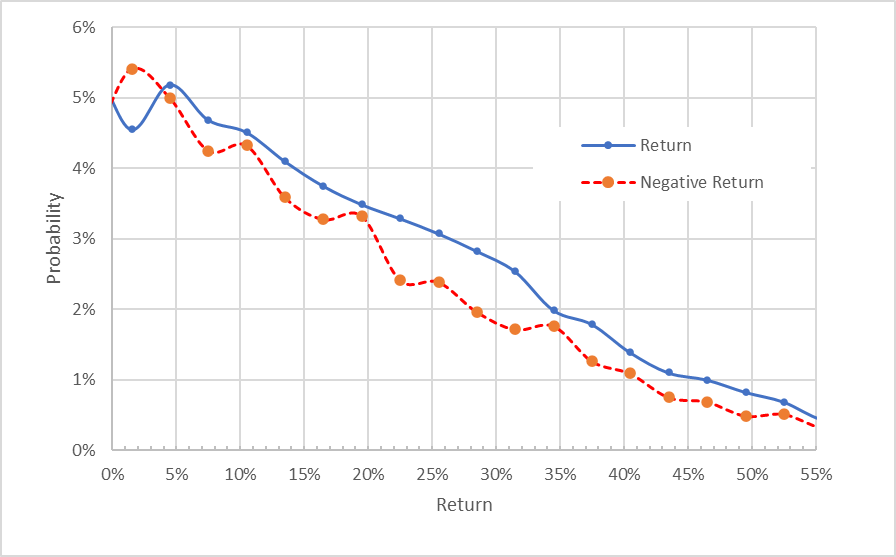
Market-implied price return probabilities for MS for the 11-month period from now until January 19, 2024. The negative return side of the distribution has been rotated about the vertical axis (Author's calculations using options quotes from ETrade)
Particularly given the very limited expected upside potential from the Wall Street consensus price target, selling covered calls is worth considering. As I have been writing this post, I purchased shares of MS for $98.47 and sold call options with a strike of $100, expiring on January 10, 2024, for $10.54. The net position has option premium income yield of 10.7% ($10.54 / $98.47), in addition to expected dividend yield (3 payments of $0.775) of 2.4%, for a total income yield of 13.1% over the next 11 months. This position also has 1.6% in potential price appreciation.
Summary
Morgan Stanley has done well for shareholders. The trailing returns over the past 10 years are high and have been boosted by management’s focus on returning cash to shareholders with dividends and buybacks. The company’s long-term strategy emphasizes wealth management and investment management. With falling equity and bond markets in 2022, asset-based management fees fell, partly offset by rising interest rates that substantially increased interest income. As CEO James Gorman noted in the Q4 earnings call, the company has weathered “the first pandemic in 100 years, the first war in Europe over 70 years and the highest inflation in 40 years. Despite lower asset values and an anemic underwriting calendar, the firm performed well.” The shares have risen to reflect the solid performance, but this leaves limited potential upside over the next year and a fairly high valuation. The Wall Street consensus rating continues to be a buy, although the consensus 12-month price target is only 5.2% above the current share price. The expected total return implied by this price target is 8.3%, which is not a lot of return for a stock with 27% to 29% expected volatility. The market-implied outlook for MS is bullish to the middle of 2023 and into the start of 2024. Even though the recent gains reduce the upside potential, I am maintaining a buy rating on MS. For investors who are more concerned about the current high share price and valuation, selling covered calls is an alternative.
This article was written by

Disclosure: I/we have a beneficial long position in the shares of MS either through stock ownership, options, or other derivatives. I wrote this article myself, and it expresses my own opinions. I am not receiving compensation for it (other than from Seeking Alpha). I have no business relationship with any company whose stock is mentioned in this article.
Additional disclosure: I have sold covered calls as described in the text.