DOL: A Dull International Dividend ETF

Summary
- DOL is a developed world dividend ETF excluding North America.
- Almost two-thirds of assets are invested in European companies.
- The top sector is financials.
- The fund has been quite resilient in the last 12 months.
- However, long-term performance of the strategy is unappealing relative to peers.
- Quantitative Risk & Value members get exclusive access to our real-world portfolio. See all our investments here »
Prostock-Studio
This dividend ETF article series aims at evaluating products regarding the relative past performance of their strategies and quality of their current portfolios. As holdings and their weights change over time, reviews may be updated when necessary.
DOL strategy and portfolio
The WisdomTree International LargeCap Dividend ETF (NYSEARCA:DOL) has been tracking the WisdomTree International LargeCap Dividend Index since 06/16/2006. It has 261 holdings, a 12-month distribution yield of 4.16% and a total expense ratio of 0.48%. Distributions are paid quarterly.
As described by WisdomTree, "the Index is comprised of the 300 largest companies ranked by market capitalization from the WisdomTree International Equity Index. Companies are weighted in the Index based on annual cash dividends paid". It includes developed countries except the U.S. and Canada. As it is weighted based on paid dividends (not yield), it favors mega-cap companies, which represent 58% of asset value.
The top country is Japan with 15.4%. European companies have an aggregate weight close to 65%. Hong Kong weighs below 4%, so direct exposure to China is low. The next chart plots the top 15 countries, representing 98% of the fund's assets.
Country allocation (chart: author; data: WisdomTree)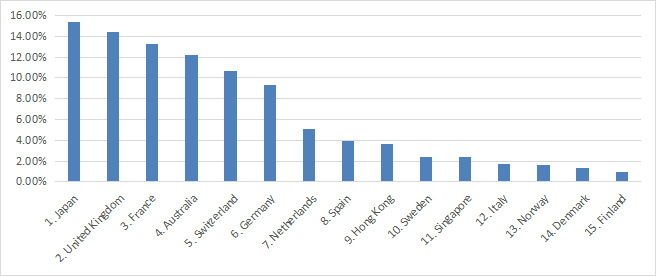
Financials are the heaviest sector with 24.2% of asset value. Other sectors weigh no more than 11%.
Sector breakdown (chart: author; data: WisdomTree)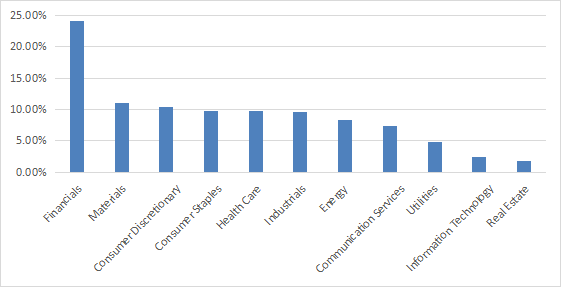
The top 10 holdings, listed below, represent 22.8% of assets. The heaviest one is the Australian mining company BHP Group, whose weight is about 5%. Risks related to other individual companies are low.
Name | Ticker | Weight |
BHP Group Ltd | BHP AU | 5.27% |
Shell Plc-New | SHEL LN | 2.27% |
Nestle SA | NESN SW | 2.24% |
Novartis AG | NOVN SW | 2.21% |
LVMH Moet Hennessy Louis Vuitton SE | MC FP | 2.11% |
TotalEnergies | TTE FP | 2.11% |
HSBC Holdings PLC | HSBA LN | 2.07% |
Rio Tinto Plc | RIO LN | 1.73% |
Roche Holding AG | ROG SW | 1.54% |
Mercedes-Benz AG | MBG GR | 1.26% |
Past performance compared to competitors
The next table and chart compare DOL performance since 2/1/2008 with five international dividend ETFs:
- The SPDR S&P International Dividend ETF (DWX), reviewed here
- The WisdomTree Global ex-U.S. Quality Dividend Growth Fund (DNL), reviewed here.
- The iShares International Select Dividend ETF (IDV), reviewed here.
- The First Trust Dow Jones Global Select Dividend ETF (FGD), reviewed here.
- The Invesco International Dividend Achievers ETF (PID), reviewed here.
since Feb. 2008 | Total Return | Annual Return | Drawdown | Sharpe | Volatility |
DOL | 34.06% | 1.97% | -57.76% | 0.18 | 18.49% |
DWX | -0.02% | 0.00% | -66.86% | 0.08 | 21.27% |
DNL | 99.58% | 4.70% | -37.47% | 0.33 | 17.85% |
IDV | 41.82% | 2.35% | -65.31% | 0.22 | 21.58% |
FGD | 66.86% | 3.46% | -66.21% | 0.25 | 21.32% |
PID | 54.25% | 2.92% | -63.23% | 0.23 | 19.59% |
DOL vs. competitors since 2/1/2008 (Portfolio123)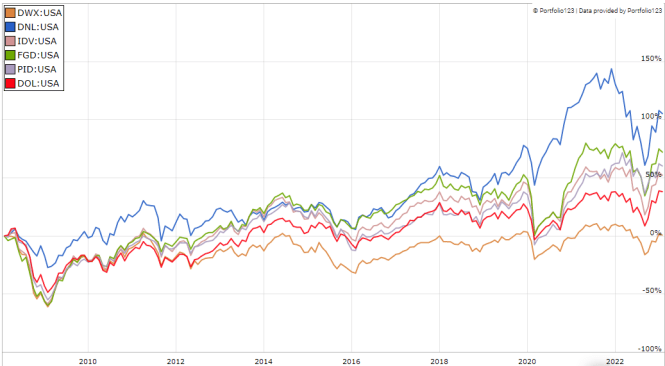
DOL is the second worst performer in total return and risk-adjusted performance (Sharpe ratio). However, it has outperformed the same competitors in the last 12 months (see next chart). The Franklin International Core Dividend Tilt Index ETF (DIVI), which wasn't included in the previous chart because of a more recent inception date, beats DIVI by 10% in this complicated period. It has been reviewed here.
DOL vs. competitors, last 12 months (Portfolio123)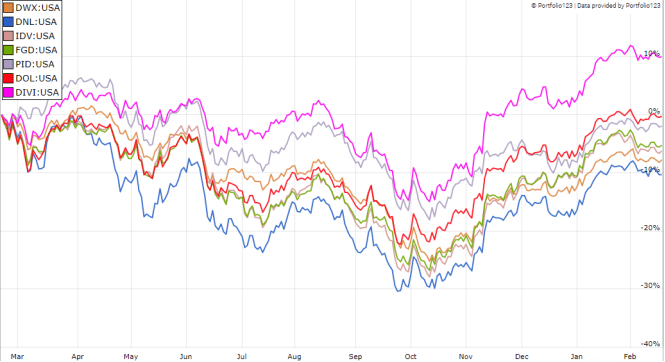
The share price has lost 6% since inception and it has been flattish since 2009. In the same time, the cumulative inflation in the U.S. has been over 37%. It implies a significant decay in inflation-adjusted value for long-term shareholders.
DOL share price (Trading View on Seeking Alpha)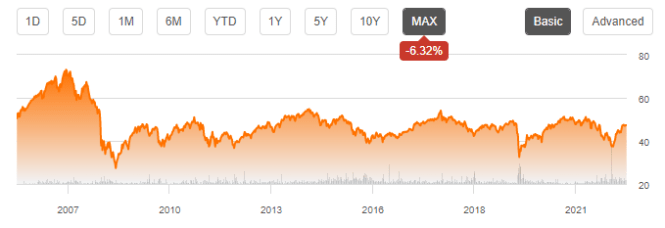
The annual sum of distributions was $1.54 per share in 2012 and $1.94 in 2022, meaning an annualized growth rate of 2.49% in 10 years. It is close to the average inflation rate for the same period (2.52%). Though, the next chart shows there is no steady uptrend in distributions.
Distribution per share (Seeking Alpha)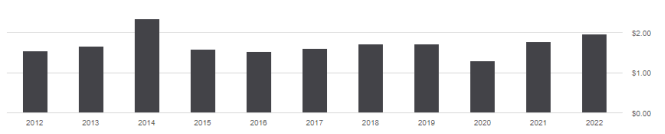
Takeaway
DOL holds 261 stocks from developed countries outside North America, weighted by annual cash dividend. The heaviest country in the portfolio is Japan, but Europe represents almost two thirds of asset value. The top sector is financials, with 24% of assets. The yield looks quite attractive for income-seeking investors, but distribution growth is not steady and it has been just on par with inflation for 10 years. DOL is one of the worst performers among its peers since 2008, but it has shown some resilience in the last 12 months. Finally, the share price has been flattish since inception, which points to a large decay in inflation-adjusted capital. For transparency, a dividend-oriented part of my equity investments is in the actively managed Stability model (14 stocks), disclosed and updated in Quantitative Risk & Value.
Quantitative Risk & Value (QRV) features data-driven strategies in stocks and closed-end funds outperforming their benchmarks since inception. Get started with a two-week free trial now.

This article was written by

Step up your investing experience: try Quantitative Risk & Value for free now (limited offer).
I am an individual investor and an IT professional, not a finance professional. My writings are data analysis and opinions, not investment advice. They may contain inaccurate information, despite all the effort I put in them. Readers are responsible for all consequences of using information included in my work, and are encouraged to do their own research from various sources.
Disclosure: I/we have no stock, option or similar derivative position in any of the companies mentioned, and no plans to initiate any such positions within the next 72 hours. I wrote this article myself, and it expresses my own opinions. I am not receiving compensation for it (other than from Seeking Alpha). I have no business relationship with any company whose stock is mentioned in this article.