Another Massive Inflation Shock Is About To Hit The Market

Summary
- The market can't catch a break; even when the equity market is closed, more inflation data is announced.
- Used auto prices have risen by more than 4%, thus far in February.
- The bull's dream of immaculate disinflation is officially dead at this rate.
- Looking for a helping hand in the market? Members of Reading The Markets get exclusive ideas and guidance to navigate any climate. Learn More »
jetcityimage
Another blow to the disinflation narrative came on February 20, despite the equity markets in the US being closed. The Manheim used car data showed that used car prices rose by 4.1% through the first half of February. That is the most significant increase in used cars since October 2021.
Bloomberg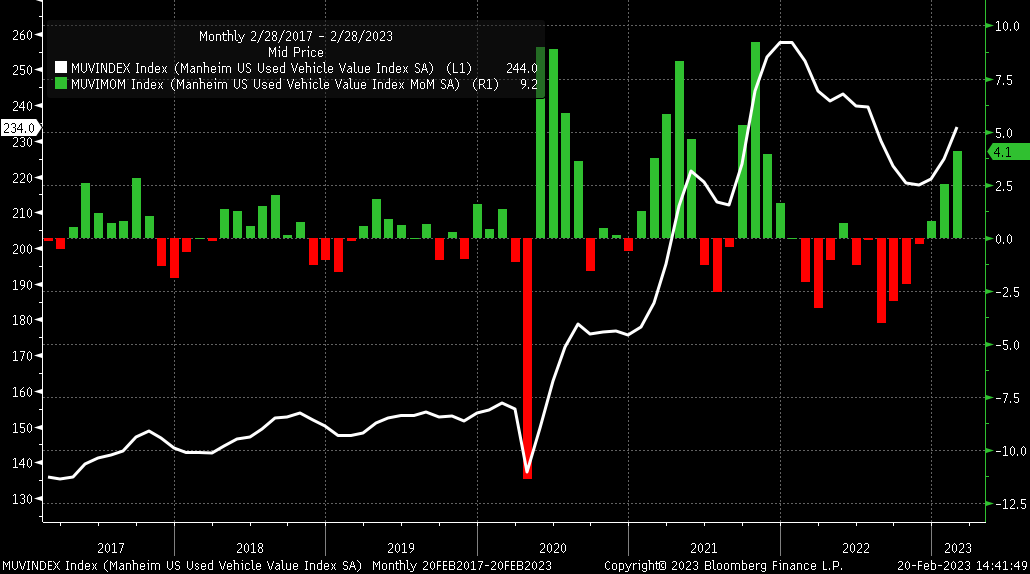
The index rose to 234.0, the highest value since July 2022, when it stood at 239.6. It provides even further evidence that inflation is embedded within this economy and bubbling up again. The used car index price is up 7.5% since the November lower. This type of data will probably feed into the inflation expectations continuing to rise.
Inflation swaps have risen dramatically since the CPI report last week. The February CPI inflation now sees inflation at 6.01%, which is up from 5.78% on January 13, the day before the CPI report. Meanwhile, the March CPI inflation swap is trading at 4.98%, up from 4.85% the day before the CPI report. These inflation swaps tell us that the market expects inflation to be persistently higher than previously expected and that expectations for that fast roll-off in data may be far slower than expected.
Bloomberg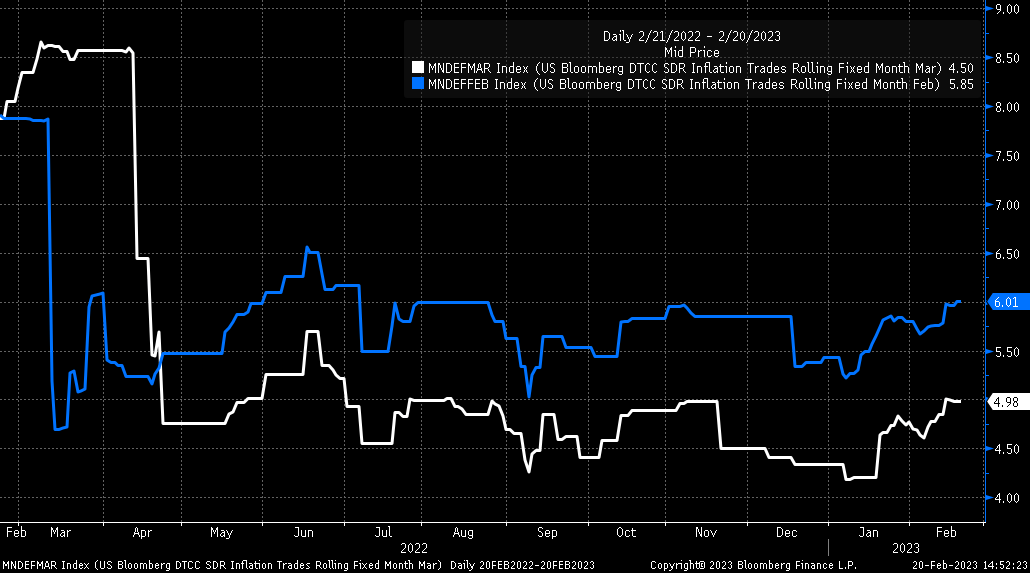
Even worse, the pipe dream that inflation would hit 2% by June is long gone. Inflation swaps for June are now 2.8%, up 80 bps from the January 9 low of 2.03%.
Bloomberg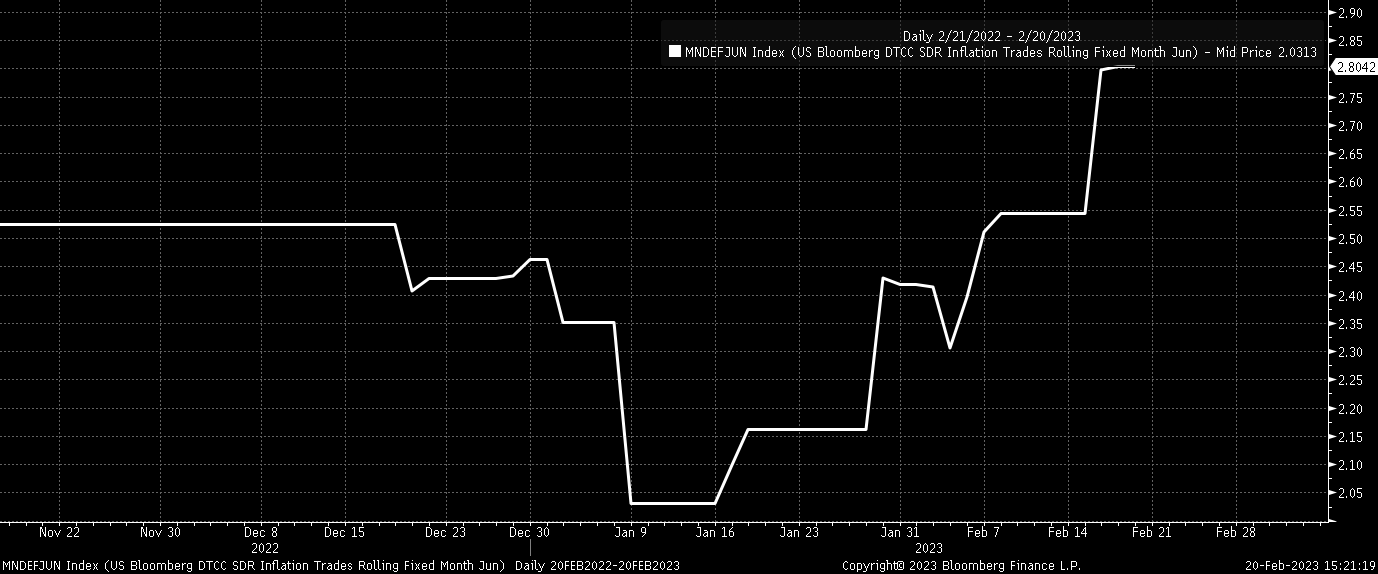
The PCE report is expected to come on Friday as well, showing that inflation in January will also be hot. PCE month-over-month in January is forecast to have increased by 0.5% month-over-month from 0.1% and be up by 5% year-over-year, in line with the December reading. Meanwhile, core PCE is expected to rise by 0.4% month-over-month versus an increase of 0.3% in December and 4.3% year-over-year, down from 4.4% in December. That would undoubtedly be a big blow again to the hope that inflation would ride off into the sunset.
But more importantly, this presents a real problem to the bullish narrative because the higher inflation stays, the higher rates will have to go. Historically, the year-over-year PCE is still more than 1.15% above the 30-year Treasury rate. That has only happened two other times in recent history, in the fall of 1979 and the summer of 1980, and it was brief, and the PCE year-over-year was just 0.3% above the 30-year rate. The inflation rate hasn't exceeded the 30-year Treasury in modern history.
Bloomberg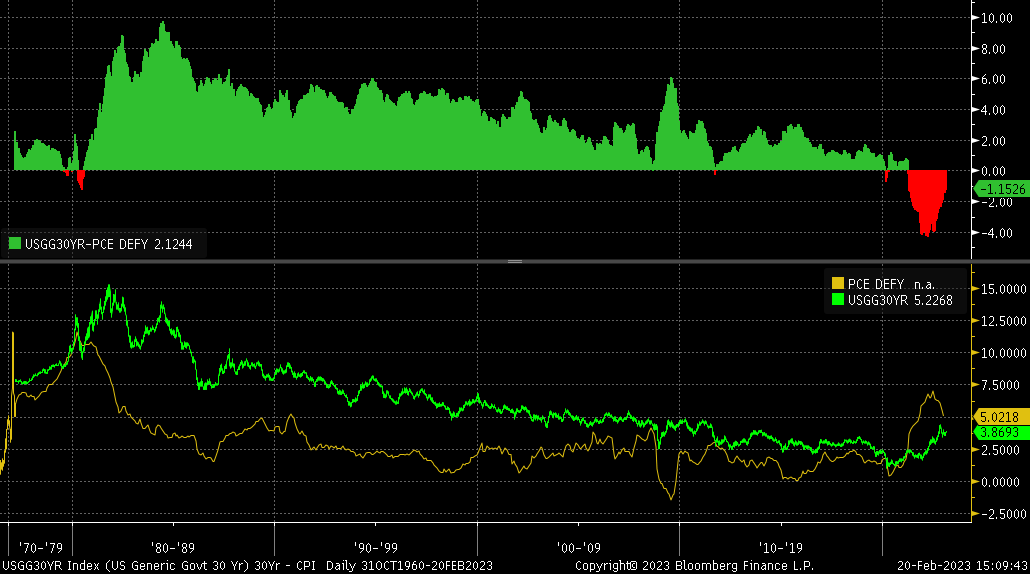
However, long-term rates have been slow to rise because the market has believed that inflation would be fast to come down. But the longer inflation stays high, and the slower it takes to fall, the more likely it becomes that long-term rates will rise above the inflation.
On average, the 30-year rate has traded 3.12% above the PCE inflation rate, implying an 8.12% 30-year rate, assuming PCE comes in at 5% this week. So either inflation needs to start falling fast, or long-term rates will have to head much higher soon.
Bloomberg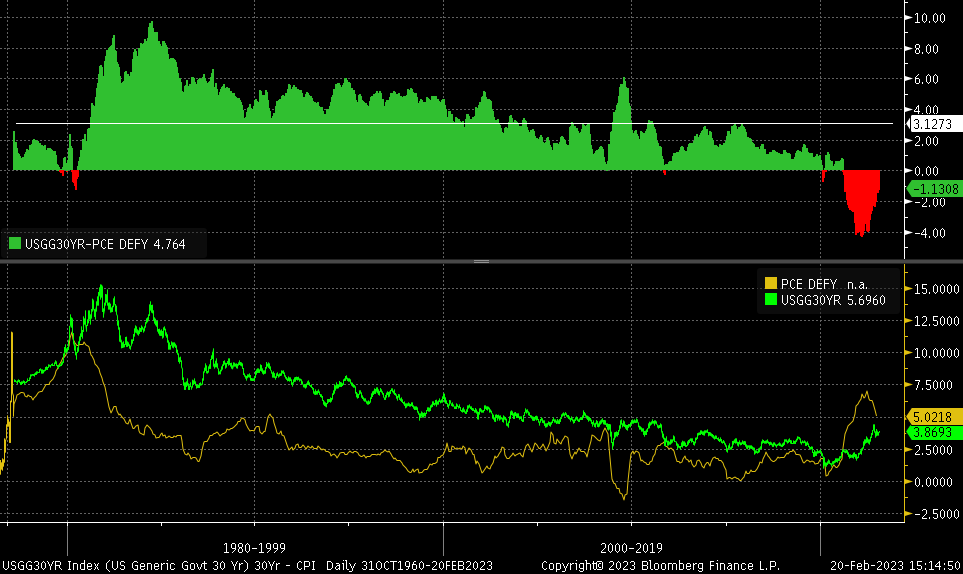
This would have grave implications for the equity market that ran in front of the disinflation narrative. While it is not incorrect to believe that there is a disinflationary narrative because inflation is slowing, the question is how long it will take to come down and sticky it will be in that process. The longer it takes for inflation to come down to the Fed's 2% target, the more likely it is that rates on the long end of the curve will have to rise and the more damage that will cause to stock valuation in the long run.
Based on the data that continues to roll in, it appears the bulls will be wrong once again, just like they have been so many times since the beginning of 2022.
Join Reading The Markets Risk-Free With A Two-Week Trial!
(*The Free Trial offer is not available in the App store)
Find out why Reading The Markets was one of the fastest-growing SA marketplace services in 2022. Try it for free.
Reading the Markets helps readers cut through all the noise by delivering stock ideas and market updates, and if you want to learn how and why markets behave the way they do, this is the place.

This article was written by

I am Michael Kramer, the founder of Mott Capital Management and creator of Reading The Markets, an SA Marketplace service. I focus on long-only macro themes and trends, look for long-term thematic growth investments, and use options data to find unusual activity.
I use my over 25 years of experience as a buy-side trader, analyst, and portfolio manager, to explain the twists and turns of the stock market and where it may be heading next. Additionally, I use data from top vendors to formulate my analysis, including sell-side analyst estimates and research, newsfeeds, in-depth options data, and gamma levels.
Disclosure: I/we have no stock, option or similar derivative position in any of the companies mentioned, and no plans to initiate any such positions within the next 72 hours. I wrote this article myself, and it expresses my own opinions. I am not receiving compensation for it (other than from Seeking Alpha). I have no business relationship with any company whose stock is mentioned in this article.
Additional disclosure: Charts used with the permission of Bloomberg Finance LP. This report contains independent commentary to be used for informational and educational purposes only. Michael Kramer is a member and investment adviser representative with Mott Capital Management. Mr. Kramer is not affiliated with this company and does not serve on the board of any related company that issued this stock. All opinions and analyses presented by Michael Kramer in this analysis or market report are solely Michael Kramer’s views. Readers should not treat any opinion, viewpoint, or prediction expressed by Michael Kramer as a specific solicitation or recommendation to buy or sell a particular security or follow a particular strategy. Michael Kramer’s analyses are based upon information and independent research that he considers reliable, but neither Michael Kramer nor Mott Capital Management guarantees its completeness or accuracy, and it should not be relied upon as such. Michael Kramer is not under any obligation to update or correct any information presented in his analyses. Mr. Kramer’s statements, guidance, and opinions are subject to change without notice. Past performance is not indicative of future results. Past performance of an index is not an indication or guarantee of future results. It is not possible to invest directly in an index. Exposure to an asset class represented by an index may be available through investable instruments based on that index. Neither Michael Kramer nor Mott Capital Management guarantees any specific outcome or profit. You should be aware of the real risk of loss in following any strategy or investment commentary presented in this analysis. Strategies or investments discussed may fluctuate in price or value. Investments or strategies mentioned in this analysis may not be suitable for you. This material does not consider your particular investment objectives, financial situation, or needs and is not intended as a recommendation appropriate for you. You must make an independent decision regarding investments or strategies in this analysis. Upon request, the advisor will provide a list of all recommendations made during the past twelve months. Before acting on information in this analysis, you should consider whether it is suitable for your circumstances and strongly consider seeking advice from your own financial or investment adviser to determine the suitability of any investment.