Energy Transfer: Still Significantly Undervalued

Summary
- Energy Transfer's management team reported sales and earnings that fell short of expectations for the final quarter of the company's 2022 fiscal year.
- Although this may seem disappointing, the company's cash flow data was robust, and the future looks bright.
- Shares look significantly undervalued and likely offer great upside moving forward.
- Looking for a helping hand in the market? Members of Crude Value Insights get exclusive ideas and guidance to navigate any climate. Learn More »
redtea
As those who follow my writing closely know, I run a very concentrated portfolio. At present, I have only 10 holdings and, frankly, I would like to trim that down to seven or eight at the most. At present, the third largest holding in my portfolio is Energy Transfer (NYSE:ET), an energy infrastructure company that provides pipeline and midstream services. As of this writing, it makes up around 13.9% of my total holdings. Since buying ET stock a little over a year ago, I have done quite well, generating a 19% return before factoring in distributions. But the big question now is what lies ahead. Fortunately, management did just come out the other day with financial results covering the final quarter of the company's 2022 fiscal year. That data revealed that, while the business may not see an expansion and profits in 2023, its overall health is undeniable. Not only that, but shares of the firm also look cheap, both on an absolute basis and relative to similar firms. Given these factors, I am glad to not only have purchased the stock but also to not have sold a single share since acquiring it.
Shares still make sense
For those who saw the headline news when management reported results covering the fourth quarter of the company's 2022 fiscal year, the data might have been discouraging. Revenue for the quarter came in at $20.50 billion. That represents a roughly 9.9% improvement over the $18.66 billion generated one year earlier. Having said that, it fell short of the $23.81 billion that analysts anticipated. Earnings per share of $0.34, meanwhile, missed expectations to the tune of $0.03 per share.
Author - SEC EDGAR Data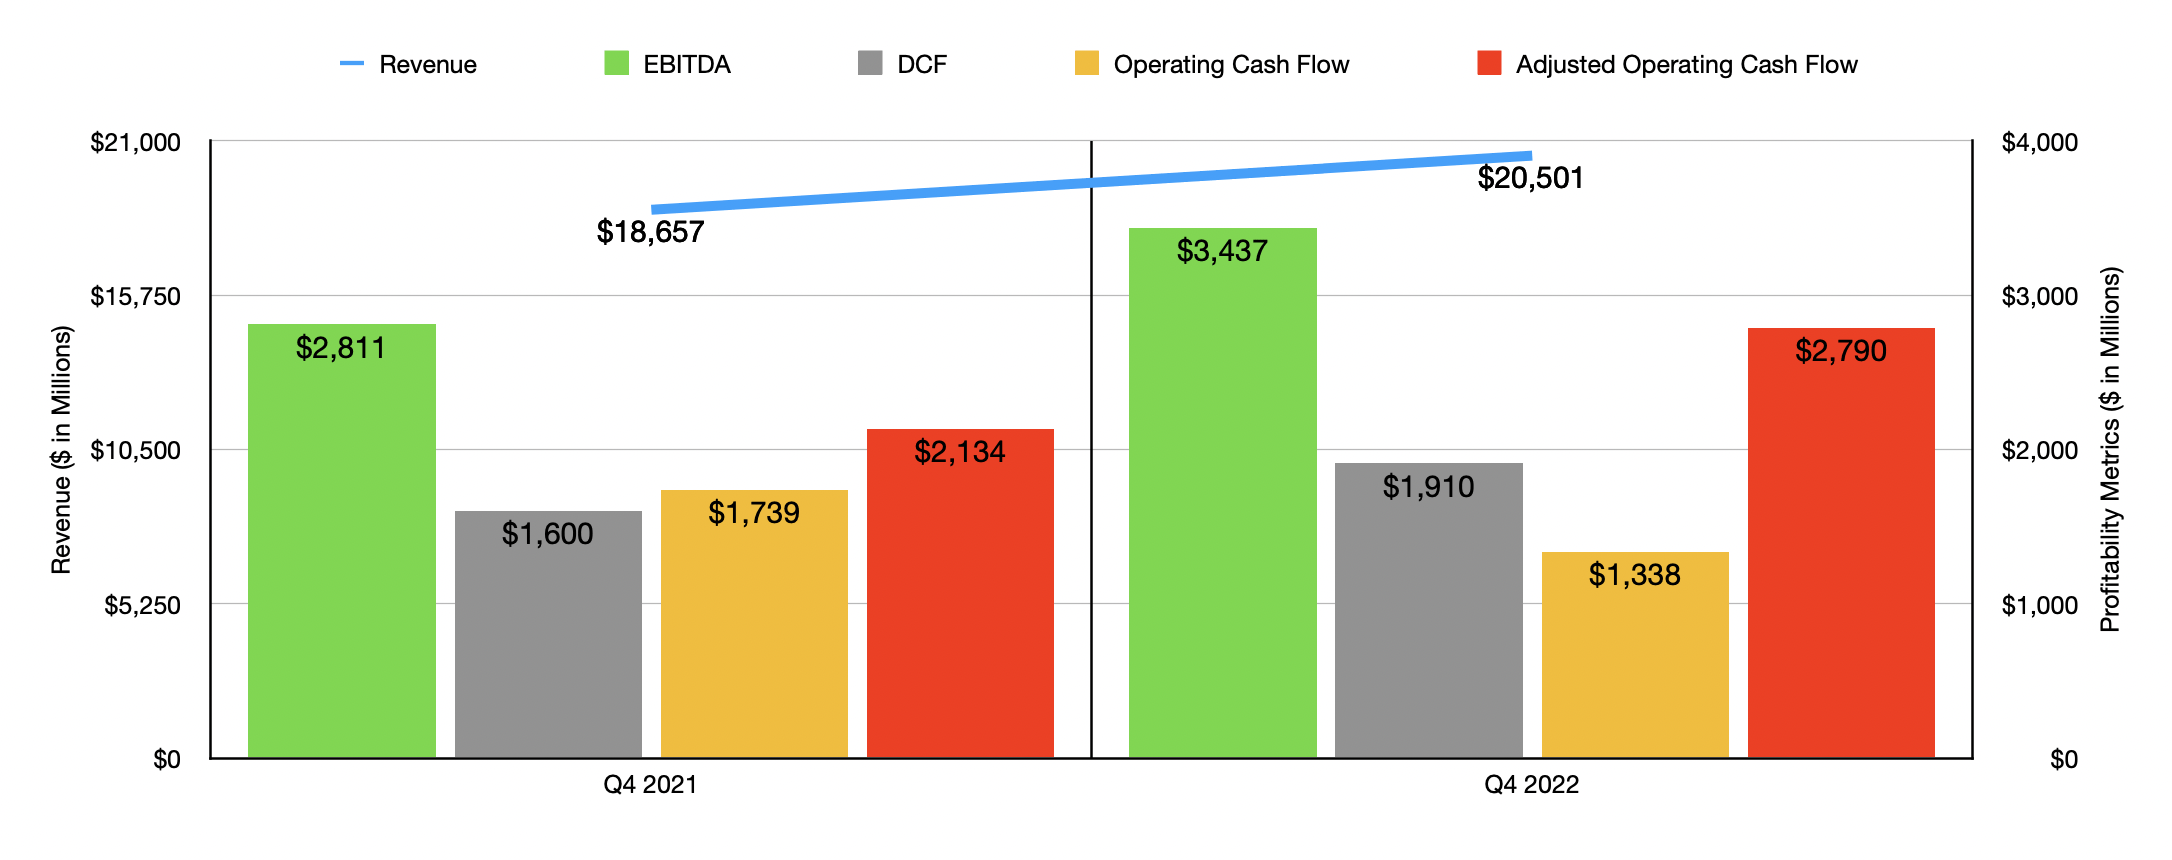
Normally, when you see a miss on both the top and bottom lines of this degree, you would expect the company in question to experience quite a beating. Fortunately, these metrics are not all that valuable for investors when it comes to a pipeline operator. Instead, we should be paying attention to various cash flow metrics. The first of these worth taking into consideration is operating cash flow. During the quarter, this metric totaled $1.34 billion. This was down considerably from the $1.74 billion reported one year earlier. But if we adjust for changes in working capital, it actually would have risen from $2.13 billion to $2.79 billion. Over the same window of time, DCF, also known as distributable cash flow, popped up from $1.60 billion to $1.91 billion. And finally, EBITDA for the company rose from $2.81 billion to $3.44 billion.
By all accounts, I would say that these were rather impressive results for the company to have reported. This strong outcome allowed the company to report total revenue for 2022 of $89.88 billion, which was up from the $67.42 billion reported for 2021. DCF did fall year over year, dropping from $8.22 billion to $7.45 billion. The company also saw operating cash flow drop from $11.16 billion to $9.05 billion. But on an adjusted basis, it would have risen from $10.59 billion to $10.72 billion, while EBITDA inched up from $13.05 billion to $13.09 billion. Even though these mixed results may not seem all that great, it's important to note that, in 2021, the company benefited greatly from inclement weather, particularly from Winter Storm Uri. As an example, under the Intrastate Transportation and Storage segment, EBITDA was about $1.47 billion higher in 2021 than it was in 2022 because of a decrease in realized storage margins associated mostly with higher physical storage margins from withdrawals during the storm. The company also benefited tremendously during that time and, in 2022, saw a decrease of $628 million compared to the year prior and realized natural gas sales due primarily to natural gas sales conducted at prevailing market prices during the storm.
Author - SEC EDGAR Data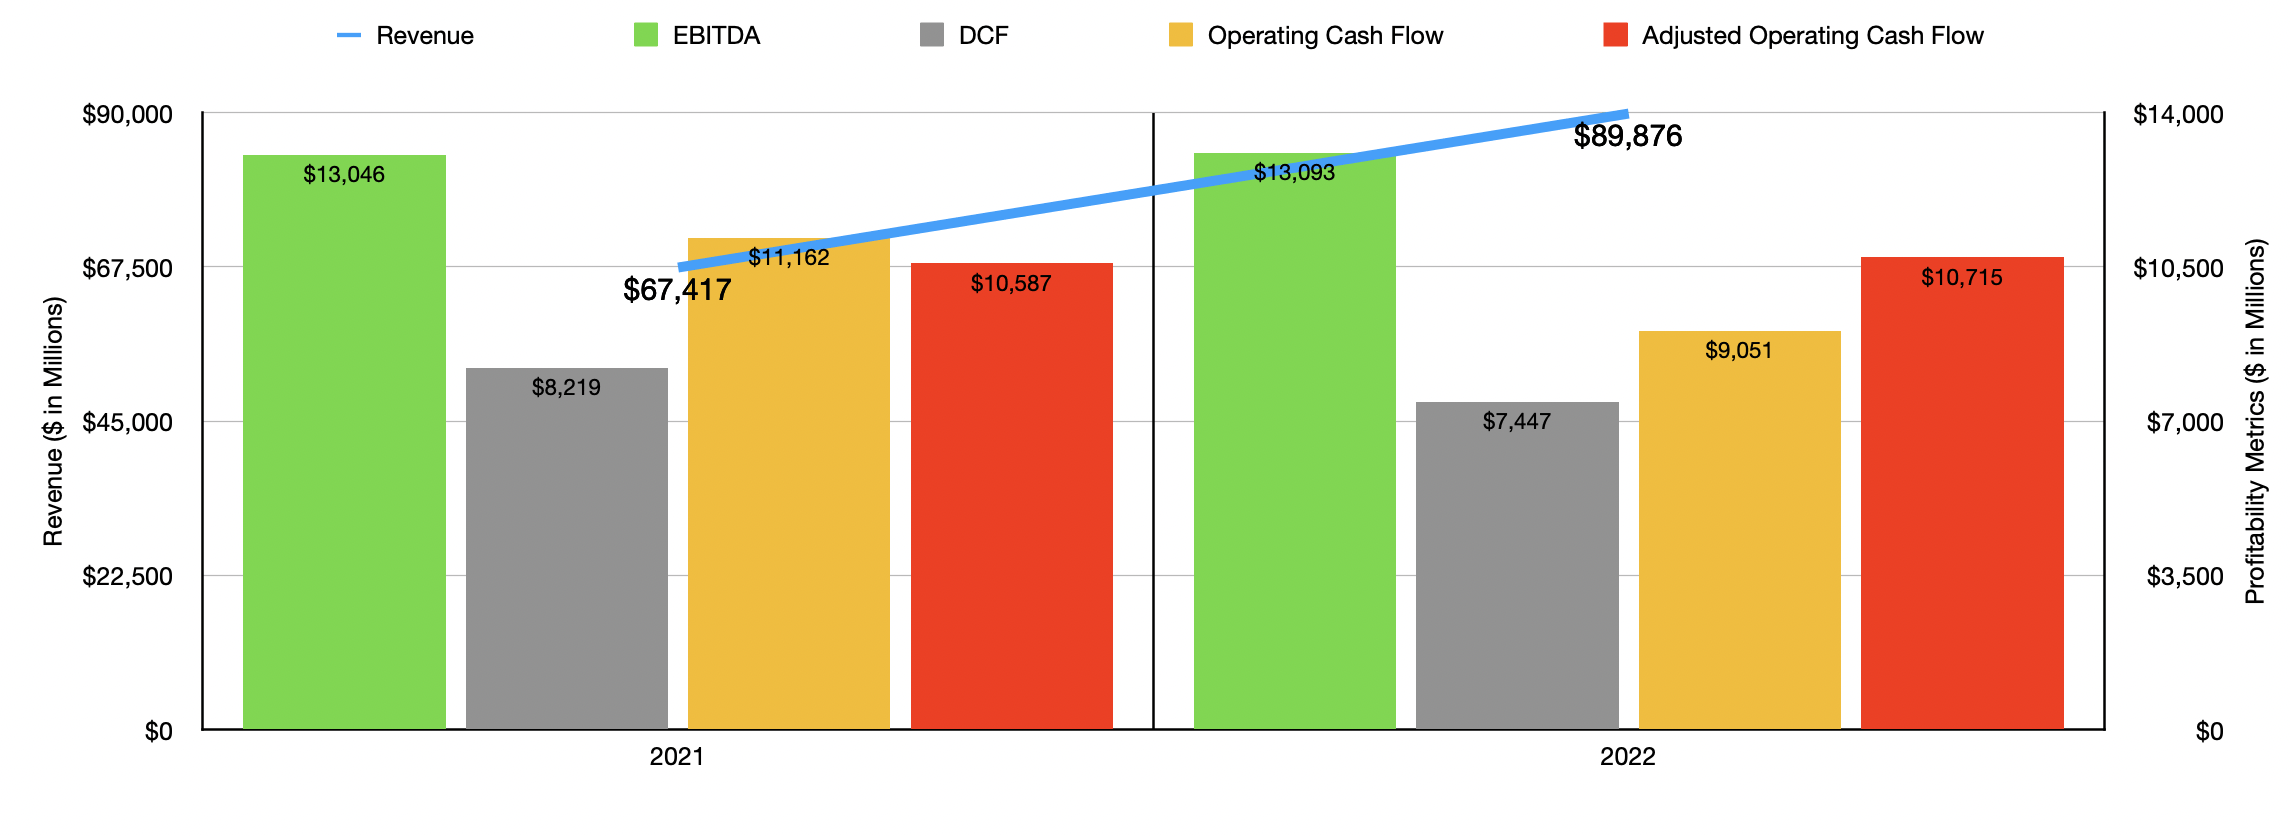
Another really good thing about the financial performance in 2022 is that it allowed management to pay down debt further. Net debt ended at $48.01 billion last year. That's $1.36 billion lower than what it ended the 2021 fiscal year at. When it comes to the 2023 fiscal year, I fully suspect that debt will fall even more. I say this because management is currently forecasting EBITDA for the year of between $12.9 billion and $13.3 billion. No guidance was given when it came to other profitability metrics. However, it's likely that these will also be higher than they were in 2022. After factoring in maintenance capital expenditures, preferred distributions, and amounts paid to non-controlling interests net of any proceeds received from them, I estimated that ‘true free cash flow’ for the company was roughly $8.33 billion in 2022. Even if 2023 levels match with what the company saw in 2022, this leaves plenty of capital to work with. Keeping the distribution at $1.22 per share, the company will have to pay out about $3.78 billion to shareholders. Growth-oriented capital expenditures should be between $1.6 billion and $1.8 billion. At the midpoint, this would still translate to excess cash flow of roughly $2.85 billion for the year.
Author - SEC EDGAR Data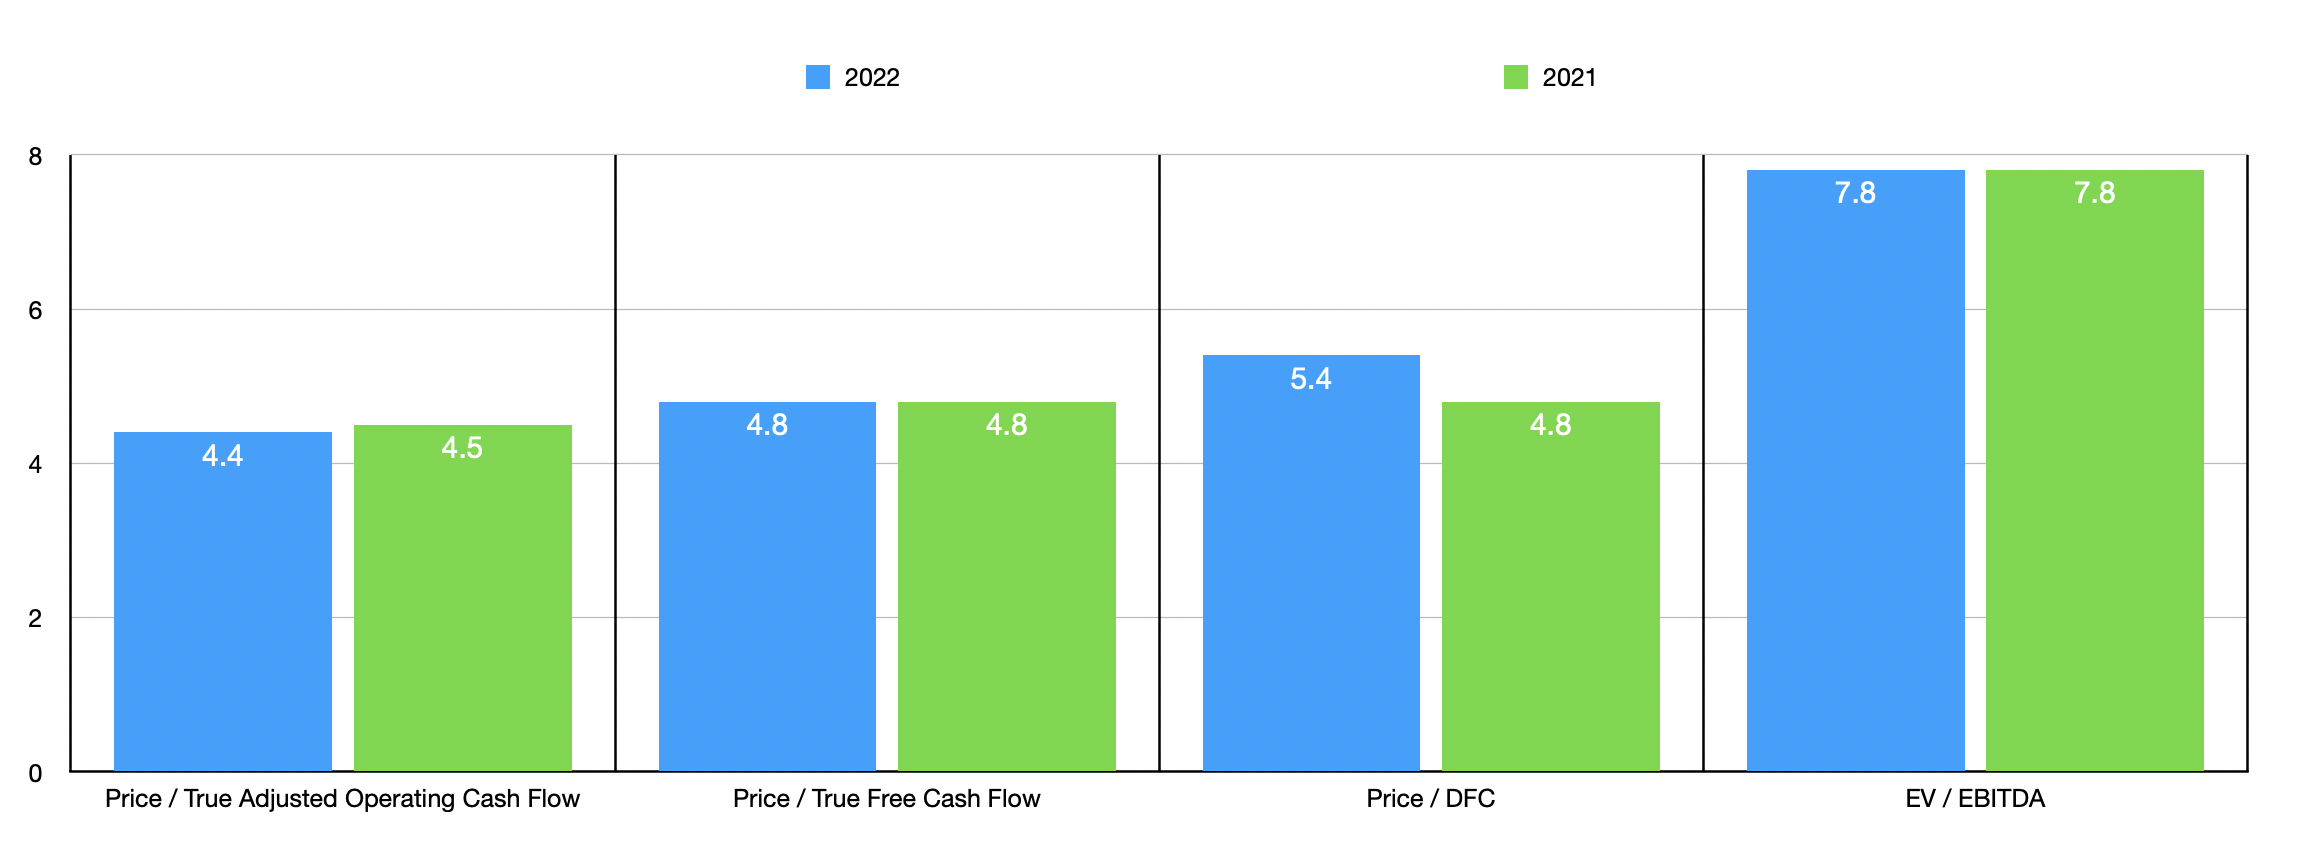
Again, assuming that 2023 looks a lot like 2022 instead of the improved outlook that management has, shares of the business are still quite cheap. Using the 2022 figures, the firm is trading at a price-to-adjusted operating cash flow multiple of 4.4. This adjusted operating cash flow figure strips out all of the same things that the ‘true free cash flow’ metric strips out, with the exception of the maintenance capital expenditures. Speaking of the devil, the price to ‘true free cash flow’ multiple for the company should be 4.8. The price to DCF multiple is only slightly higher at 5.4, while the EV to EBITDA multiple should come in at 7.8. These numbers are very similar to what we get using data from 2021, as can be seen in the chart above.
| Company | Price / Operating Cash Flow | EV / EBITDA |
| Energy Transfer | 4.4 | 7.8 |
| Kinder Morgan (KMI) | 8.1 | 11.6 |
| Williams Companies (WMB) | 7.9 | 11.4 |
| TC Energy (TRP) | 8.6 | 18.0 |
| Cheniere (LNG) | 4.6 | 391.2 |
| Enterprise Products Partners (EPD) | 7.1 | 10.4 |
As part of my analysis, I also compared the company to five similar firms. On a price-to-operating cash flow basis, these companies ranged from a low of 4.6 to a high of 8.6. And when it comes to the EV-to-EBITDA approach, the range would be from 10.4 to 391.2. In both cases, Energy Transfer was the cheapest of the group. In the table below, you can see a couple of different valuation scenarios. The first of these tries to see what upside Energy Transfer experience if it were to trade at the multiples of the cheapest of the five firms I looked at. The second scenario looks at the same thing, but for a situation where we average out the multiples of the five businesses, excluding of course, the extreme outlier with the EV to EBITDA multiple of 391.2. What this shows is that, in the worst case, Energy Transfer would warrant upside of 4.5%. However, the other three results are significantly more bullish, showing upside of between 65.9% and 169.1%. Personally, I would feel comfortable selling my stock in the business only after getting upside of at least an extra 30%, excluding distributions.
Author - SEC EDGAR Data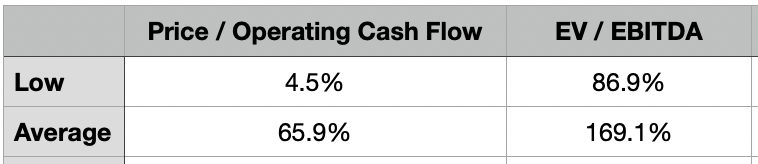
Takeaway
Based on the data provided, I do believe that Energy Transfer offers some of the greatest potential out of any company on the market. I don't think that it has the most upside on its own. But I do think that, between the distribution, the company's stable cash flows, and how cheap shares are, it offers the most upside for the risk assumed. Eventually, I suspect that the market will come to realize this, especially if management does start to pay down debt further. In the meantime, I am content to just sit back and capture the 11.3% distributions on the weighted average cost of my investment. After all, that's roughly in line with what the historical return has been for the S&P 500. Any upside from share price appreciation in the meantime is gravy.
Crude Value Insights offers you an investing service and community focused on oil and natural gas. We focus on cash flow and the companies that generate it, leading to value and growth prospects with real potential.
Subscribers get to use a 50+ stock model account, in-depth cash flow analyses of E&P firms, and live chat discussion of the sector.
Sign up today for your two-week free trial and get a new lease on oil & gas!
This article was written by

Daniel is an avid and active professional investor. He runs Crude Value Insights, a value-oriented newsletter aimed at analyzing the cash flows and assessing the value of companies in the oil and gas space. His primary focus is on finding businesses that are trading at a significant discount to their intrinsic value by employing a combination of Benjamin Graham's investment philosophy and a contrarian approach to the market and the securities therein.
Disclosure: I/we have a beneficial long position in the shares of ET either through stock ownership, options, or other derivatives. I wrote this article myself, and it expresses my own opinions. I am not receiving compensation for it (other than from Seeking Alpha). I have no business relationship with any company whose stock is mentioned in this article.