Gold Market Commentary - January 2023

Summary
- The US dollar was a significant contributor to gold’s 6.1% January gain, followed by a drop in US Treasury yields.
- Since the net short low in September 2022, gold has gained 15%.
- Global gold ETFs have surprisingly stayed on the sidelines during the rally, but North American funds are dipping their toes, and futures have historically led flows in gold ETFs.
hallojulie
January in review: Front foot start for gold
The US dollar was a significant contributor to gold’s 6.1% January gain, followed by a drop in US Treasury yields.
A second positive ‘unexplained’ factor in our model may be continued central bank buying.
Looking forward: Futures blaze a trail for gold ETFs to follow
- Gold price rallies from previous net short lows in futures positioning have been strong and durable; the current rally looks similar
- It is not merely a short covering. Long positioning has been as active as previously, suggesting a buy-in to gold’s tactical case. And short positions remain, signalling an uncrowded trade
- While European outflows have masked nascent North American inflows, our analysis suggests that futures historically lead ETFs which could entice a more sustained rally.
Front foot start for gold
A 6.1% return in January took gold to US$1,924/oz, and the US dollar return close to the top of the currency return table thanks to a weaker exchange rate (Table 1).
Another month of increasing COMEX futures net longs to 250t or 16% of open interest, helped drive the price. While European gold ETFs continue to see outflows in a more sanguine regional economic and inflation environment, US funds have been dipping their toes due, in our view, to a good tactical case for gold.
According to our Gold Return Attribution Model (GRAM) (Chart 1), from a macro perspective, a good portion of January’s performance can be attributed to the weaker US dollar, followed by a sizeable 37bps drop in the US 10-year Treasury yield. The strong December return for gold was a small drag in January as gold returns tend to experience some mean reversion, a feature that reflects its low volatility relative to other assets.
Finally, we saw another positive 'unexplained' portion of our model, which also characterised parts of 2022. On reflection and given new information as per our FY Gold Demand Trends publication, we can’t rule out that some of the unexplained return is capturing central bank buying or expectations thereof, which - following a colossal 2022 - may be continuing into 2023.
Chart 1: A weaker dollar was the dominant contributor to gold’s positive return in January
Sources: Bloomberg, World Gold Council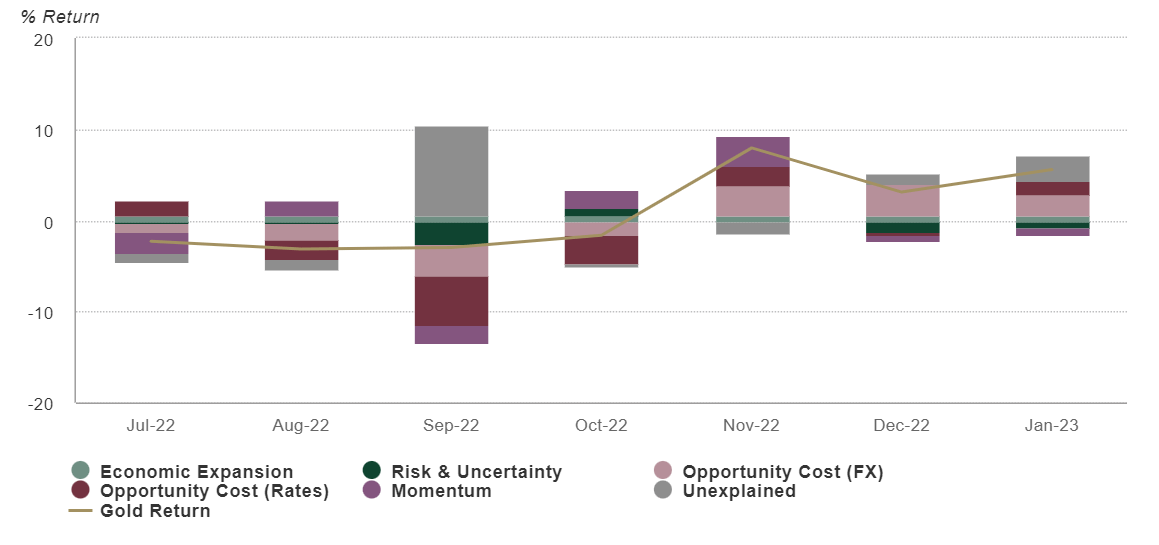
*Data to 31 January 2023. Our Gold Return Attribution Model (GRAM) is a multiple regression model of monthly gold price returns, which we group into four key thematic driver categories of gold’s performance: economic expansion, risk & uncertainty, opportunity cost, and momentum. These themes capture motives behind gold demand; most poignantly, investment demand, which is considered the marginal driver of gold price returns in the short run. ‘Unexplained’ represents the percentage change in the gold price that is not explained by factors currently included in the model. Results shown here are based on analysis covering an estimation period from February 2007 to January 2023.
Table 1: Gold has started the year on the front foot
Gold price and return in different periods across key currencies*
| USD (oz) | EUR (oz) | JPY (g) | GBP (oz) | CAD (oz) | CHF (oz) | INR (10g) | RMB (g) | TRY (oz) | AUD (oz) | |
| 31 January 2023 price | 1,924 | 1,771 | 8,047 | 1,562 | 2,560 | 1,763 | 50,675 | 418 | 36,198 | 2,727 |
| January return | 6.10% | 4.50% | 5.20% | 4.00% | 4.10% | 5.10% | 5.00% | 3.90% | 6.70% | 2.40% |
| Y-o-Y return | 7.20% | 10.80% | 21.10% | 17.00% | 12.20% | 5.90% | 17.70% | 13.80% | 51.60% | 7.30% |
*Data to 31 January 2023. Based on the LBMA Gold Price PM in local currencies: US dollar (USD), euro (EUR), Japanese yen (JPY), pound sterling (GBP), Canadian dollar (CAD), Swiss franc (CHF), Indian rupee (INR), Chinese yuan (RMB), Turkish lira (TRY), and Australian dollar (AUD).
Source: Bloomberg, ICE Benchmark Administration, World Gold Council
Futures blaze a trail
Our July 2022 commentary highlighted that the rare occurrence of net short levels for COMEX gold Managed Money futures1 was associated with a subsequent strong gold price performance.
Since the net short low in September 2022, gold has gained 15%. However, with only four such lows in the available data, the sample size gives us little statistical confidence in the signal. But breaking net longs into constituent longs and shorts and incorporating gold ETF flows suggests that the current rally could be sustained. In summary, we find that:
- Gold’s performance so far has been similar to previous post-low rallies, which were strong and durable
- Longs have been active indicating a buy-in to gold’s tactical case
- Shorts, have not capitulated, suggesting that long positioning is not a crowded trade yet
- European gold ETF outflows have masked nascent positive flows in America
- Futures lead changes in North American ETFs by up to two weeks
As a result, rising net longs could entice further ETF inflows, prolonging the rally.
Net shorts low: a catalyst
Our previous analysis in 2022 focused on the signal value of COMEX futures positioning data for gold prices. We found that rare net short positioning had preceded strong gold price rallies, consistent with oversold and under-owned sentiment. We addressed the small sample of gold net shorts by z-scoring2 the series and also combining it with signals from positioning in the US Dollar Index (DXY) and the US 10-year Treasury future - two key short-term drivers of gold which were also close to extremes. The signal improved markedly and suggested, based on the historical relationship, a high probability of positive forward returns for gold.
Chart 2: Gold’s rallies from a futures net short low* have historically been strong and durable
Sources: Bloomberg, World Gold Council
Each line shows the cumulative percentage change in the gold price (LBMA Gold Price PM) per week, following a low in net (short) managed money futures only series, as a % of open interest, from the Commitment of Traders (COT) report. The table shows the 17-week (analysis done on COT release from the 24th January), 26-week (c 6-month), and 52-week performance post the date of the low in positioning.
| Gold return post low | |||
| Date of low | +16w | +26w | +52wk |
| 15-Dec-15 | 16% | 21% | 9% |
| 09-Oct-18 | 10% | 10% | 27% |
| 23-Apr-19 | 18% | 17% | 33% |
| 27-Sep-22 | 15% | ||
At current levels, these indicators are not informative as we have since moved away from extremes. So, we turn to other factors for help. In particular, we look at how the long positions and short positions have behaved independently. In addition, we bring gold ETF flows into the mix and we try to determine if futures positioning might have a leading edge on ETFs, which to date have been reluctant to join the price rally.
The 15% gain in gold since the September 2022 low was set has been similar to that of the three previous rallies (Chart 2). The inset table shows that these rallies were both strong and durable - with 2015 marginally less so.
Longs active on good tactical case, shorts sceptical
The current rally has fundamentally been aided by a falling US dollar, recession risk, expectations for lower future interest rates, elevated geopolitical risk, high inflation, and central bank buying, and in our view, many of these factors are set to continue in 2023. Analysts’ price forecasts for gold appear overwhelmingly in favour of modest gains in 2023.3 Twenty out of 24 analysts in the 2023 LBMA precious metals forecast survey see the gold price rising in 2023. Fourteen out of 16 active forecasters on Bloomberg expect gold to rise. Given that the signal from our July 2022 report indicator is currently inconclusive we wanted to address whether we could derive other useful information from futures and with some help from ETFs to determine if the current rally is sustainable.
Chart 3: Longs in play. Shorts more reluctant to let go
Sources: Bloomberg, World Gold Council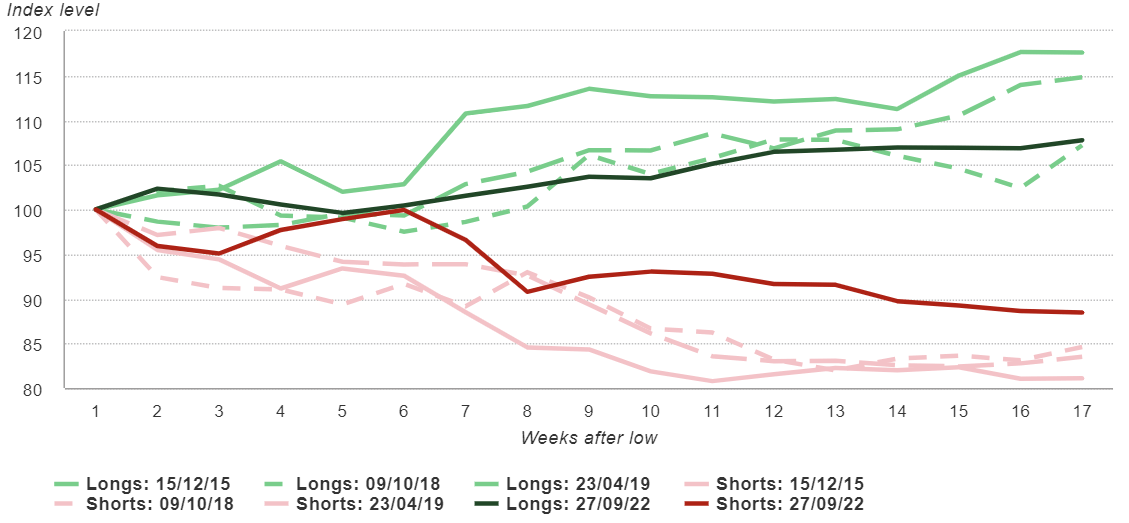
COMEX managed money long and short futures only series, as a % of open interest. Data to 24 January 2023.
One feature of a rally that might reflect its potential sustainability is whether it is mainly driven by an increase in longs or a reduction in shorts (short covering). A short-covering rally might suggest a lower risk-reward to be short but without a solid case to go long. Conversely, a long-driven rally should reflect the belief in a more sustained tactical and fundamentals-driven bull case (Chart 3). Longs (bold green) in the current rally have been active in a similar fashion to the previous three post-low rallies.
On the short side, the reduction in positions (bold red in Chart 3) has been more muted than previously. This might suggest that some scepticism remains and there are shorts still to capitulate.
Chart 4: Global ETFs have shunned the rally…so far
Sources: Bloomberg, Company Filings, World Gold Council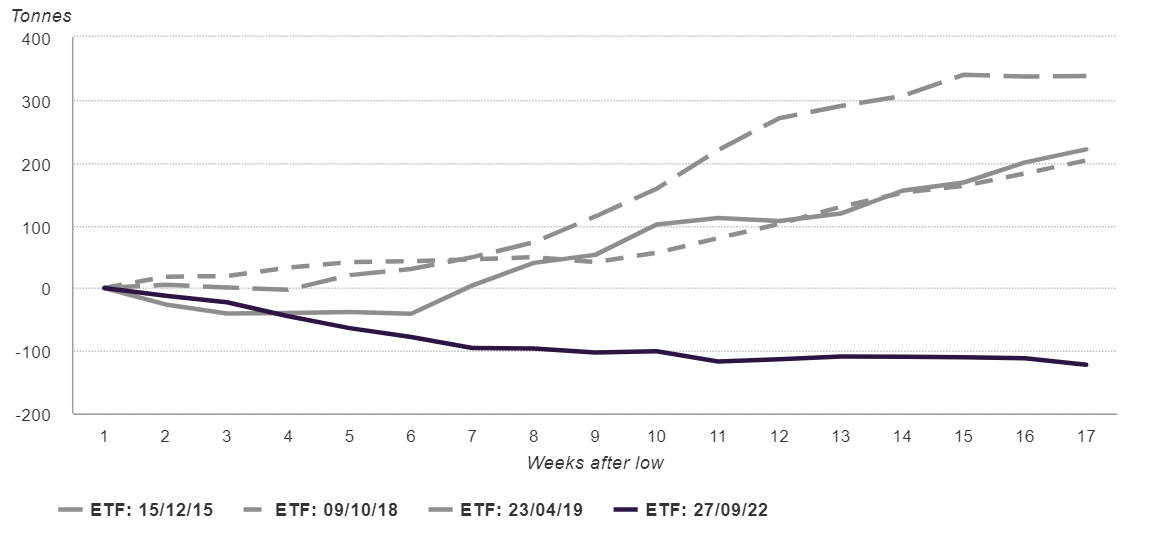
Data to 24 January 2023. On Goldhub, see: Gold-backed ETF flows. Data to 24 January 2023.
We also looked at North American ETF flows (c.50 % of global holdings), as futures are only part of the picture. Chart 4 shows a stark contrast between the flows in the current rally compared to those from the previous three. There has been no apparent participation from global gold ETFs so far. Even in recent weeks, aggregate flows have been negative. But when we strip out flows out of European funds, US funds have now experienced cumulative inflows since December (Chart 5).
Chart 5: North American ETFs are starting to add to holdings*
Sources: Bloomberg, Company Filings, ICE Benchmark Administration, World Gold Council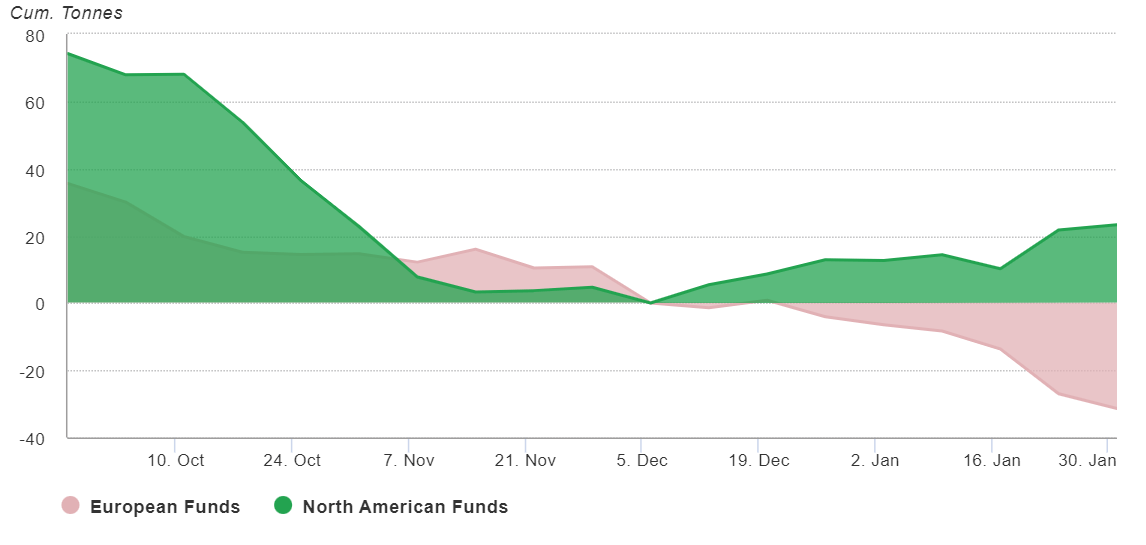
*Data to 27 January 2023. On Goldhub, see: Gold-backed ETF flows.
There has been no apparent participation from global ETFs so far. Even in recent weeks, aggregate flows have been negative. But when we strip out flows out of European funds, US funds have now experienced cumulative inflows since December (Chart 5).
Should we expect gold ETFs to follow?
In addition, we also tested whether futures might provide a steer for gold ETF flows. We found that net longs have a statistically significant impact on North American ETF flows in particular, up to two weeks later. At a weekly level we don’t see this phenomenon in reverse (Table 2).
There are two likely explanations for this. First, futures are leveraged plays4 with greater long-term holding costs than gold ETFs and therefore lend themselves to more short-term tactical investments. ETFs, on the other hand, have both tactical and strategic investment appeal. This would suggest that turns in the market are likely, on average, to be led by futures. Second, futures positioning reports are released on a Friday but reflect the previous Tuesday’s data. It is likely that there is an additional signalling impact on both futures and ETFs when the data is released. However, the second lag of futures is also not far from being significant (p-value of 0.114), which gives us more confidence in our interpretation of the results. All in all, we view the tactical case for gold to be good. Futures may have led the rally so far but we expect ETFs are likely to follow.
Table 2: Futures positioning appears to lead ETF flows, but not vice versa
Vector Autoregression Model on change in ETF holdings and change in futures net longs (Managed Money) as a % of open interest*
| VAR model regression results | |||||
| Dependent variable: | Δ ETF | ||||
|---|---|---|---|---|---|
| Lags | Coeff | Std. error | T-stat | P-value | Sig |
| Constant | 0.833 | 0.459 | 1.816 | 0.069 | * |
| Δ ETF (-1) | 0.305 | 0.034 | 8.984 | 0.000 | *** |
| Δ ETF (-2) | 0.152 | 0.034 | 4.522 | 0.000 | *** |
| Δ Net Long (-1) | 45.033 | 13.306 | 3.385 | 0.001 | *** |
| Δ Net Long (-2) | 21.176 | 13.388 | 1.582 | 0.114 | |
| Granger causality Test: | statistic | 7.928 | 0.000 | *** | |
| Dependent variable: | Δ Futures Net Long | ||||
| Lags | Coeff | Std. error | T-stat | P-value | |
| Constant | 0.000 | 0.001 | -0.034 | 0.973 | |
| Δ ETF (-1) | 0.000 | 0.000 | 0.753 | 0.451 | |
| Δ ETF (-2) | 0.000 | 0.000 | -0.693 | 0.488 | |
| Δ Futures Net Long (-1) | 0.169 | 0.034 | 4.914 | 0.000 | *** |
| Δ Futures Net Long (-2) | -0.043 | 0.035 | -1.231 | 0.219 | |
| Granger Causality Test: | statistic | 0.382 | 0.683 | ||
*Data from 20 June 2006 to 31 January 2023. Weekly on Tuesday. Optimal VAR model lags estimated via BIC criterion. Futures = Net Managed Money / OI Individual series ΔETFs and ΔFutures Net longs are differenced transforms of the original level series. Both transformed series are stationary at the 1% level using ADF test, a requirement of both a VAR model and the Granger Causality Test. The Granger Causality uses an F-test (among others) to determine if lagged independent variables ‘Granger-cause’ (impact) the dependent variable. It is important to note that the test does not conclude causality but merely suggests a relationship. Results are robust whether the dependent variable is North American ETF flows or Total ETF flows, although the lag effect is marginally weaker. They are also robust whether the series are first differenced or log differenced (to account for heteroskedasticity).
Source: Bloomberg, Company Filings, ICE Benchmark Administration, World Gold Council
In summary, although rare, net short lows in futures positioning have historically been associated with strong and durable gold price rallies. The current rally looks similar; the data shows that it is not merely a short covering rally. Longs have been as active as in the past, suggesting a buy-in to gold’s good tactical case. Shorts, on the other hand, have not capitulated as fast. There might exist a lingering scepticism towards the rally, which may bode well as the trade doesn’t appear crowded. Global gold ETFs have surprisingly stayed on the sidelines during the rally, but North American funds are dipping their toes, and futures have historically led flows in gold ETFs.
Regional insights
China: As the national COVID infection wave peaked in December, China's economic activities bounced back - reflected by the m-o-m jump in January’s general Purchasing Managers’ Index (PMI). This, coupled with the traditional sales boost around the Chinese New Year holiday, boded well for local gold demand in January, putting a stop to the downward trend of the Shanghai-London gold price premium. Meanwhile, the People’s Bank of China announced another gold reserve increase of 15t in January.
India: The local gold price touched an all-time high time breaching Rs57,000/10gm levels that dampened retail demand during the month. Demand remained some marginal support from wedding purchases during January, but the overall sentiment remained bearish. Anecdotal evidence also suggested lower stocking by the industry in expectation of a reduction in custom duty on gold during the Union Budget, which did not happen.
With muted demand, the local market continued to remain in a persistent discount for the third consecutive month with an average discount of US$28-30/oz during the month.
Europe: Both the Bank of England and the European Central Bank continued taking the fight to their inflation problems, with each raising interest rates in early February by 50bps. Neither signalled a significant change in the current stance, amid a backdrop of elevated inflation and recent local equities and sovereign bonds strength. Consensus expectations have also shifted slightly since the start of the year, with belief that a recession in the region might be milder than had initially expected. This continued hawkishness from the region's central banks, as well as a marginally better economic outlook, may go some way to explaining why European gold ETFs saw US$2.1bn (33t) of outflows in January.
US: After another bonanza year for US retail gold investment - 2022 was the third largest year for domestic gold bar and coin demand - the US Mint reports continued appetite for gold bullion coins in January. Combined sales of Eagle and Buffalo coins in January reached 222,500 oz, although this was below the pace of recent years, which is consistent with reports of a recent softening of premiums in the market.
Central banks: Central banks added a further 28t to global official gold reserves in December, capping off a remarkable year for demand from this sector. In 2022, central bank demand totalled 1,136t, the 13th consecutive year of net purchases and an all-time record. Read more in our latest Gold Demand Trends report
ETFs: Global physically-backed gold ETFs saw net outflows of US$1.6bn (26t) in January (Table 3). This was primarily led by funds from Europe (-US$2.1bn, -33t), potentially impacted by the area's rising interest rates, appreciating currencies, and strengthening local equities. Asian funds lost US$246mn (-4t) during the month, led by outflows from China. In contrast, North American funds witnessed their second month of inflows in a row, amounting to US$572mn (9t). Funds listed in the 'Other' region also recorded positive demand (+US$104mn, +2t) during the month. Overall, global gold ETF assets under management totalled US$213bn (3,446t) by the end of January, a 5% increase from the previous month, aided by the gold price increase, even though tonnage holdings declined.
Table 3: European ETFs led small net outflows in January
Gold ETF holdings and flows by region*
| Total AUM(bn) | Fund Flows(US$mn) | Holdings(tonnes) | Demand(tonnes) | Demand(% of holdings) | |
| North America | 107.4 | 572 | 1,736.10 | 9 | 0.50% |
| Europe | 94.8 | -2,075.30 | 1,532.90 | -33 | -2.10% |
| Asia | 7.4 | -245.6 | 114.8 | -4 | -3.30% |
| Other | 3.9 | 104.3 | 62.5 | 1.7 | 2.80% |
| Total | 213.4 | -1,644.60 | 3,446.20 | -26.2 | -0.80% |
| Global inflows / Positive Demand | 2,431.90 | 16 | 1.20% | ||
| Global outflows /Negative Demand | -4,076.50 | -42.3 | -2.00% | ||
*Data to 31 January 2022. On Goldhub, see: Gold-backed ETF flows. Source: Bloomberg, Company Filings, ICE Benchmark Administration, World Gold Council
Source: Bloomberg, ICE Benchmark Administration, World Gold Council
Footnotes
1 COMEX Managed Money net long futures only as a % of open interest.
2 Investing in a future only requires an initial margin of the full investment, which provides leverage to the investment. This is currently just under 4% for the COMEX GC contract (source: Bloomberg).
Disclaimer
Important Information and Disclosures
© 2023 World Gold Council. All rights reserved. World Gold Council and the Circle device are trademarks of the World Gold Council or its affiliates.
All references to LBMA Gold Price are used with the permission of ICE Benchmark Administration Limited and have been provided for informational purposes only. ICE Benchmark Administration Limited accepts no liability or responsibility for the accuracy of the prices or the underlying product to which the prices may be referenced. Other content is the intellectual property of the respective third party and all rights are reserved to them.
Reproduction or redistribution of any of this information is expressly prohibited without the prior written consent of World Gold Council or the appropriate copyright owners, except as specifically provided below. Information and statistics are copyright © and/or other intellectual property of the World Gold Council or its affiliates (collectively, “WGC”) or third-party providers identified herein. All rights of the respective owners are reserved.
The use of the statistics in this information is permitted for the purposes of review and commentary (including media commentary) in line with fair industry practice, subject to the following two pre-conditions: (i) only limited extracts of data or analysis be used; and (ii) any and all use of these statistics is accompanied by a citation to World Gold Council and, where appropriate, to Metals Focus, Refinitiv GFMS or other identified copyright owners as their source. World Gold Council is affiliated with Metals Focus.
WGC does not guarantee the accuracy or completeness of any information nor accepts responsibility for any losses or damages arising directly or indirectly from the use of this information. This information is for educational purposes only and by receiving this information, you agree with its intended purpose. Nothing contained herein is intended to constitute a recommendation, investment advice, or offer for the purchase or sale of gold, any gold-related products or services, or any other products, services, securities, or financial instruments (collectively, “Services”). This information does not take into account any investment objectives, financial situation, or particular needs of any particular person.
Diversification does not guarantee any investment returns and does not eliminate the risk of loss. Past performance is not necessarily indicative of future results. The resulting performance of any investment outcomes that can be generated through allocation to gold are hypothetical in nature, may not reflect actual investment results, and are not guarantees of future results. WGC does not guarantee or warranty any calculations and models used in any hypothetical portfolios or any outcomes resulting from any such use. Investors should discuss their individual circumstances with their appropriate investment professionals before making any decision regarding any Services or investments.
This information contains forward-looking statements, such as statements which use the words “believes”, “expects”, “may”, or “suggests”, or similar terminology, which is based on current expectations and are subject to change. Forward-looking statements involve a number of risks and uncertainties. There can be no assurance that any forward-looking statements will be achieved. WGC assumes no responsibility for updating any forward-looking statements.
Information regarding QaurumSM and the Gold Valuation Framework
Note that the resulting performance of various investment outcomes that can be generated through use of Qaurum, the Gold Valuation Framework, and other information are hypothetical in nature, may not reflect actual investment results, and are not guarantees of future results. WGC provides no warranty or guarantee regarding the functionality of the tool, including without limitation any projections, estimates, or calculations.
Editor's Note: The summary bullets for this article were chosen by Seeking Alpha editors.
This article was written by
