My Grand Experiment: The High-Growth Portfolio

Summary
- I recently funded three IRAs, each devoted to particular types of investments.
- I provide an overview of my account devoted to high-growth stocks.
- This piece follows articles on my DGI account and my High-Yield account.
- Looking for a portfolio of ideas like this one? Members of iREIT on Alpha get exclusive access to our subscriber-only portfolios. Learn More »
chingyunsong/iStock via Getty Images
This article was co-produced with Chuck Walston
I’ll readily admit I was late getting onto the FAANG bandwagon. Aside from my predilection for investing in dividend growth stocks, I found it difficult to place a proper valuation on growth stocks.
Add to that my strong bias towards buy and hold investing and my goal of developing a passive revenue stream. After all, how can one generate income from a non-dividend bearing stock without selling shares?
Buy and hold philosophy aside, I will confess that I sold out of my FAANG positions very early in 2022. That undoubtedly contributed to my portfolio’s outperformance.
By the end of 2022, my portfolio was in positive territory. I attribute this to two factors: the bulk of my investments are in high quality companies, and my entire account through the last eleven months consisted of dividend bearing stocks. While dividend stocks often lag the markets as they climb, dividend stocks generally outperform during bear markets.
This leads me to the following observation.
Since I funded my three accounts, the High-Growth investments have outperformed both my DGI and High-Yield portfolios. Is this an anomaly, or is it a portent of things to come?
Aside from providing a comparison of three accounts, one exclusively centered on DGI investments, one devoted to High-Yield, and the third to High-Growth stocks, I will also actively trade within these accounts.
The following is an overview of each of the stocks in my High-Growth portfolio.
Barrett Business Services (BBSI)
BBSI provides business management solutions for small and mid-sized companies. The firm services over 7,500 clients through a network of over 50 branch locations in Arizona, California, Colorado, Delaware, Idaho, Maryland, Nevada, North Carolina, Oregon, Pennsylvania, Tennessee, Utah, Virginia, and Washington. BBSI provides two categories of services, including professional employer services ('PEO') and staffing.
During the most recent earnings report, BBSI guided for gross billings growth in a range of 11% to 13%. The board of directors also approved a new stock repurchase program for $75 million in stock buybacks over a two-year period. That represents over 11% of the company's current market cap of $666 million.
BBSI has a long growth runway. As of 2021, nearly 85% of US employers with 99 or fewer employees were not represented by a PEO. Furthermore, since 2008, the CAGR of the PEO industry is more than 7% higher than the CAGR for the total U.S. employed labor force. Add to that the fact that BBSI only has branch offices in 15 states.
In spite of the headwinds the company endured during the COVID crisis, BBSI increased annual gross billings and PEO at a CAGR of 14% from 2012 through 2022. Unlike most of the investments in my High-Growth portfolio, BBSI pays a quarterly dividend. The current yield is 1.25%, and the payout ratio is a bit below 19%.
Hudson Technologies (HDSN)
Hudson is a refrigerant services company with a distinct advantage over rivals. A good portion of the firm’s revenues are boosted by developments in the industry related to the AIM Act.
The AIM Act mandates a 10% reduction in the production and consumption of hydrofluorocarbon refrigerants (HFCs) in 2023 and a 40% baseline reduction in 2024. HFCs are considered to be potent greenhouse gases used in refrigeration and air conditioning devices.
According to the Environmental Protection Agency,
“The AIM Act directs EPA to sharply reduce production and consumption of these harmful pollutants by using an allowance allocation and trading program. This phasedown will decrease the production and import of HFCs in the United States by 85% over the next 15 years.”
With over 7,000 customers, Hudson also provides services to improve chiller efficiency and increase system capacity: however, the company’s AIM related products and services are the primary impetus for the firm’s continued robust growth.
Hudson operates an HFC reclamation service, providing reclaimed refrigerant to the currently installed base of equipment as HFC production is phased out. With a 35% market share, Hudson is the largest HFC reclaimer in the US, handling over 200,000 reclaimed cylinders each year.
Aside from the current demand for reclaimed refrigerant for the installed base related to AIM, the California Air Resources Board requires that OEMs use a minimum of 10% reclaimed refrigerant.
The following chart provides an overview of the HFC shortages that will prevail in coming years as the AIM Act goes into force.
Hudson Technologies 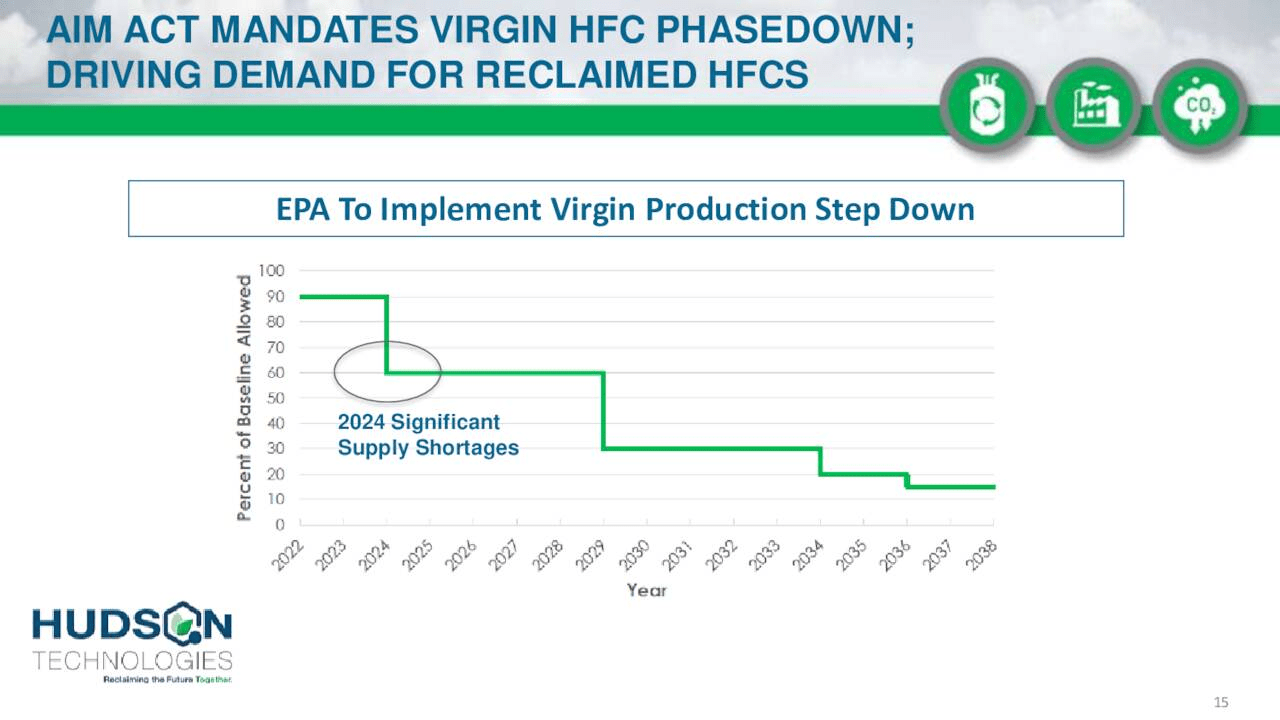
Over the past two years, YoY revenue growth stands at 30.9%.
IRadimed Corp. (IRMD)
Once again, I’m focused on a small cap growth stock. IRadimed develops and manufactures magnetic resonance imaging ('MRI') compatible medical devices, accessories and services.
IRMD is the only provider of Non-Magnetic MRI IV Infusion Pumps and Non-Magnetic MRI Patient Monitors. The firm’s portable MRI products are designed specifically for anesthesia, critical care, patient transport and sedation for use with MRIs.
IRMD is on the cutting edge of this technology, and the need for the company’s products is manifest: utilization of many of the commonly used devices in the industry can result in harm to patients.
IRMD Investor Presentation
Ferrous components in competitors’ devices can create burn risk, altered images and misdiagnoses, and can even result in projectiles. Furthermore, in some cases, a single IRMD product can replace up to three similar devices.
IRMD generated a 76.2% gross margin over the last 5 years. The company has no debt and $70 million in working capital, with a market cap of about $445 million.
IRMD Investor Presentation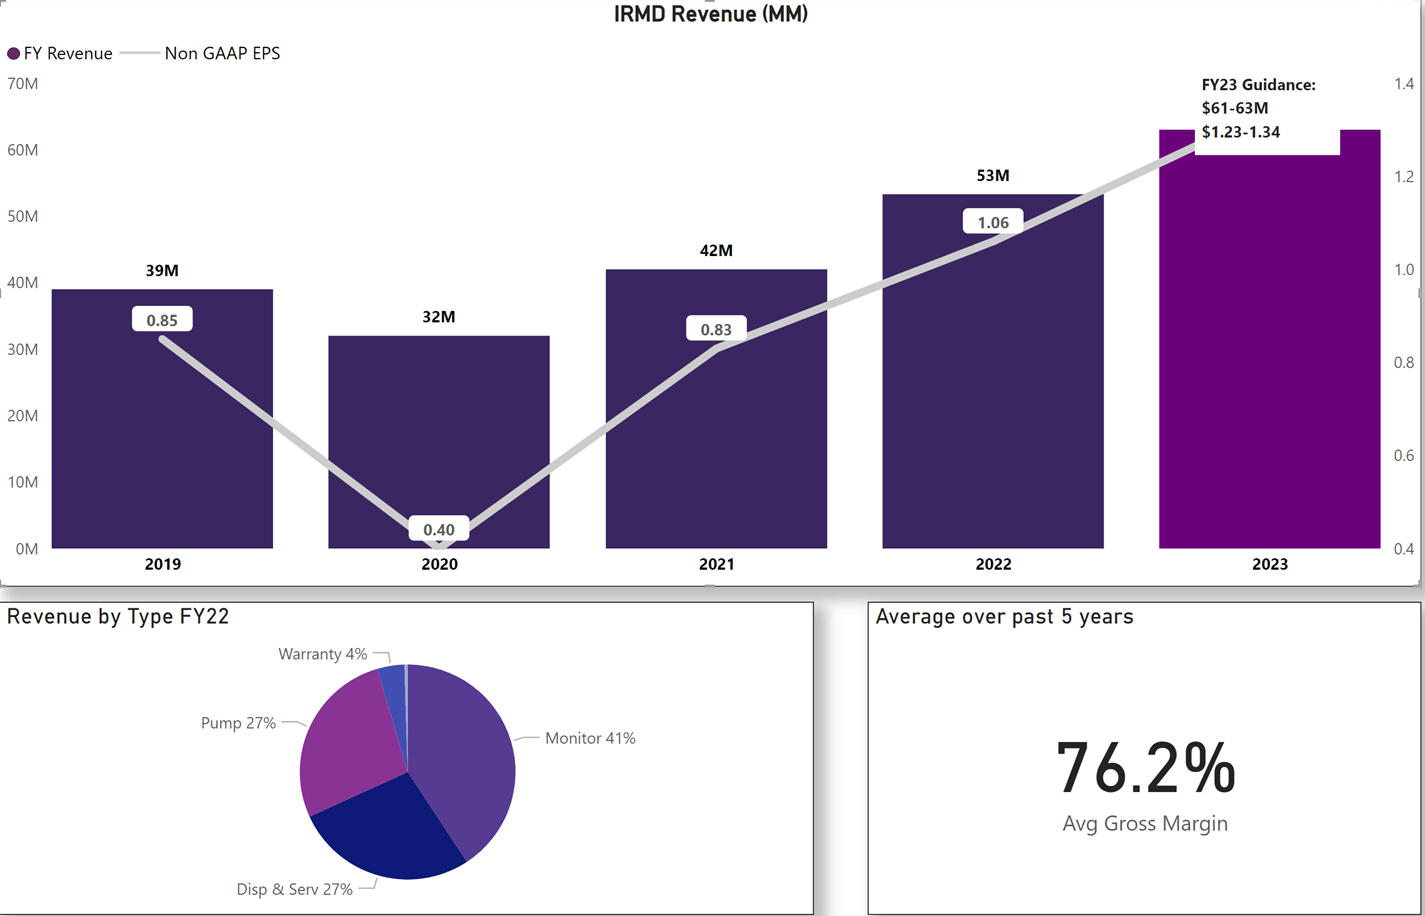
IRMD estimates that the addressable market at $3.1 billion, and management guides for 2X 2022 revenue within 3 years.
IRMD does not provide a regular dividend: however, early this month, the company announced a special dividend of $1.05.
Mastercard (MA)
Unlike the small caps I’ve reviewed so far, Mastercard is a well-known name with many investors.
There is much about MA that makes this company a superior long-term investment. Mastercard operates in an enduring duopoly with Visa (V). While some might balk at the stock’s current P/E of 30x plus, the shares now trade well below historical valuations. Furthermore, the stock has outperformed the market by wide margins over the last 5- and 10-year periods.
Like its main rival Visa, Mastercard does not issue loans; therefore, the company does not take on the credit risk that many other credit card issuers are subject to. Instead, Mastercard’s revenues are generated by fees earned from transactions the company processes through its network, as well as those paid for services such as the processing of loyalty and rewards programs, fraud detection, cybersecurity, and data analytics.
Since Mastercard’s products have near universal acceptance, this creates a network effect. The cards’ widespread acceptance by merchants increases its use by consumers and vice versa. However, this is not the only positive effect created by the scope of Mastercard’s network.
Morningstar cites Mastercard’s global market share for credit cards at 29%. The investment required to build Mastercard’s scale cannot be easily replicated and creates an enduring moat. However, adding additional consumers requires little cost and generates higher margins.
The Hackett Group (HCKT)
HCKT provides a variety of strategic business advisory and technology consulting services to Global 1000 companies.
The company’s services include benchmarking, executive advisory, business transformation and cloud enterprise application implementation, business strategy, operations, finance, human capital management, strategic sourcing, procurement and information technology.
HCKT operates in three segments:
- Oracle solutions
- SAP solutions
- Global S&BT
The firm’s Global S&BT or Strategy and Business Transformation segment is largely powered by the company’s digital platforms, including Quantum Leap, a state-of-the-art global benchmarking platform, and the Hackett Digital Transformation Platform or DTP. This segment garners the lion’s share of revenue, about 58% in the last quarter.
A report by Grand View Research forecasts a CAGR of 26.7% from 2023 to 2030 in the Digital Transformation Market. With a market cap a bit below $586 million, Hackett’s board approved an additional $120.0 million to its share repurchase plan last quarter. Management guides for long term EPS growth in a range of 15% to 20%.
HCKT has a quarterly dividend with a yield of 2.01%, with a payout ratio a bit below 30% and a 5-year dividend growth rate of 9.46%.
Marten Transport, Ltd. (MRTN)
Marten is a temperature-sensitive truckload carrier. The company focuses on transporting food and other consumer-packaged goods. MRTN operates across five revenue-generating business platforms focused on dry, temperature and time-sensitive transportation: Truckload, Dedicated, Intermodal, Brokerage and MRTN de Mexico.
Net income has been increasingly consecutively YoY for sixteen quarters.
MRTN Investor Presentation
In every year from 2018 through 2022, Marten recorded a double-digit increase in EPS. During that same time frame, with the single exception of 2019 (9% growth that year), MRTN grew operating income each year by 20% or more.
Another means of assessing the company’s rapid, consistent growth is through the following chart which records the addition of new facilities since 2009.
MRTN Investor Presentation 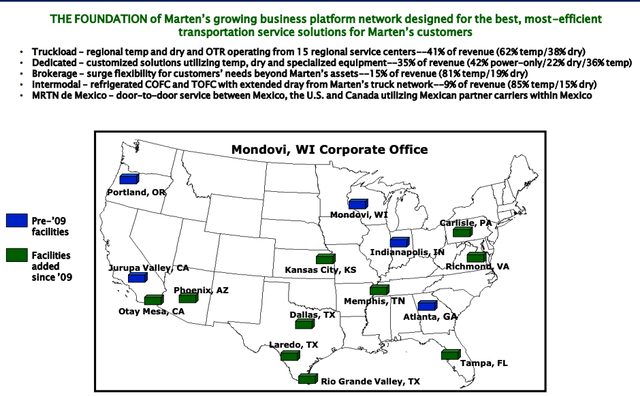
With debt of $409,000 and total cash of $80.6 million, MRTN has a very solid financial foundation.
Marten pays a quarterly dividend with a yield of 1.09%. The payout ratio is a tad below 18%, and the 5-year dividend growth rate is 35.10%.
Alphabet Inc (GOOG) (GOOGL)
Microsoft (MSFT)
GOOG is the first FAANG, along with Microsoft, that I purchased after divesting FAANG’s from my portfolio very early in 2022. Those two tickers are also the only stocks in this portfolio that I invested in prior to the 30th of January.
I will make short shrift of these two names, as the sophisticated investors that subscribe to iREIT and Dividend Kings will have a solid understanding of the two companies.
I authored an article about a month ago in which I rated GOOG as the best buy among the FAANGs in terms of current valuation. While advertising revenues are negatively impacted, I view that headwind as transitory in nature. As Alphabet controls over 90% of the global search engine market, and Chrome holds a 65% market share among web browsers, I view GOOG as a legal, enduring monopoly.
PRECEDENCE RESEARCH projects a CAGR of 9.22% for the global digital ad spending market size from 2022 to 2030.
Furthermore, YouTube and Google cloud both have long growth runways, and with a forward P/E below 18x and a 5-year PEG ratio of 1.16x, I see GOOG as trading at a very reasonable valuation.
My most recent article on Microsoft also debuted about a month ago. In that article, I rated MSFT as a weak buy.
Like Alphabet, MSFT operates a legal monopoly in the form of Microsoft Office and Microsoft 365. The only negative regarding Microsoft’s business is while that division provides a reliable, long-term revenue stream, it is not a growth machine.
I readily acknowledge that MSFT has a surefire growth driver in Azure and potential for growth in AI, advertising, and gaming. My only true concern is the law of large numbers: with a market cap of over two trillion, it will take stupendous growth to keep MSFT as a true growth stock.
The shares climbed nearly 13% since I initiated my position in MSFT on the 17th of last month.
Paychex, Inc. (PAYX)
Paychex provides payroll services, HR, and benefit services to small and medium-size firms.
The company's Management Solutions segment contributes 75% of sales while the PEO and Insurance Services segment generates 23% of revenues.
With over 730,000 clients, Paychex dominates the small-business payroll processing market. Morningstar estimates 95% of those clients are in the 1- to 49-employee small-business market. As that market is highly fragmented, and the firm only holds an 11% market share, Paychex has strong growth prospects.
Payroll and HR software is oftentimes deeply embedded in everyday business operations. This means Paychex benefits from high customer switching costs. In part, this accounts for the company’s 84% client retention rate.
PAYX provided solid Q2 results, and management guided for revenue growth of 8% and an increase in EPS in the range of 12% to 14% for FY23.
The following chart provides a picture of the company’s growth over the last half-decade.
PAYX Investor Presentation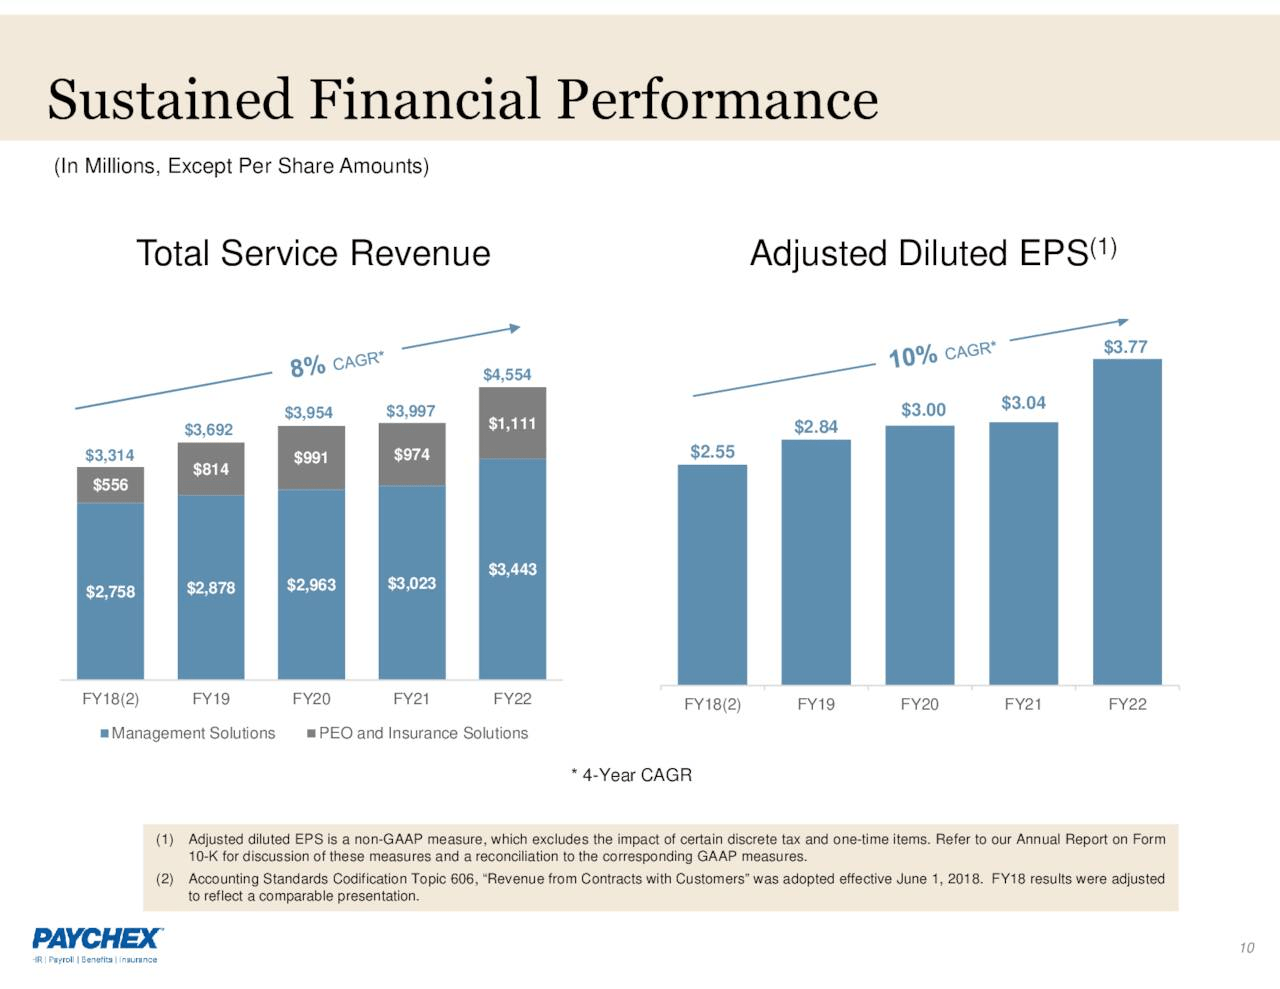
With cash and cash equivalents of $1.33 billion and debt of $808 million, PAYX has a rock-solid financial profile.
PAYX pays a dividend yielding 2.71% with a payout ratio of just over 76% and a 5-year dividend growth rate of about 10%.
Photronics, Inc. (PLAB)
Photronics is the world's leading manufacturer of photomasks for the semiconductor industry, focusing on integrated circuit and flat panel display technology.
Photomasks are used in the production of integrated circuits to produce patterns on wafer material. Several masks are used in turn, each producing a differing layer of the overall design.
Photronics’ Q4 2022 earnings, released in December, marked the fifth consecutive year of record revenue, up 24% for the fiscal year. With $824.5 million in revenue, the company generated $166 million in free cash flow.
The following chart provides a graphic display of the company’s position in the industry.
PLAB Investor Presentation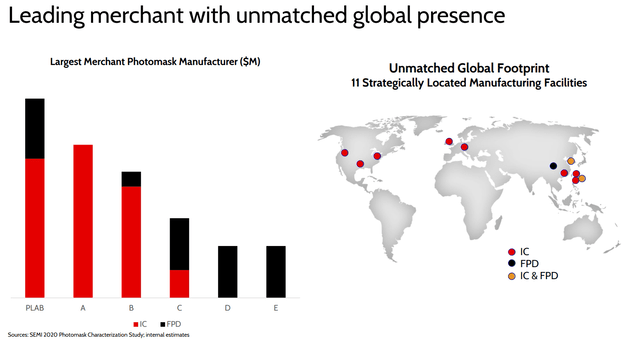
PLAB has $319.7 million in cash and equivalents and $42 million in long-term debt.
For Q1 23, management guides for revenue in a range of $203 million to $213 million and net income in a range of $0.40 to $0.48 per diluted share.
Management also provided the following forecast for expected growth into 2024.
PLAB Investor Presentation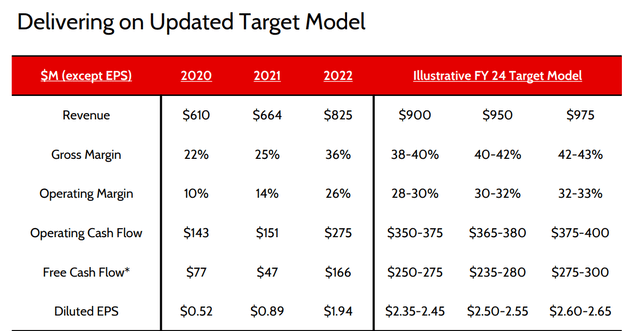
Investors should be aware that PLAB forecasts a transitory downturn in demand sometime in 2023.
P.A.M. Transportation Services (PTSI)
PTSI is a small cap truckload transportation and logistics company. It operates as a dry van carrier, transporting a variety of commodities in the US, Mexico and Canada; however, the company generates the bulk of its revenue stateside.
Q4 results released this week show operating revenues for the fiscal year up 33.9% over 2021.
In 2022, the company also increased the size of its truck fleet by approximately 28%.
PAM has $175.5 million in cash, marketable equity securities, and available liquidity under the firm’s line of credit. Outstanding debt was $264.3 million as of December 31, 2022.
PAM’s forward P/E of 8.42x is well below the stock’s 5-year average P/E of 12.23x. The TTM PEG ratio is .34x versus the sector median PEG of 0.54x.
REX American Resources (REX)
REX American Resources is a corn refiner and distiller, focused on ethanol production. The company has interests in six ethanol production facilities. The firm’s share of production from those plants over the last twelve months totaled approximately 277 million gallons.
The IEA forecasts the global demand for biofuels will increase by 28% from 2021 through 2026.
An initiative by the governors of Iowa, Minnesota and several other Midwest states to allow greater use of E15 gasoline could result in a surge in demand for ethanol. As the US Midwest grows the majority of the corn in the country, there is a great deal of goodwill to be gained from constituents in these states should politicians prevail.
REX has approximately $290 million in cash and equivalents and virtually zero debt.
The company repurchased 25% of float over the last decade. REX bought back approximately 250,000 shares last quarter, and the board authorized another 875,000 shares for repurchase, which amounts to approximately 5% of the 17.4 million shares outstanding.
When one divides the number of shares outstanding into the company’s cash hoard, it comes out to nearly $17 per share, approximately half of the stock’s current share price.
Sterling Infrastructure (STRL)
Sterling is a leading infrastructure service provider of e-infrastructure, building and transportation solutions. Strong demand for data centers and e-commerce warehouses gives the company momentum going into 2023.
At the end of last quarter, Sterling’s combined backlog hit an all-time high of $1.9 billion, a 25% year-over year increase. The backlog for the Transportation Solutions segment, which represented 40% of the firm’s revenue, has a record margin of over 11%.
Sterling also reported a record cash balance for the company of $146.5 million.
The following chart provides insight into Sterling’s growth over the last few years.
STRL Investor Presentation 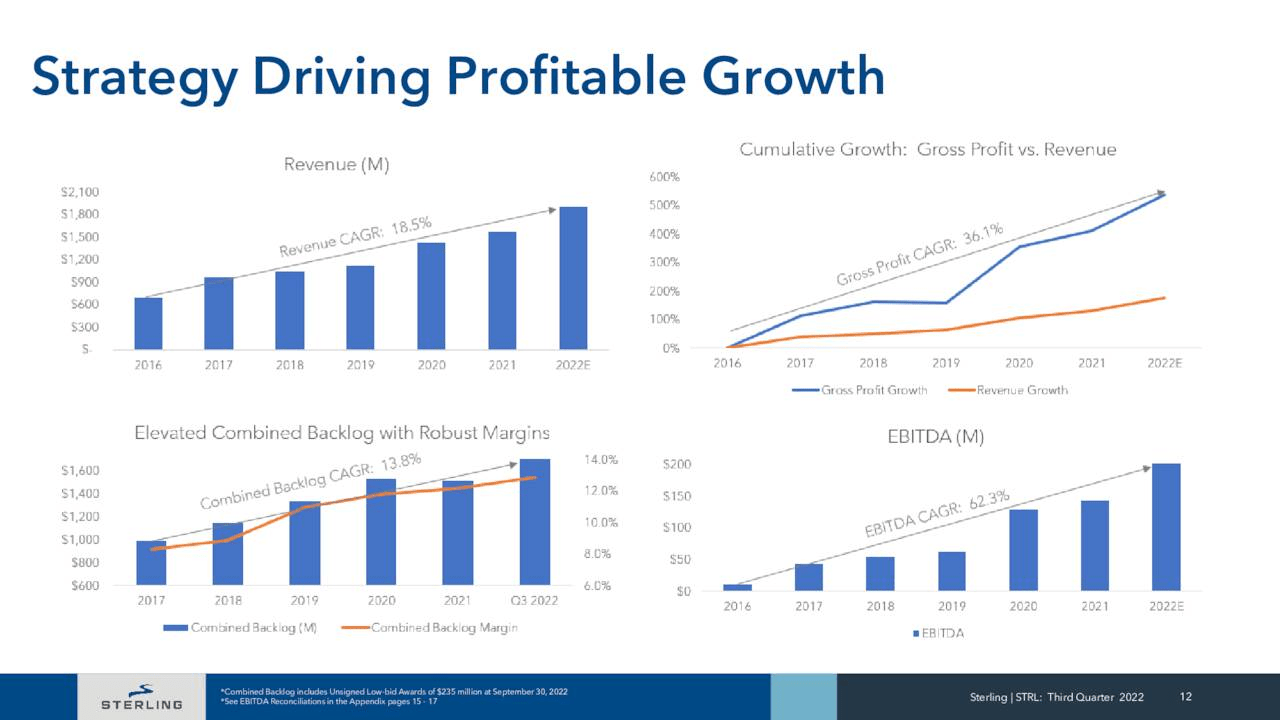
Sterling’s 5-year PEG ratio of 0.58x is well below the sector median of 1.71x.
The company also landed on Forbes’ 2023 America’s Best Small Companies List and made the grade with a 2023 Barron’s Roundtable Stock Pick.
Apple Inc. (AAPL)
I will not go into great depth regarding Apple as most investors are more than familiar with the company. One can argue that AAPL is a prime example of Buffett’s "wonderful company at a fair price." However, even with the share price falling nearly 10% over the last twelve months, the stock still trades with a P/E ratio in the mid-20s. Furthermore, the 5-year PEG of 2.47x is not that of a turbocharged growth stock.
Apple has a top-notch credit rating and held $165.5 billion in cash and equivalents at the end of last quarter. Furthermore, the company generates over $100 billion a year in free cash flow.
But once again AAPL, like Microsoft, is the victim of the law of large numbers.
Apple is my smallest position in this account. I hold it more due to my perception of market sentiment than any belief that it will grow at a rapid rate.
Encore Wire (WIRE)
On the first day of December, my article on WIRE hit iREIT and The Dividend Kings. Since that piece debuted, the share price surged over 33%.
WIRE reported blockbuster Q4 results early this week. GAAP EPS of $8.28 beat analysts’ estimates by $2.45, and revenue of $693.88 million beat consensus by $62.85 million.
The company is easy to understand. WIRE sells copper and aluminum building wires and cables. It competes on price and customer service, and it excels in the latter pursuit. Copper wire generates between 85% to 88% of revenue while aluminum wire garners the remainder of sales.
WIRE has no debt and holds $730.6 million in cash at the end of the last quarter.
During 2022, the company repurchased 2,055,470 shares at an average price of $120.47, including 161,701 shares repurchased at an average price of $138.53 in the fourth quarter.
Since the first quarter of 2020, WIRE repurchased 2,972,277 shares of common stock for a total cash outlay of $311.6 million.
To place that in context, the company has a market cap of $3.55 billion with 18.3 million shares outstanding.
Summation
This article is the third in a series outlining my “Grand Experiment.”
It's my goal to compare total returns for a DGI account, a High-Yield account, and a High-Growth account.
In addition to comparing returns for the differing investment strategies, it is my goal to test the newest iteration of my rating system. I’ve evolved a rating system over many years that aids me in evaluating stocks. Over the last year, I believe I’ve improved it to the point that it oftentimes eliminates poor performers and highlights stocks with great potential.
While I have a great degree of overall confidence in my rating system, I do not want readers to misinterpret my intent. No system works well unless the investor conducts due diligence.
In part, I will use my system to determine when I will trade out of stocks in the three portfolios devoted to the Grand Experiment. Note that I am largely a buy and hold investor, so actively trading will be a part of the experiment, and I generally avoid high growth stocks. However, I believe my rating system provides an edge in evaluating high growth names in particular.
I note that of the three accounts involved in this experiment, the High-Growth portfolio is besting the other two by a wide margin and is also leading the market. The account has increased in value by nearly 6% this month.
Obviously, this is too short of a period to make a real assessment, and the result could be a statistical anomaly. Nonetheless, it is encouraging.
Author's note: Brad Thomas is a Wall Street writer, which means he's not always right with his predictions or recommendations. Since that also applies to his grammar, please excuse any typos you may find. Also, this article is free: Written and distributed only to assist in research while providing a forum for second-level thinking.
Get My New Book For Free!
Join iREIT on Alpha today to get the most in-depth research that includes REITs, mREIT, Preferreds, BDCs, MLPs, ETFs, and we recently added Prop Tech SPACs to the lineup. Nothing to lose with our FREE 2-week trial.

And this offer includes a 2-Week FREE TRIAL plus my FREE book.
This article was written by

Brad Thomas is the CEO of Wide Moat Research ("WMR"), a subscription-based publisher of financial information, serving over 10,000 investors around the world. WMR has a team of experienced multi-disciplined analysts covering all dividend categories, including REITs, MLPs, BDCs, and traditional C-Corps.
The WMR brands include: (1) iREIT on Alpha (Seeking Alpha), and (2) The Dividend Kings (Seeking Alpha), and (3) Wide Moat Research. He is also the editor of The Forbes Real Estate Investor.
Thomas has also been featured in Barron's, Forbes Magazine, Kiplinger’s, US News & World Report, Money, NPR, Institutional Investor, GlobeStreet, CNN, Newsmax, and Fox.
He is the #1 contributing analyst on Seeking Alpha in 2014, 2015, 2016, 2017, 2018, 2019, 2020, 2021, and 2022 (based on page views) and has over 106,000 followers (on Seeking Alpha). Thomas is also the author of The Intelligent REIT Investor Guide (Wiley) and is writing a new book, REITs For Dummies.
Thomas received a Bachelor of Science degree in Business/Economics from Presbyterian College and he is married with 5 wonderful kids. He has over 30 years of real estate investing experience and is one of the most prolific writers on Seeking Alpha. To learn more about Brad visit HERE.Disclosure: I/we have no stock, option or similar derivative position in any of the companies mentioned, and no plans to initiate any such positions within the next 72 hours. I wrote this article myself, and it expresses my own opinions. I am not receiving compensation for it (other than from Seeking Alpha). I have no business relationship with any company whose stock is mentioned in this article.
Additional disclosure: Chuck Walston holds long positions in the shares of BBSI, HDSN, IRMD, MA, HCKT, MRTN, GOOG, GOOGL, MSFT, PAYX, PLAB, PTSI, REX, STRL, AAPL, WIRE.