VIS: Industrials Dashboard For February

Summary
- Transportation still looks attractive regarding value and quality scores.
- Other subsectors are overvalued by more than 24% relative to historical averages.
- We discuss Vanguard Industrials ETF, an alternative to XLI.
- 10 industrial stocks cheaper than their peers in February.
- Quantitative Risk & Value members get exclusive access to our real-world portfolio. See all our investments here »
Asia-Pacific Images Studio
This monthly article series shows a dashboard with aggregate subsector metrics in industrials. It is also a review of sector ETFs (exchange-traded funds) like the Industrial Select Sector SPDR ETF (XLI), the Fidelity MSCI Industrials Index ETF (FIDU) and the Vanguard Industrials ETF (NYSEARCA:VIS), whose largest holdings are used to calculate these metrics.
Shortcut
The next two paragraphs in italic describe the dashboard methodology. They are necessary for new readers to understand the metrics. If you are used to this series or if you are short of time, you can skip them and go to the charts.
Base Metrics
I calculate the median value of five fundamental ratios for each subsector: Earnings Yield ("EY"), Sales Yield ("SY"), Free Cash Flow Yield ("FY"), Return on Equity ("ROE"), Gross Margin ("GM"). The reference universe includes large companies in the U.S. stock market. The five base metrics are calculated on trailing 12 months. For all of them, higher is better. EY, SY and FY are medians of the inverse of Price/Earnings, Price/Sales and Price/Free Cash Flow. They are better for statistical studies than price-to-something ratios, which are unusable or non available when the "something" is close to zero or negative (for example, companies with negative earnings). I also look at two momentum metrics for each group: the median monthly return (RetM) and the median annual return (RetY).
I prefer medians to averages because a median splits a set in a good half and a bad half. A capital-weighted average is skewed by extreme values and the largest companies. My metrics are designed for stock-picking rather than index investing.
Value and Quality Scores
I calculate historical baselines for all metrics. They are noted respectively EYh, SYh, FYh, ROEh, GMh, and they are calculated as the averages on a look-back period of 11 years. For example, the value of EYh for transportation in the table below is the 11-year average of the median Earnings Yield in transportation companies. The Value Score ("VS") is defined as the average difference in % between the three valuation ratios (EY, SY, FY) and their baselines (EYh, SYh, FYh). The same way, the Quality Score ("QS") is the average difference between the two quality ratios (ROE, GM) and their baselines (ROEh, GMh).
The scores are in percentage points. VS may be interpreted as the percentage of undervaluation or overvaluation relative to the baseline (positive is good, negative is bad). This interpretation must be taken with caution: the baseline is an arbitrary reference, not a supposed fair value. The formula assumes that the three valuation metrics are of equal importance.
Current Data
The next table shows the metrics and scores as of last week's closing. Columns stand for all the data named and defined above.
VS | QS | EY | SY | FY | ROE | GM | EYh | SYh | FYh | ROEh | GMh | RetM | RetY | |
Aerospace+Defense | -27.25 | -14.67 | 0.0451 | 0.5224 | 0.0250 | 16.63 | 19.64 | 0.0536 | 0.7687 | 0.0378 | 20.37 | 22.07 | 2.73% | 10.97% |
Building+Equipment | -48.27 | 17.48 | 0.0300 | 0.2978 | 0.0109 | 11.48 | 30.89 | 0.0424 | 0.8128 | 0.0228 | 9.75 | 26.37 | 0.77% | 9.47% |
Machinery+Conglomerates | -32.12 | 4.21 | 0.0365 | 0.3707 | 0.0184 | 21.05 | 37.63 | 0.0490 | 0.5418 | 0.0303 | 19.37 | 37.73 | -0.17% | 10.86% |
Services+Distribution | -24.12 | 19.12 | 0.0361 | 0.3155 | 0.0198 | 35.03 | 44.48 | 0.0399 | 0.4595 | 0.0289 | 23.69 | 49.24 | -0.02% | 7.42% |
Transportation | 18.83 | 4.43 | 0.0541 | 1.1003 | 0.0216 | 28.58 | 23.52 | 0.0542 | 0.7176 | 0.0209 | 23.74 | 26.58 | 1.47% | -5.58% |
Value and Quality Chart
The next chart plots the Value and Quality Scores by subsector (higher is better).
Value and quality in industrials (Chart: author; data: Portfolio123)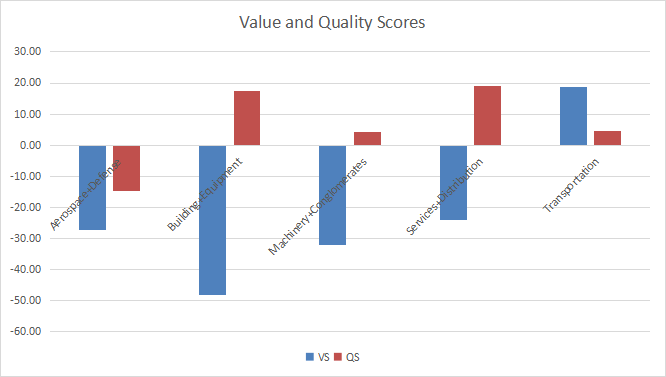
Evolution Since Last Month
The value score has improved in aerospace/defense, machinery/conglomerates and services/distribution. Both scores have deteriorated in transportation.
Variations in value and quality (Chart: author; data: Portfolio123)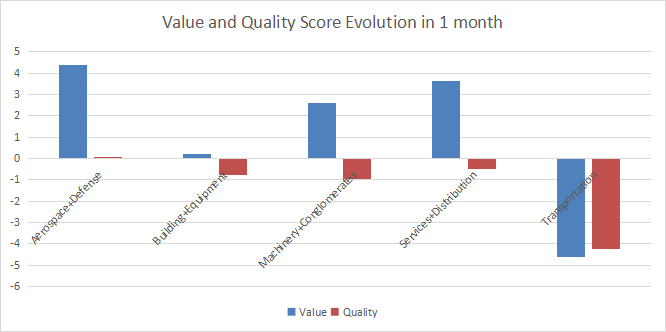
Momentum
The next chart plots momentum data.
Momentum in industrials (Chart: author; data: Portfolio123)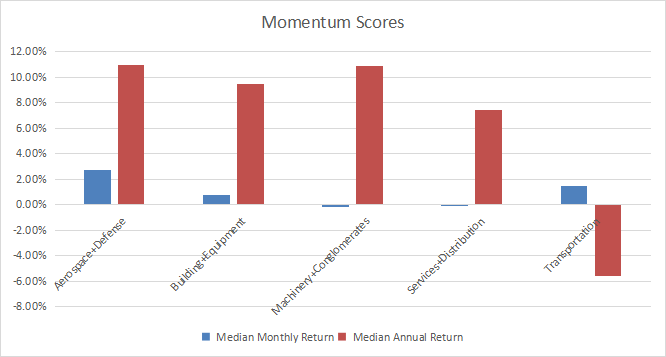
Interpretation
Transportation is undervalued by about 19% relative to 11-year averages, and the quality score is above the baseline. Other subsectors are overvalued by 24% to 48% regarding the same metrics. Overvaluation may be partly justified by good quality scores for building/construction/electric equipment and services/distribution. Aerospace/defense is below the baseline in both value and quality.
Focus on VIS
The Vanguard Industrials ETF (VIS) has been tracking the MSCI US IMI Industrials 25/50 Index since 09/23/2004. It has a total expense ratio of 0.10%, the same as XLI, and marginally more expensive than FIDU (0.08%). Shares are also available through a mutual fund (VINAX).
As of writing, the fund has 372 holdings. The next table shows the top 10 names with some fundamental ratios. Their aggregate weight is 30.5%.
Ticker | Name | Last | EPS growth %TTM | P/E TTM | P/E fwd | Yield% |
Raytheon Technologies Corp. | 3.75% | 36.63 | 28.85 | 20.11 | 2.18 | |
Honeywell International, Inc. | 3.57% | -8.10 | 27.42 | 21.96 | 2.07 | |
United Parcel Service, Inc. | 3.44% | -10.07 | 14.05 | 16.16 | 3.49 | |
Caterpillar, Inc. | 3.38% | 6.77 | 19.49 | 15.56 | 1.95 | |
Union Pacific Corp. | 3.24% | 12.58 | 17.87 | 17.33 | 2.59 | |
Deere & Co. | 3.12% | 22.84 | 17.28 | 14.31 | 1.19 | |
The Boeing Co. | 3.05% | -16.33 | N/A | 978.85 | 0 | |
Lockheed Martin Corp. | 2.81% | -4.65 | 21.71 | 17.48 | 2.55 | |
General Electric Co. | 2.24% | -126.93 | N/A | 43.39 | 0.38 | |
Illinois Tool Works, Inc. | 1.86% | 14.81 | 24.30 | 24.97 | 2.21 |
The heaviest industry in the fund is aerospace/defense (17.8%). VIS has many more holdings than XLI (372 large to small caps vs. 70 large and mid caps). However, their return and risk metrics since VIS inception are almost identical (reported in the next table).
Total Return | Annual. Return | Drawdown | Sharpe | Volatility | |
VIS | 417.58% | 9.36% | -63.51% | 0.49 | 19.33% |
XLI | 417.05% | 9.35% | -62.26% | 0.5 | 18.88% |
In summary, VIS is a fund with cheap management fees for investors seeking capital-weighted exposure in industrials. No holding weighs more than 4% of asset value, so risks related to individual stocks are moderate. VIS and XLI are equivalents for buy-and-hold investors. However, higher trading volumes make XLI a better instrument for traders and tactical allocation strategies. Investors looking for a balanced portfolio in industrials may prefer the Invesco S&P 500 Equal Weight industrials ETF (RGI), whose top holding weighs less than 2%.
Dashboard List
I use the first table to calculate value and quality scores. It may also be used in a stock-picking process to check how companies stand among their peers. For example, the EY column tells us that a transportation company with an Earnings Yield above 0.0541 (or price/earnings below 18.48) is in the better half of the subsector regarding this metric. A Dashboard List is sent every month to Quantitative Risk & Value subscribers with the most profitable companies standing in the better half among their peers regarding the three valuation metrics at the same time. The list below was sent to subscribers several weeks ago based on data available at this time.
The Brink's Co. | |
Matson, Inc. | |
Boise Cascade Co. | |
Builders FirstSource, Inc. | |
Encore Wire Corp. | |
Titan International, Inc. | |
XPO, Inc. | |
Vontier Corp. | |
Carrier Global Corp. | |
Lockheed Martin Corp. |
It is a rotating list with a statistical bias toward excess returns on the long-term, not the result of an analysis of each stock.
Quantitative Risk & Value (QRV) features data-driven strategies in stocks and closed-end funds outperforming their benchmarks since inception. Get started with a two-week free trial now.

This article was written by

Step up your investing experience: try Quantitative Risk & Value for free now (limited offer).
I am an individual investor and an IT professional, not a finance professional. My writings are data analysis and opinions, not investment advice. They may contain inaccurate information, despite all the effort I put in them. Readers are responsible for all consequences of using information included in my work, and are encouraged to do their own research from various sources.
Disclosure: I/we have a beneficial long position in the shares of UPS either through stock ownership, options, or other derivatives. I wrote this article myself, and it expresses my own opinions. I am not receiving compensation for it (other than from Seeking Alpha). I have no business relationship with any company whose stock is mentioned in this article.