The Bullish Narrative Is Strengthening

Summary
- Retail sales were not as strong as perceived.
- The economy continues to grow, while inflation recedes, strengthening the soft-landing scenario.
- A return to real income growth should offset a return to pre-pandemic levels of savings.
- The market internals continues to suggest the broad market grinds higher.
- This idea was discussed in more depth with members of my private investing community, The Portfolio Architect. Learn More »
niphon
Weak openings that are followed by strong closes are the building blocks to a new bull market, and we had another one of those yesterday with the major market averages finishing at their highs for the session. The reason the stock market continues to levitate in the face of tightening monetary policy is that inflation is gradually receding, while the economy remains strong enough to prolong the expansion. Yesterday's sign of strength was a sizzling retail sales report for the month of January in which spending surged by the most in almost two years.
Finviz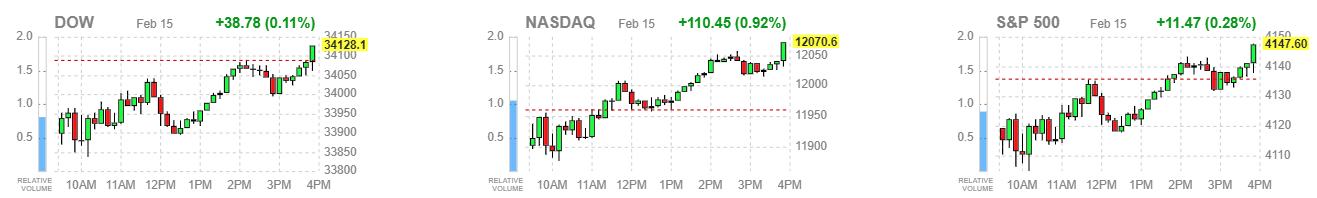
Retail sales rose 3% with every category other than gasoline realizing a monthly gain. The largest increases came from department stores (+17.5%), bars and restaurants (+7.2%), and vehicles (+5.9%). To be fair, there were some easy comparisons, as sales declined in both November and December. We also had extremely warm weather across the country compared to an ice cold December, which clearly energized consumers who spent gift cards received over the holidays. Auto sales got a temporary boost from fleet sales to rental companies. Lastly, recipients of Social Security received an 8.7% cost-of-living increase that started in January, which surely boosted discretionary spending. Therefore, we are likely to see a much weaker number in February, but that doesn't detract from the fact that the economy continues to grow.
Bloomberg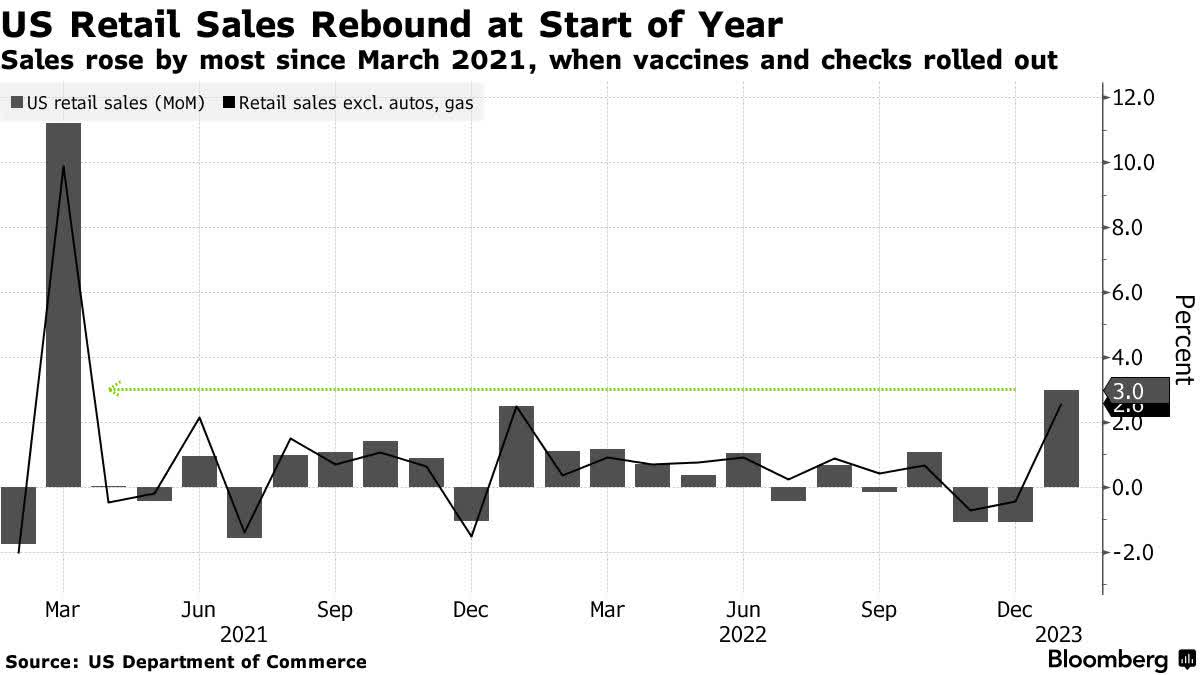
For pundits who are less enthusiastic about the soft landing scenario, this strong number was an opportunity to warn investors that an overheating economy will now force the Fed to raise short-term rates as high as 6%. That's a silly conclusion on the basis of one monthly number when the average of the past several months suggests that real sales growth remains very modestly positive. The retail sales report is not adjusted for inflation, which is why I am far more interested in real retail sales growth over the past year. Recessions typically start when real retail sales decline within a range of 1-3% on a year-over-year basis. In January, we saw a very modest increase of 0.3%. That's not too hot or too cold, but just right. It's also frustrating for the bearish consensus that was convinced the consumer would have folded by now under the weight of inflation and rising interest rates.
FRED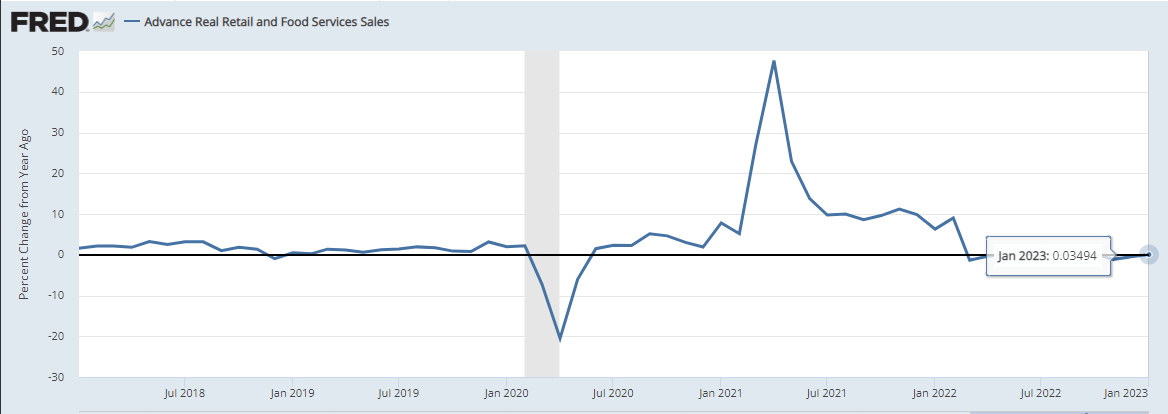
What was underappreciated at the end of last year was more than $1 trillion in excess savings, a service sector that is still recovering jobs lost during the pandemic, and a huge pay increase for retirees. A new development I also see as being underappreciated later this year is a return to real income growth. As the rate of inflation recedes further, annualized income growth should start to exceed price increases just as savings return to pre-pandemic levels. That should help sustain real consumer spending growth, which is the engine of our economy.
BLS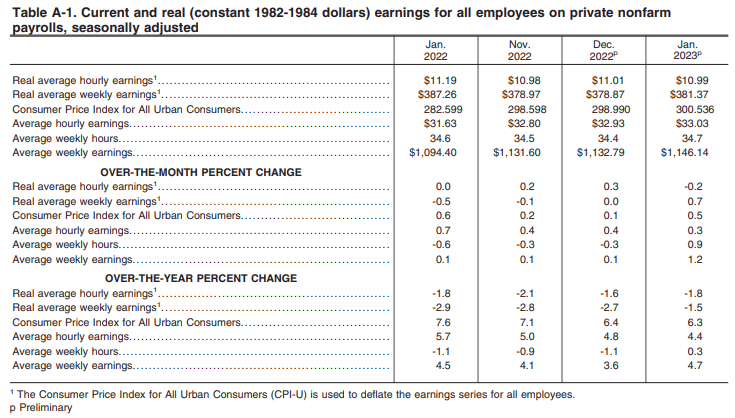
The Consumer Price Index report showed that real (inflation-adjusted) average weekly earnings for all employees declined 1.5% in January, but that was an improvement from a decline of 2.7% in December and 2.8% in November. This figure should return to growth this summer. The bullish narrative is strengthening week by week.
I want to follow up on technician Walter Deemer's Breakaway Momentum indicator, which I shared with readers one month ago when it registered a rare buy signal with the S&P 500 closing at 3,983. That gave me a lot more confidence that the major market averages could continue climbing, despite the hefty headwinds they faced. The S&P 500 has now closed higher two weeks and one month after the buy signal was registered with the index climbing to 4,090 last week for a gain of 2.7%. That is very close to the average gain of 3.3% over the previous 24 buy signals. The probability of a gain increases to 92% when we go another month out, and it increases to 96% after six months.
TheStreet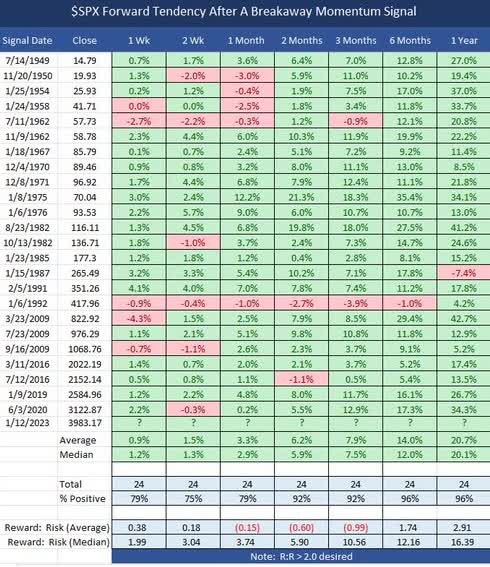
Lots of services offer investment ideas, but few offer a comprehensive top-down investment strategy that helps you tactically shift your asset allocation between offense and defense. That is how The Portfolio Architect compliments other services that focus on the bottom-ups security analysis of REITs, CEFs, ETFs, dividend-paying stocks and other securities.
This article was written by

Lawrence is the publisher of The Portfolio Architect. He has more than 25 years of experience managing portfolios for individual investors. He began his career as a Financial Consultant in 1993 with Merrill Lynch and worked in the same capacity for several other Wall Street firms before realizing his long-term goal of complete independence when he founded Fuller Asset Management. He graduated from the University of North Carolina at Chapel Hill with a B.A. in Political Science in 1992.
Disclosure: I/we have no stock, option or similar derivative position in any of the companies mentioned, and no plans to initiate any such positions within the next 72 hours. I wrote this article myself, and it expresses my own opinions. I am not receiving compensation for it (other than from Seeking Alpha). I have no business relationship with any company whose stock is mentioned in this article.
Additional disclosure: Lawrence Fuller is the Principal of Fuller Asset Management (FAM), a state registered investment adviser. Information presented is for educational purposes only intended for a broad audience. The information does not intend to make an offer or solicitation for the sale of purchase of any specific securities, investments, or investment strategies. Investments involve risk and are not guaranteed. FAM has reasonable belief that this marketing does not include any false or material misleading statements or omissions of facts regarding services, investment, or client experience. FAM has reasonable belief that the content as a whole will not cause an untrue or misleading implication regarding the adviser’s services, investments, or client experiences. Past performance of specific investment advice should not be relied upon without knowledge of certain circumstances or market events, nature and timing of investments and relevant constraints of the investment. FAM has presented information in a fair and balanced manner. FAM is not giving tax, legal, or accounting advice.
Mr. Fuller may discuss and display charts, graphs, formulas, and stock picks which are not intended to be used by themselves to determine which securities to buy or sell, or when to buy or sell them. Such charts and graphs offer limited information and should not be used on their own to make investment decisions. Consultation with a licensed financial professional is strongly suggested. The opinions expressed herein are those of the firm and are subject to change without notice. The opinions referenced are as of the date of publication and are subject to change due to changes in market or economic conditions and may not necessarily come to pass.