SGDM: Better Than GDX?

Summary
- SGDM’s underlying benchmark is tilted towards large cap companies with sound fundamentals.
- In theory, this could lead to superior performance, compared to a simple market-cap weighting.
- However, the sole focus on US and Canada may be a drag.
- The performance of SGDM has been virtually identical to that of GDX.
All_About_Najmi/iStock via Getty Images
In my latest article, I compared two of the most popular gold ETFs – VanEck Vectors Gold Miners ETF (NYSEARCA:GDX) and the VanEck Vectors Junior Gold Miners ETF (NYSEARCA:GDXJ). The comparison indicated that larger companies tend to do better, as GDX has outperformed its smaller counterpart. Now, I’d like to bring to your attention a less known gold ETF – Sprott Gold Miners ETF (NYSEARCA:SGDM), which is also focused on large cap companies, but in addition employs weighting adjustments based on fundamentals. In theory, this could give it the upper hand to a fund, which is entirely market-cap weighted like GDX. However, the data indicates that the performance of the two instruments has been very similar, and it’s hard to argue that SGDM is superior.
SGDM and GDX overview
The Sprott Gold Miners ETF is designed to track the Solactive Gold Miners Custom Factors Total Return Index. However, SGDM is not aiming for full replication as generally 90% of the portfolio is invested in the underlying index, while the rest gives management some discretion. When it comes to the structure of the index, it’s market capitalization weighted. However, there’s a constraint – components with greater than 4.5% weight should not exceed 50% of the total portfolio. Also, there is a weight adjustment of up to 3.5% (upward or downward) based on company’s fundamentals. The adjustment is made as companies are ranked by certain criteria and the ones with the best results could receive nominal addition of up to 3.5%, while the poorest performance could have up to 3.5% subtracted by their weight. The ranking criteria are as follows:
1. Quarterly Revenue Growth: Calculated as the most recent available quarterly revenue data for each Index Component divided by the quarterly revenue data available one year earlier. Index components are ranked from the highest Quarterly Revenue Growth rate (i.e. rank 1) to the lowest Quarterly Revenue Growth rate (i.e. rank of the index universe size).
2. Long-Term Debt to Equity: Index components are ranked from the lowest Long-Term Debt to Equity rank (i.e. rank 1) to the highest Long-Term Debt to Equity rank (i.e. rank of the index universe size).
3. Free Cash Flow Yield: Index components are ranked from the highest Free Cash Flow Yield rank (i.e. rank 1) to the lowest Free Cash Flow Yield rank (i.e. rank of the index universe size).
I like the idea of such a fundamental element in the index, hence SGDM’s construction. Companies with better fundamentals should be able to sustain an unfavourable market environment longer and have greater ability to fund its expansion. Also, SGDM includes only companies that are listed on major US and Canadian exchanges.
On the other hand, there’s no fundamental element in GDX’s construction. Its underlying index – the NYSE Arca Gold Miners Index, is market-cap weighted, with the only constraint being that the components with more than 4.5% weight should not amount to more than 45% of the total portfolio.
SGDM and GDX key characteristics (etfdb.com)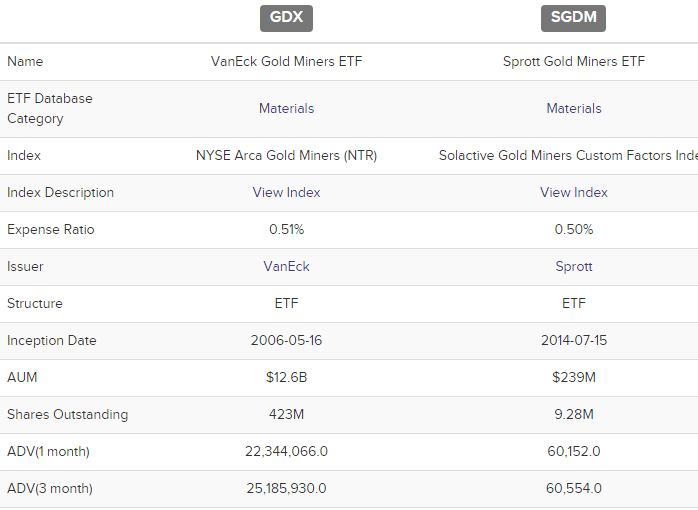
Looking at the cost profile of the ETFs, it’s apparent that they pretty much have an identical expense ratio of 0.5%. The dividend policies of the funds are also similar as they make annual distributions and the dividend yields are not that far apart (1.6% for GDX and 1.4% for SGDM). However, GDX is much larger, as its AUM is more than 50x that of SGDM. The former is also a lot more liquid than its counterpart. This could be key for institutional investors or even for some retail clients with larger portfolios, as liquidity may be an issue with SGDM. Still, most individual investors should find it sufficient for their needs.
Top 10 holdings (VanEck, Sprott, compiled by the author)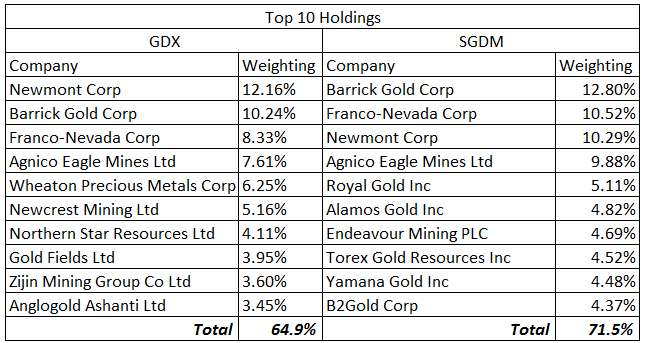
When it comes to their holdings, GDX appears slightly more diversified as it has 49 components, while SDGM has only 31. Also, the former is less concentrated in its top 10 positions. The overall overlap between the two funds is 57.8%, which leaves the remaining 42.2% to make the difference in performance. Speaking of difference, looking at the top 10 holdings the focus of SGDM on US and Canadian companies is evident as the Australian mining majors Newcrest Mining (OTCPK:NCMGF) and Northern Star Resources (OTCPK:NESRF) are absent from the fund’s portfolio.
Implications of the differences
While both ETFs are very similar in terms of direct expenses to the investors and the overlap between their holdings is quite high – 57.8%, the differences could theoretically make one superior to the other. When it comes to indirect cost – the much lower liquidity could be a problem for institutions or even large retail clients to exit SGDM in a timely manner. Also, the exclusion of precious metals mining majors with primary listing outside US or Canada leaves out the Australian giants. One of them – Newcrest Mining is being targeted by Newmont for acquisition. If the acquisition happens under higher than current market prices, this could impact positively GDX, which holds the Australian miner, while SGDM won’t benefit at all.
On the other hand, the fundamental element in SGDM’s weighting is compelling. Penalizing companies with poorer fundamentals and rewarding those on solid footing could potentially yield better results than simply leaving the market cap weighting as it is.
Performance track record
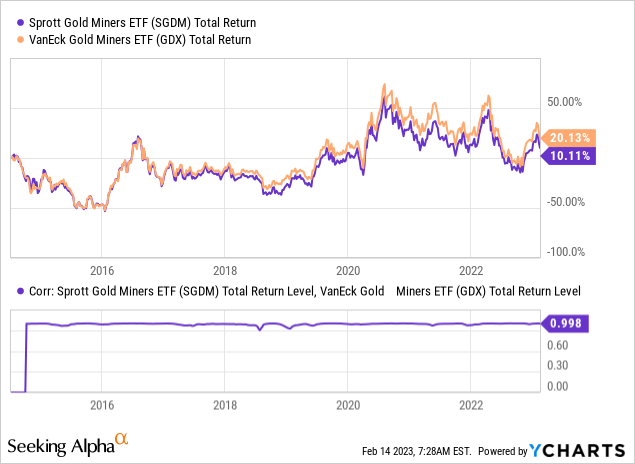
In order to assess whether these differences lead to actual superiority of one over the other in terms of performance, I’ll look at a long 10-year period. It turns out, that GDX has done better than its counterpart, but the dispersion appears to be from the beginning of the period. Also, the correlation between the two instruments is almost perfect.
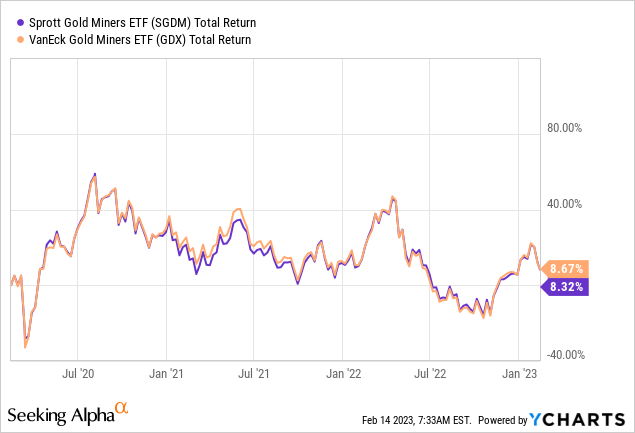
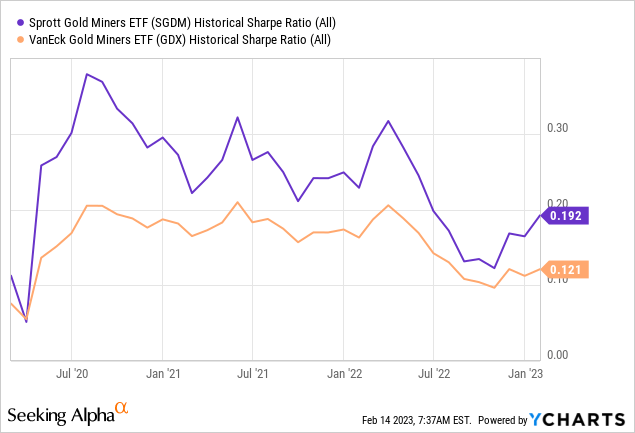
In a shorter time period of 3 years, the performance of the two funds is virtually identical. So despite the overlap between the portfolios of below 60%, the actual results indicate that the difference in holdings didn’t lead to difference in performance. Still, on a risk-adjusted basis, it appears that the fundamental tilt towards more solid companies has some merits, as the Sharpe ratio of SGDM has been slightly higher than that of GDX.
Takeaway
After looking at the data, it’s hard to argue that SGDM is inherently better than GDX. Total return has been pretty much identical for the two funds in the last three years. While SGDM has demonstrated slightly higher Sharpe ratio, it’s much lower liquidity might be a problem for some market participants. Going with either of the two options should be a viable option for most retail investors, who are bullish on gold and seek and exposure through an ETF.
Editor's Note: This article discusses one or more securities that do not trade on a major U.S. exchange. Please be aware of the risks associated with these stocks.
This article was written by

Disclosure: I/we have no stock, option or similar derivative position in any of the companies mentioned, and no plans to initiate any such positions within the next 72 hours. I wrote this article myself, and it expresses my own opinions. I am not receiving compensation for it (other than from Seeking Alpha). I have no business relationship with any company whose stock is mentioned in this article.