CSB: Impressive 3.30% Dividend Yield, But Still Unappealing

Summary
- CSB is a volatility-weighted small-cap ETF that yields 3.30%. Its long-term performance is solid compared to peers, but weak fundamentals led to disappointing returns last year.
- CSB overweights Consumer Discretionary stocks, an odd feature for a portfolio that's designed to lessen risk. It's one clue that CSB isn't the best way to play defense.
- My fundamental analysis revealed poor growth and earnings momentum compared to funds like IWN, AVUV, and SLYV. Investors also sacrifice a huge amount of profitability with small caps in general.
- While CSB's dividend yield is attractive, large-cap dividend ETFs like SCHD have similar yields with twice the dividend growth. It's hard to make a case for it other than diversification for diversification's sake.
- Looking for more investing ideas like this one? Get them exclusively at Hoya Capital Income Builder. Learn More »
syahrir maulana
Investment Thesis
When I reviewed the VictoryShares US Small Cap High Dividend Volatility Weighted ETF (NASDAQ:CSB) in January 2022, it was the best-performing volatility-focused small-cap fund on the market. However, weak fundamentals and a risky earnings season prevented me from issuing a buy rating. One year later, CSB was the second-worst performer among 23 peers, underscoring the importance of evaluating ETFs based on current fundamentals rather than historical performance. Today's article takes the same approach. In my view, its estimated 3.30% dividend isn't worth chasing, and once again, it's poor earnings results, higher-than-expected volatility, and a nervous Wall Street that's to blame.
CSB Overview
Strategy Discussion and Key Exposures
CSB tracks the Nasdaq Victory U.S. Small Cap High Dividend 100 Volatility Weighted Index, selecting the 100 highest-yielding stocks from the Nasdaq Victory U.S. Small Cap 500 Volatility Weighted Index. This parent group consists of 500 securities screened for the following:
- positive earnings over the last twelve months
- largest stocks with under $3 billion in market capitalization
Weights are inversely assigned based on the 180-day standard deviation of returns, meaning the least-volatile securities receive the highest weights. The Index is rebalanced and reconstituted after the close on the third Friday in March and September, using market data through the prior month's end.
The strategy is worth considering because small-cap stocks are often highly volatile. I like the profitability screen, and CSB generally offers at least a 3% yield. It works for high-yield investors wanting to diversify by size. However, it may be unnecessary. Large-cap high-dividend ETFs have more impressive track records, better combinations of dividend yield and dividend growth, lower volatility, superior profitability, and in some cases, better capital appreciation potential. This article compares CSB against other direct peers and contrasts its fundamentals alongside the Schwab U.S. Dividend Equity ETF (SCHD) to highlight what CSB shareholders are getting in return.
Performance Analysis
Five additional U.S. small-cap ETFs follow a volatility-weighted strategy:
- VictoryShares US Small Cap Volatility Weighted ETF (CSA)
- JPMorgan Diversified Return U.S. Small Cap Equity ETF (JPSE)
- Timothy Plan US Small Cap Core ETF (TPSC)
- VictoryShares USAA MSCI USA Small Cap Value Momentum ETF (USVM)
- Invesco S&P SmallCap Low Volatility ETF (XSLV)
The table below highlights how CSB has performed the best over the last three, five, and seven years through January 2023. Its 1.34% decline over the previous year was a relatively minor setback, as the top performer gained just 2.04%. CSB's 0.35% expense ratio aligns with this peer group, but its 3.29% trailing dividend yield sets it apart.
The Sunday Investor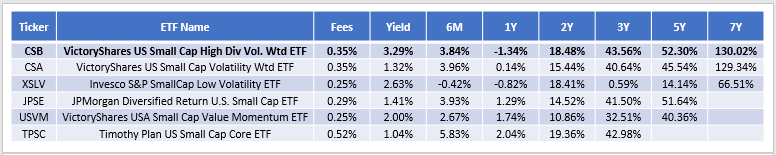
CSB's long-term performance is impressive even after including other small-cap value and dividend-focused funds. The following highlights how its 130.02% gain over the last seven years was second best, next to the Invesco S&P SmallCap Value with Momentum ETF (XSVM). Readers may also consider the Avantis U.S. Small Cap Value Fund (AVUV), which has emerged as a leader over the last three years and one I favorably reviewed last year.
The Sunday Investor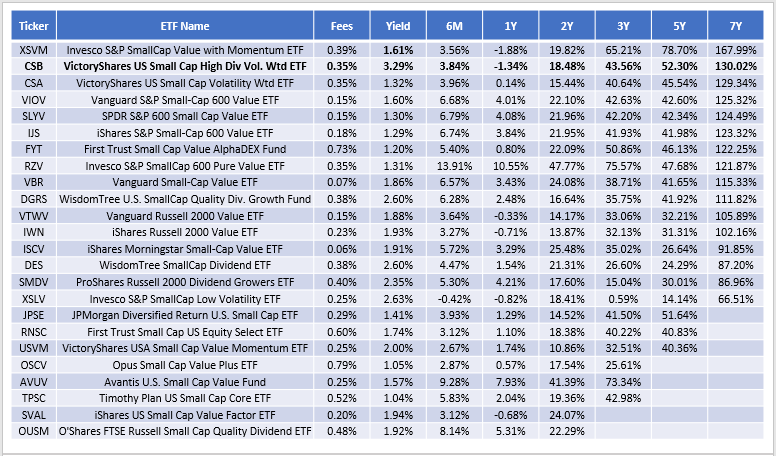
Still, readers should pay attention to CSB's 1.34% decline over the last year. That result was second-worst next to XSVM, ironically enough. Investors must evaluate ETFs based on their current holdings because past results in different market environments can lead you down the wrong path. In my January 2022 review, I noted CSB's weak fundamentals and poor earnings momentum scores as reasons to avoid it. Now, one year later, let's use the same approach to identify a potential buying opportunity.
CSB Analysis
Sector Exposures and Top Ten Holdings
Compared to the iShares Russell 2000 Value ETF (IWN), CSB's stated benchmark, CSB overweights Consumer Discretionary and Consumer Staples by a combined 14%. Its key offsets are in Health Care and Real Estate.
Morningstar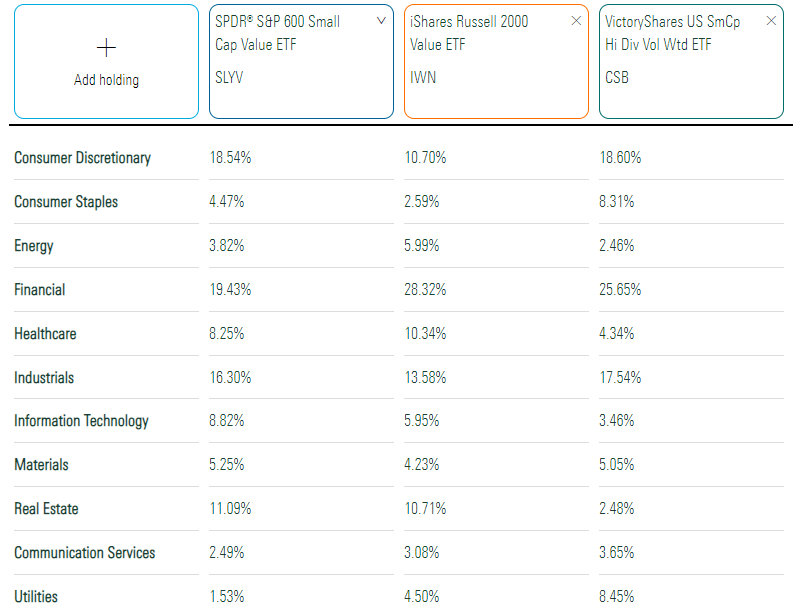
I find overweighting the Consumer Discretionary sector odd. The average five-year beta for these constituents is 1.50. They weren't even low-volatility stocks between March 2022 and August 2022, the last reference period used. Most had annualized standard deviations above 30% compared. However, their average 15.08% decline was the reason for inclusion, as price and dividend yield move in opposite directions.
Portfolio Visualizer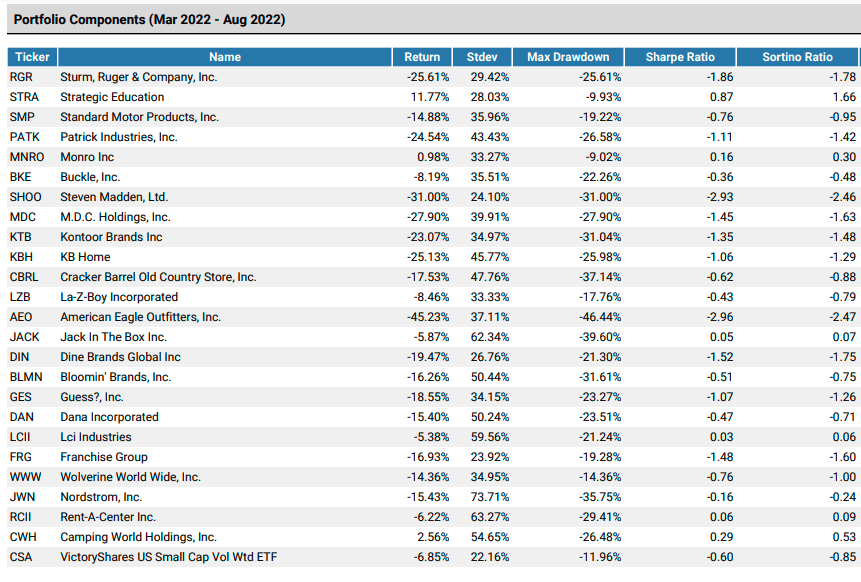
It's our first clue that there are better ways to reduce volatility than CSB. Remember that its stock universe is broad at 500, reducing the possibility that the pool is genuinely low-volatility. However, I don't want that to deter investors too much. These same stocks gained 20.36% since September 2022, benefitting from the boom in cyclical stocks this year. Sometimes, volatility is good, but it's disappointing because that's not what CSB shareholders expect.
Portfolio Visualizer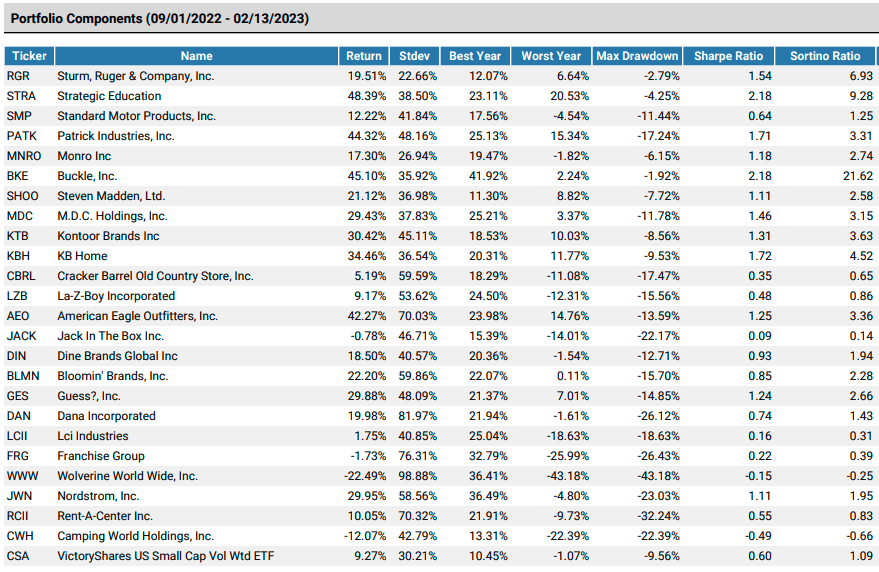
CSB's top 10 holdings total 15.82% of the portfolio. It's close to an equal-weight fund because volatility ranges are often tight. Based on monthly returns for the reference period, the annualized standard deviation range was 14.79% to 73.71%. These figures indicate the highest-weighted security has approximately 5x the weight of the lowest-weighted security at the rebalancing time. In this case, it's OceanFirst Financial (OCFC). Nordstrom (JWN) was the most-volatile stock and currently has a 0.52% weighting.
VictoryShares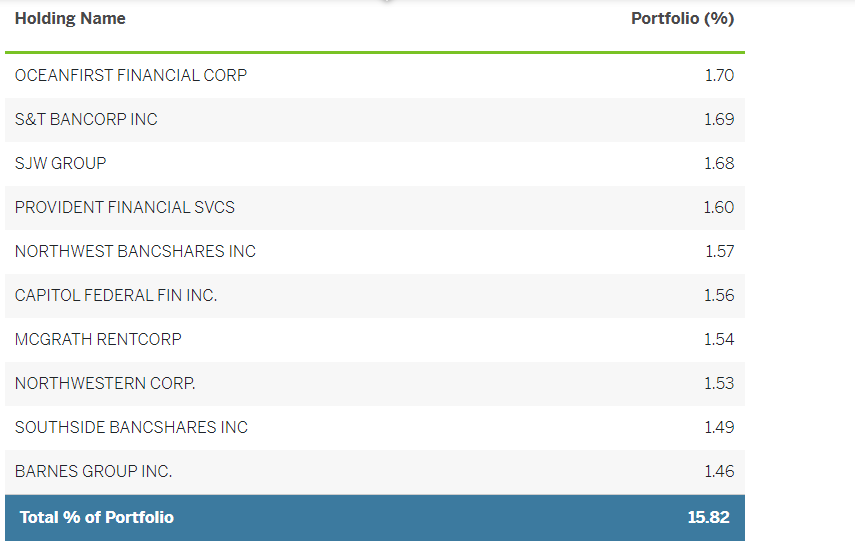
Fundamental Analysis
The following table highlights selected fundamental metrics for CSB's top 25 industries, totaling 68.59% of the portfolio. Also included are summary metrics for IWN, AVUV, the SPDR S&P 600 Small Cap Value ETF (SLYV), and the Schwab U.S. Dividend Equity ETF (SCHD). I included SCHD because I want to demonstrate the difference in quality and volatility for this leading large-cap dividend fund.
The Sunday Investor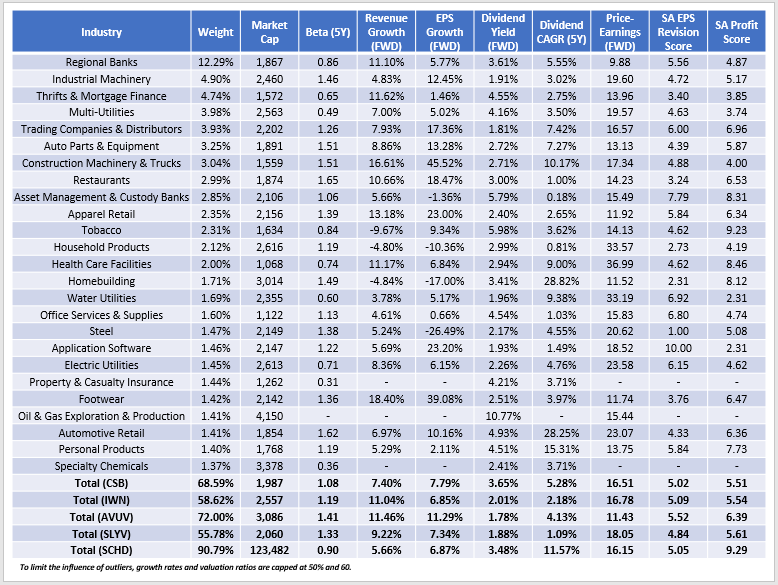
A few observations:
1. CSB has a 1.08 five-year beta, perhaps higher than expected and not much lower than IWN's 1.19. AVUV's is 1.41, common with Avantis' high growth, low valuation approach that's worked over the last few years. SLYV holds 455 securities with a weighted-average $2 billion market capitalization, but its five-year beta is elevated at 1.33. Still, all small-cap funds are substantially below SCHD's 0.90. For this reason, investors seeking downside protection are better off with large-cap dividend ETFs.
2. Small-cap stocks are known for their growth, but CSB's estimated 7-8% sales and earnings growth rate are similar to SCHD's, which is already on the low side. On sales growth, CSB is below all three small-cap peers.
3. CSB's a leader in dividend yield, with constituents yielding 3.65% compared to 2.01%, 1.78%, and 1.88% for IWN, AVUV, and SLYV. After fees, CSB shareholders can expect 3.30%. However, the estimated net yield for SCHD is 3.42%, which comes with double-digit dividend growth.
4. CSB's poor 5.51/10 Profitability Score, derived from individual Seeking Alpha Profitability Grades, is concerning but also expected with small-cap stocks. AVUV is better at 6.39/10 and is consistently among the best in the category, but still far below SCHD's 9.29/10.
5. CSB's earnings momentum, as measured by its 5.02/10 EPS Revision Score, is average for the category but still low, reflecting poor market sentiment on Wall Street. The substantial YTD gains in riskier sectors don't align with the latest earnings results and surprises. For example, Consumer Discretionary stocks reported an aggregate -11.1% earnings surprise this quarter, with 61.5% reporting negative year-over-year earnings growth. Since it's CSB's largest exposure area, I wouldn't be surprised if we see a pullback shortly.
Yardeni Research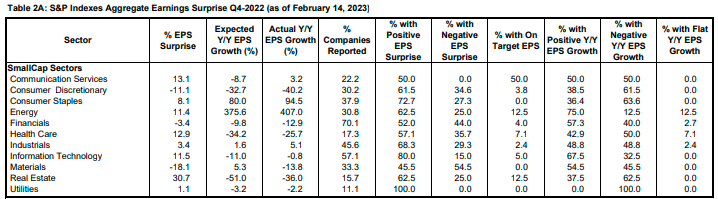
Investment Recommendation
I don't recommend investors purchase CSB. Its 1.08 five-year beta is low for the category but elevated when considering large-cap ETFs like SCHD that feature better dividend yield and growth combinations. CSB's constituents also have low profitability and weak earnings momentum, signaling a possible reversal among its riskier holdings. Investors should be cautious about diversification just for the sake of diversification. For growth potential, AVUV is the better choice, and you can let the higher-quality large-cap stocks deliver the growing income you need while doing a better job reducing risk.
The Sunday Investor Joins Income Builder
The Sunday Investor has teamed up with Hoya Capital to launch the premier income-focused investing service on Seeking Alpha. Members receive complete early access to our articles along with exclusive income-focused model portfolios and a comprehensive suite of tools and models to help build sustainable portfolio income targeting premium dividend yields of up to 10%.
Whether your focus is High Yield or Dividend Growth, we’ve got you covered with actionable investment research focusing on real income-producing asset classes that offer potential diversification, monthly income, capital appreciation, and inflation hedging. Start A Free 2-Week Trial Today!

This article was written by

I perform independent fundamental analysis for over 850 U.S. Equity ETFs and aim to provide you with the most comprehensive ETF coverage on Seeking Alpha. My insights into how ETFs are constructed at the industry level are unique rather than surface-level reviews that’s standard on other investment platforms. My deep-dive articles always include a set of alternative funds, and I am active in the comments section and ready to answer your questions about the ETFs you own or are considering.
My qualifications include a Certificate in Advanced Investment Advice from the Canadian Securities Institute, the completion of all educational requirements for the Chartered Investment Manager (CIM) designation, and a Bachelor of Commerce degree with a major in Accounting. In addition, I passed the CFA Level 1 Exam and am on track to become licensed to advise on options and derivatives in 2023. In November 2021, I became a contributor for the Hoya Capital Income Builder Marketplace Service and manage the "Active Equity ETF Model Portfolio", which as a total return objective. Sign up for a free trial today! Hoya Capital Income Builder.
Disclosure: I/we have a beneficial long position in the shares of SCHD either through stock ownership, options, or other derivatives. I wrote this article myself, and it expresses my own opinions. I am not receiving compensation for it (other than from Seeking Alpha). I have no business relationship with any company whose stock is mentioned in this article.