Southside Bancshares: Outlook Of Subdued Earnings Growth Appears Priced-In

Summary
- The management’s 9% loan growth target appears too ambitious. I’m expecting this target to be missed.
- I’ve reduced my margin estimate for 2023 following last quarter’s disappointing performance.
- The December 2023 target price suggests a small upside from the current market price. Further, SBSI is offering a modest dividend yield.
dszc
Earnings of Southside Bancshares, Inc. (NASDAQ:SBSI) will likely increase slightly this year on the back of low loan growth. Meanwhile, the margin will likely remain unchanged this year following a mixed shift in the balance sheet positioning. Overall, I'm expecting Southside Bancshares stock to report earnings of $3.38 per share for 2023, up by 3.7% year-over-year. Compared to my last report on the company, I've tweaked downwards my earnings estimate as I've reduced my margin estimate. The December 2023 target price suggests a small upside from the current market price. Therefore, I'm maintaining a hold rating on Southside Bancshares.
Loan Growth to Decelerate but Remain Above the Historical Average
Although the loan growth rate declined sequentially in the fourth quarter of 2022, it remained quite impressive. The portfolio grew by 2.1% during the quarter, taking the full-year growth to 13.9%, which is well above the historical average. The growth rate also beat my expectations given in my last report on Southside Bancshares. Management is targeting loan growth of 9% this year, as mentioned in the conference call.
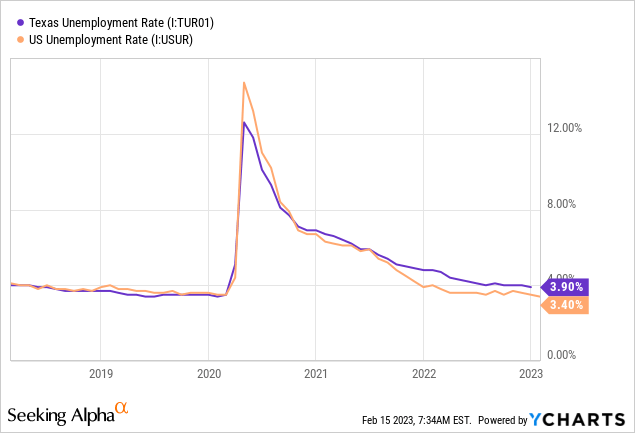
In my opinion, there's a good chance Southside Bancshares will miss the 9% target this year. Firstly, loan growth should be substantially lower this year compared to 2022 because average interest rates will be much higher this year relative to last year. Management also mentioned in the conference call that the loan pipelines are currently not as strong as they were this time last year. Furthermore, the regional unemployment rate is currently worse than the national average. Southside Bancshares mostly operates in the state of Texas, which reported an unemployment rate of 3.9% for December 2022.
Despite the factors given above, I think loan growth will remain at an elevated level compared to previous years. This is because recent data shows that the economic activity in Texas is quite robust, especially when compared to the national average (see the difference in slopes of the trendlines below).
The Federal Reserve Bank of Philadelphia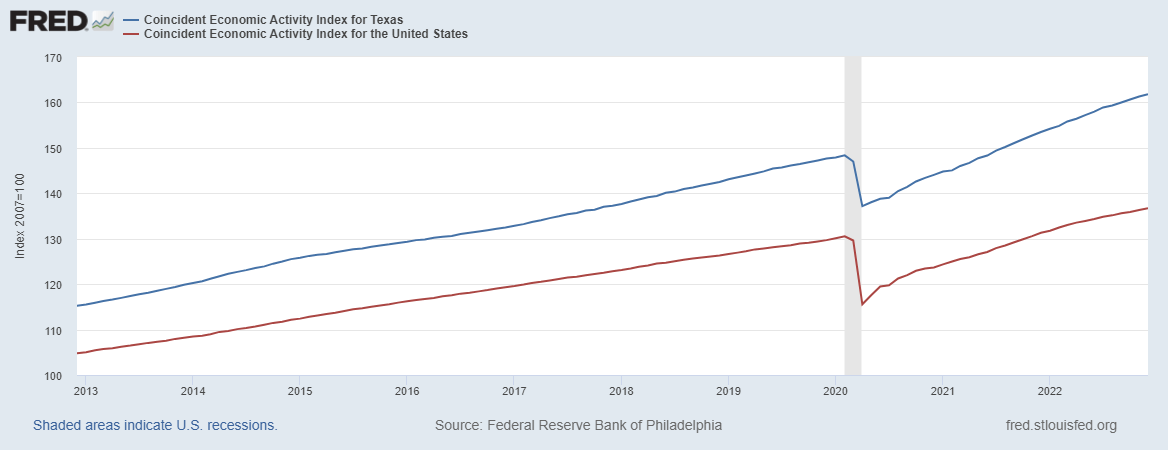
Considering the factors given above, I'm expecting the loan portfolio to grow by 4% in 2023. Further, I'm expecting deposits to grow in line with loans. The following table shows my balance sheet estimates.
| Financial Position | FY18 | FY19 | FY20 | FY21 | FY22 | FY23E |
| Net Loans | 3,286 | 3,543 | 3,609 | 3,610 | 4,111 | 4,278 |
| Growth of Net Loans | 0.4% | 7.8% | 1.8% | 0.0% | 13.9% | 4.1% |
| Other Earning Assets | 2,164 | 2,588 | 2,733 | 2,994 | 2,720 | 2,774 |
| Deposits | 4,425 | 4,703 | 4,932 | 5,722 | 6,198 | 6,450 |
| Borrowings and Sub-Debt | 915 | 1,160 | 1,113 | 543 | 533 | 544 |
| Common equity | 731 | 805 | 875 | 912 | 746 | 768 |
| Book Value Per Share ($) | 20.8 | 23.7 | 26.3 | 27.9 | 23.1 | 23.8 |
| Tangible BVPS ($) | 14.6 | 17.4 | 20.0 | 21.5 | 16.8 | 17.4 |
| Source: SEC Filings, Author's Estimates (In USD million unless otherwise specified) | ||||||
Changing Margin Outlook to Steady
The pace of net interest margin expansion continued to decelerate during the fourth quarter of 2022. The margin grew by only four basis points in the last quarter, as compared to six basis points in the third quarter and eight basis points in the second quarter of 2022. The realized margin for the fourth quarter missed my expectations given in my last report on the company. Moreover, the deposit mix deteriorated during the quarter. Non-interest-bearing deposits dropped to 27.0% by the end of December from 28.5% at the end of September 2022. As a result, the average deposit cost was less sticky at the end of the fourth quarter compared to the beginning of the quarter.
Fortunately, the asset mix improved during the quarter as the growth of loans outpaced the growth of other lower-yielding assets. The loan-to-deposit ratio increased to 66.3% by the end of December from 65.1% at the end of September 2022. The full-quarter impact of this improvement will be observed during the first quarter of 2023.
Moreover, loan additions will help lift the average loan yield and consequently the margin. As interest rates are at the highest level in over a decade, new loans will be originated at higher rates than the loans already in the portfolio.
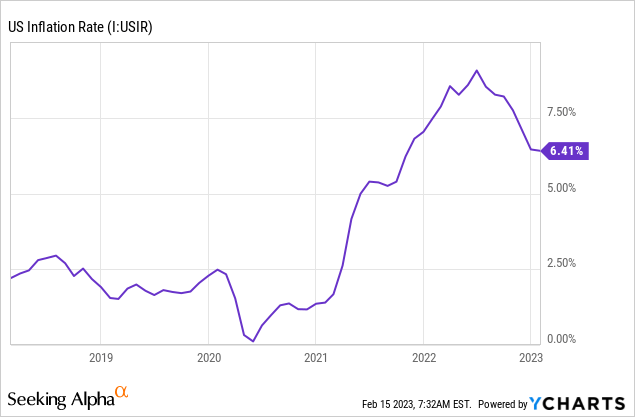
I'm expecting the Fed to increase the Fed funds rate by a further 50 basis points through mid-2023 and then hold the rate steady. The magnitude of Fed funds rate hikes has declined, which indicates that the end of the up-rate cycle is near. Additionally, there has been an overall disinflation trend for the last six months even if January's figure is flattish, as shown below. The overall six-month trend shows that inflation has peaked, which signals monetary easing or a less hawkish monetary policy in the coming months.
Considering these factors, I'm expecting the margin to remain unchanged from the fourth quarter's level of 3.40% throughout 2023. In my last report on the company, I mentioned that I expected the margin to rise in 2023. Following the fourth quarter's disappointing performance and considering my outlook on interest rates, I've decided to reduce my margin estimate for this year.
Expecting Earnings to Increase Slightly in 2023
The anticipated low loan growth will be the biggest earnings driver this year. On the other hand, pressure on salary expenses from a tight labor market and heightened inflation will limit earnings growth. Meanwhile, the provisioning expense for expected loan losses will likely remain near a normal level as the economic outlook has not changed much this quarter. I'm expecting the net provision expense to make up around 0.30% of total loans, which is the same as the average for the last five years.
Overall, I'm expecting the company to report earnings of $3.38 per share for 2023, up by just 3.7%. The following table shows my income statement estimates.
| Income Statement | FY18 | FY19 | FY20 | FY21 | FY22 | FY23E |
| Net interest income | 172 | 170 | 187 | 190 | 212 | 233 |
| Provision for loan losses | 8 | 5 | 20 | (17) | 3 | 4 |
| Non-interest income | 41 | 42 | 50 | 49 | 41 | 44 |
| Non-interest expense | 120 | 119 | 123 | 125 | 130 | 145 |
| Net income - Common Sh. | 74 | 75 | 82 | 113 | 105 | 109 |
| EPS - Diluted ($) | 2.11 | 2.20 | 2.47 | 3.47 | 3.26 | 3.38 |
| Source: SEC Filings, Author's Estimates (In USD million unless otherwise specified) | ||||||
In my last report on Southside Bancshares, I projected earnings of $3.40 per share for 2023. I've slightly revised downwards my earnings estimate because I've reduced my margin estimate.
My estimates are based on certain macroeconomic assumptions that may not come to fruition. Therefore, actual earnings can differ materially from my estimates.
Maintaining a Hold Rating Due to a Moderate Total Expected Return
Southside Bancshares is offering a dividend yield of 3.7% at the current quarterly dividend rate of $0.35 and an annual special dividend of $0.04 per share. The earnings and dividend estimates suggest a payout ratio of 43% for 2023, which is below the five-year average of 48%. Therefore, the dividend appears secure. Southside usually increases its dividend only once a year, so it's unlikely that the company will raise dividends again this year.
I'm using the historical price-to-tangible book ("P/TB") and price-to-earnings ("P/E") multiples to value Southside Bancshares. The stock has traded at an average P/TB ratio of 1.98 in the past, as shown below.
| FY18 | FY19 | FY20 | FY21 | FY22 | Average | ||
| T. Book Value per Share ($) | 14.6 | 17.4 | 20.0 | 21.5 | 16.8 | ||
| Average Market Price ($) | 34.3 | 34.1 | 29.5 | 38.6 | 38.7 | ||
| Historical P/TB | 2.35x | 1.96x | 1.48x | 1.79x | 2.31x | 1.98x | |
| Source: Company Financials, Yahoo Finance, Author's Estimates | |||||||
Multiplying the average P/TB multiple with the forecast tangible book value per share of $17.4 gives a target price of $34.50 for the end of 2023. This price target implies an 11.0% downside from the February 14 closing price. The following table shows the sensitivity of the target price to the P/TB ratio.
| P/TB Multiple | 1.78x | 1.88x | 1.98x | 2.08x | 2.18x |
| TBVPS - Dec 2023 ($) | 17.4 | 17.4 | 17.4 | 17.4 | 17.4 |
| Target Price ($) | 31.0 | 32.8 | 34.5 | 36.2 | 38.0 |
| Market Price ($) | 38.8 | 38.8 | 38.8 | 38.8 | 38.8 |
| Upside/(Downside) | (20.0)% | (15.5)% | (11.0)% | (6.5)% | (2.0)% |
| Source: Author's Estimates |
The stock has traded at an average P/E ratio of around 13.3x in the past, as shown below.
| FY18 | FY19 | FY20 | FY21 | FY22 | Average | ||
| Earnings per Share ($) | 2.11 | 2.20 | 2.47 | 3.47 | 3.26 | ||
| Average Market Price ($) | 34.3 | 34.1 | 29.5 | 38.6 | 38.7 | ||
| Historical P/E | 16.2x | 15.5x | 11.9x | 11.1x | 11.9x | 13.3x | |
| Source: Company Financials, Yahoo Finance, Author's Estimates | |||||||
Multiplying the average P/E multiple with the forecast earnings per share of $3.38 gives a target price of $45.10 for the end of 2023. This price target implies a 16.3% upside from the February 14 closing price. The following table shows the sensitivity of the target price to the P/E ratio.
| P/E Multiple | 11.3x | 12.3x | 13.3x | 14.3x | 15.3x |
| EPS 2023 ($) | 3.38 | 3.38 | 3.38 | 3.38 | 3.38 |
| Target Price ($) | 38.3 | 41.7 | 45.1 | 48.4 | 51.8 |
| Market Price ($) | 38.8 | 38.8 | 38.8 | 38.8 | 38.8 |
| Upside/(Downside) | (1.2)% | 7.5% | 16.3% | 25.0% | 33.7% |
| Source: Author's Estimates |
Equally weighting the target prices from the two valuation methods gives a combined target price of $39.80, which implies a 2.6% upside from the current market price. Adding the forward dividend yield gives a total expected return of 6.4%. Hence, I'm maintaining a hold rating on Southside Bancshares.
This article was written by

Disclosure: I/we have no stock, option or similar derivative position in any of the companies mentioned, and no plans to initiate any such positions within the next 72 hours. I wrote this article myself, and it expresses my own opinions. I am not receiving compensation for it (other than from Seeking Alpha). I have no business relationship with any company whose stock is mentioned in this article.
Additional disclosure: Disclaimer: This article is not financial advice. Investors are expected to consider their investment objectives and constraints before investing in the stock(s) mentioned in the article.