Twilio: Now An Odds-On, 3-Digit CAGR Capital Gain Prospect

Summary
- 84% Of TWLO shares are held by 924 institutions, even more held of float.
- Average daily trading value: $220 million.
- Derivatives hedging activity now forecasts +15% stock price in a month, 5-year history of 78 prior forecasts actually did better, all profitable.
Pgiam/iStock via Getty Images
This article’s primary focus is on Twilio, Inc. (NYSE:TWLO).
Investment Thesis
We look to the hedging actions of Market-Makers to protect their at-risk capital endangerment required by the automation achieved by markets in serving a continuing flow of individual investor small trades instead of irregular huge-value “institutional” transactions.
The pricing and structure of such hedges reveal the coming-price expectations of both the MM protection-buyers and that of the MM industry protection-sellers.
Our selection of Twilio, Inc. is prompted by its currently-attractive repeated stock pricing forecast, coupled by a large following of Seeking Alpha readers.
Description of the Subject Company Activities
“Twilio Inc., together with its subsidiaries, provides a cloud communications platform that enables developers to build, scale, and operate customer engagement within software applications in the United States and internationally. Its customer engagement platform provides a set of application programming interfaces that handle the higher-level communication logic needed for nearly every type of customer engagement, as well as enable developers to embed voice, messaging, video, and email capabilities into their applications. The company was incorporated in 2008 and is headquartered in San Francisco, California.”
Source: Yahoo Finance
Yahoo Finance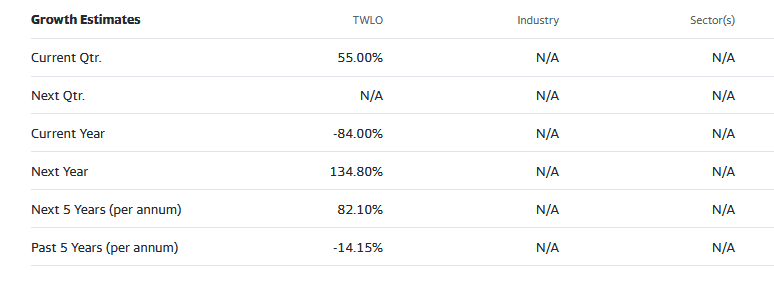
These growth estimates have been made by and are collected from Wall Street analysts to suggest what conventional methodology currently produces. The typical variations across forecast horizons of different time periods illustrate the difficulty of making value comparisons when the forecast horizon is not clearly defined.
Twilio travels in a fast-action investment crowd of Information Technology competitors for the attention of near-term investment satisfaction pursuers. The current hedging of the market-making community for the more prominent such stocks tells the expected price-range Risk and Reward bounds as told in Figure 1.
Risk-Reward Comparisons of Portfolio Investment Candidates
Figure 1
blockdesk.com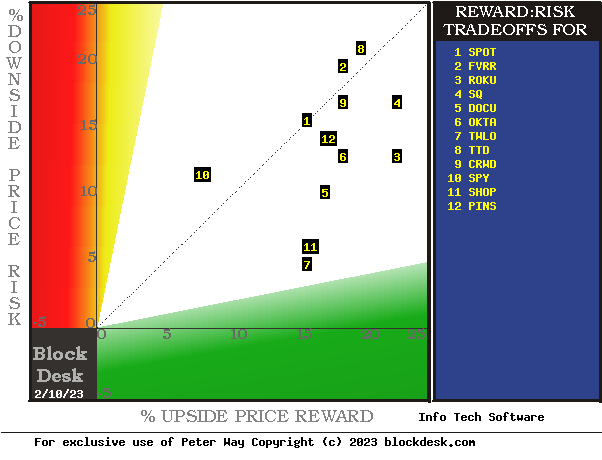
(Used with prior permission)
The tradeoffs here are between near-term upside price gains (green horizontal scale) seen worth protecting against by Market-makers with short positions in each of the stocks, and the prior actual price draw-downs experienced during holdings of those stocks (red vertical scale). Both scales are of percent change from zero to 25%.
The intersection of those coordinates by the numbered positions is identified by the stock symbols in the blue field to the right.
The dotted diagonal line marks the points of equal upside price change forecasts derived from Market-Maker [MM] hedging actions and the actual worst-case price draw-downs from positions that could have been taken following prior MM forecasts like today's.
Our principal interest is in TWLO at location [7]. A "market index" norm of reward~risk tradeoffs is offered by SPDR S&P500 index ETF at [10] in unusually poor competitive circumstances.
Those forecasts are implied by the self-protective behaviors of MMs who must usually put firm capital at temporary risk to balance buyer and seller interests in helping big-money portfolio managers make volume adjustments to multi-billion-dollar portfolios. The protective actions taken with real-money bets further define daily the extent of likely expected price changes for thousands of stocks and ETFs.
This map is a good starting point, but it can only cover some of the investment characteristics that often should influence an investor's choice of where to put his/her capital to work. The table in Figure 2 covers the above considerations and several others.
Comparing Alternative Investments
Figure 2
blockdesk.com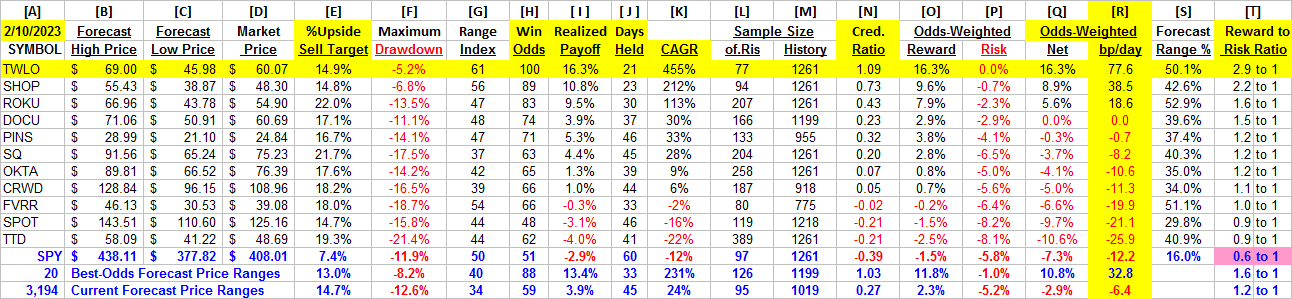
(Used with permission)
Column headers for Figure 2 define elements for each row stock whose symbol appears at the left in column [A]. The elements are derived or calculated separately for each stock, based on the specifics of its situation and current-day MM price-range forecasts. Data in red numerals are negative, usually undesirable to “long” holding positions. Table cells with pink background “fills” signify conditions typically unacceptable to “buy” recommendations. Yellow fills are of data for the stock of principal interest and of all issues at the ranking column, [R].
Readers familiar with our analysis methods may wish to skip to the next section viewing price range forecast trends for TWLO.
Figure 2’s purpose is to attempt universally comparable answers, stock by stock, of a) How BIG the price gain payoff may be, b) how LIKELY the payoff will be a profitable experience, c) how SOON it may happen, and d) what price draw-down RISK may be encountered during its holding period.
The price-range forecast limits of columns [B] and [C] get defined by MM hedging actions taken to protect firm capital required to be put at risk of price changes from volume trade orders placed by big-$ "institutional" clients.
[E] measures potential upside risks for MM short positions created to fill such orders, and reward potentials for the buy-side positions so created. Prior forecasts like the present provide a history of relevant price draw-down risks for buyers. The most severe ones actually encountered are in [F], during holding periods in an effort to reach [E] gains. Those are where buyers are most likely to accept losses.
[H] tells what proportion of the [L] sample of prior like forecasts have earned gains by either having price reach its [B] target or be above its [D] entry cost at the end of a 3-month max-patience holding period limit. [ I ] gives the net gains-losses of those [L] experiences and [N] suggests how credible [E] may be compared to [ I ].
Further Reward~Risk tradeoffs involve using the [H] odds for gains with the 100 - H loss odds as weights for N-conditioned [E] and for [F], for a combined-return score [Q]. The typical position holding period [J] on [Q] provides a figure of merit [fom] ranking measure [R] useful in portfolio position preferencing. Figure 2 is row-ranked on [R] among candidate securities, with TWLO yellow-row identified.
Along with the candidate-specific stocks these selection considerations are provided for the averages of over 3000 stocks for which MM price-range forecasts are available today, and 20 of the best-ranked (by fom) of those forecasts, as well as the forecast for S&P500 Index ETF (NYSEARCA:SPY) as an equity market proxy.
Recent MM TWLO Price-Range Forecasts Trends
Figure 3
blockdesk.com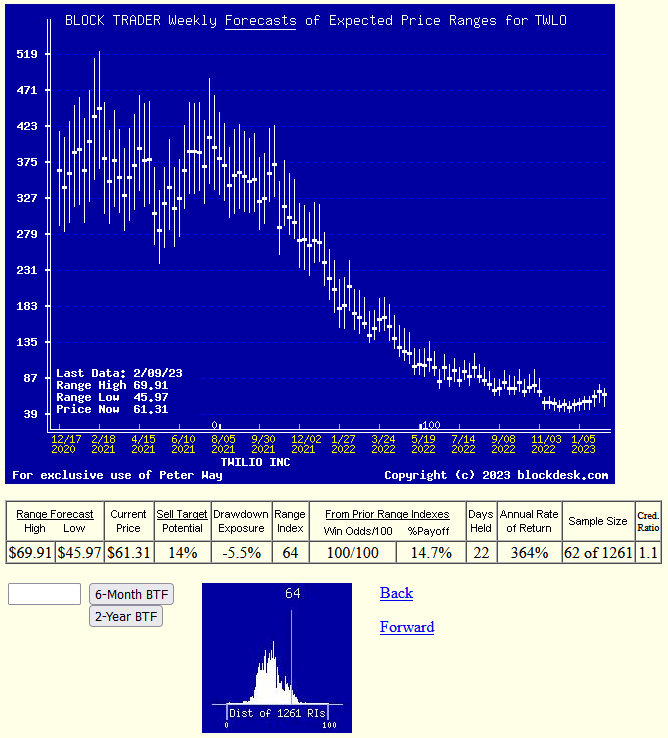
Source: blockdesk.com
(Used with permission)
This picture is not a “technical chart” of past prices for TWLO. Instead, it is the past 2 years of weekly price range forecasts of market actions yet to come in the next few months. The only past information there is the closing stock price on the day of each forecast.
That current price data splits the forecast range’s expectations into opposite forecasts of upside and downside prospects. Their trends over time provide additional insights into coming potentials, and helps keep perspective on what may be coming.
This period was a time of predominant decline in expectations following fluctuations in the first half of 2021. Now there are signs of developed stability and possible upturn in the stock’s price. That is clearer in more frequent daily forecasts, shown in the past 6 months in Figure 4, particularly in the pronounced drop in November of 2022. The larger scale of smaller prices makes clearer the shift to a larger proportion of upside expectations and smaller downside concerns.
Figure 4
blockdesk.com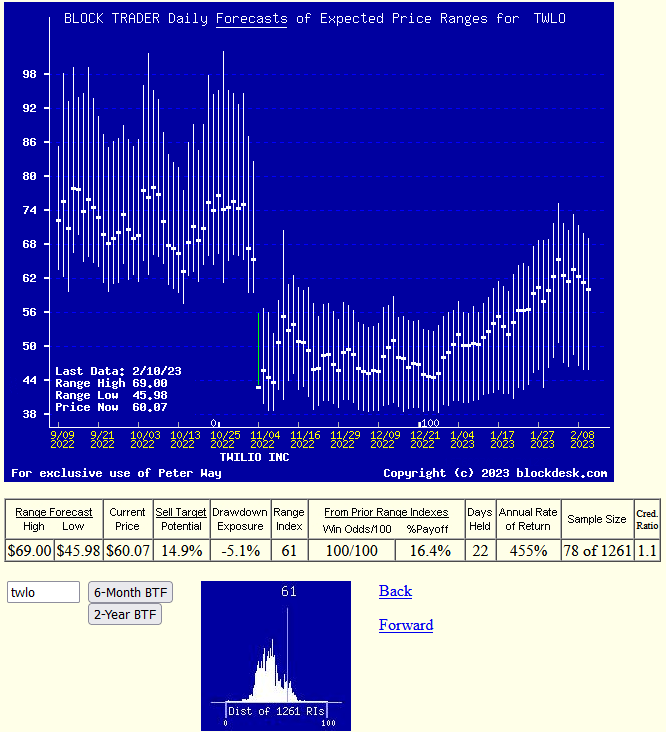
(Used with permission)
The small pictures at the bottom of Figures 3 and 4 are frequency distributions of the Range Index’s appearance daily during the past 5 years of daily forecasts. The Range Index [RI] tells how much the downside of the forecast range occupies of that percentage of the entire range each day, and its frequency distribution suggests what may seem “normal” for that stock, in the expectations of its evaluators’ eyes.
Here the present level is near its least frequent, lowest-cost presence, encouraging the acceptance that we are looking at a realistic evaluation for TWLO. With nearly all past RIs above than below the present RI there is more room for an even more positive outlook. Of the 78 prior forecasts of 61% downside and 39% upside in the past 5 years’ 1261 market days all 78 either reached their top-of-forecast upside target or were closed at prices above their position entry cost prices by the risk-limiting holding period time limit of 3 months.
In Figures 2, 3, and 4 the Credible Ratio of 1.09 indicates that the sums of all 78 position closeout rewards were slightly better (+16.4%) than the +14.9% average upside forecasts. Note: past experience is no guarantee.
Conclusion
Among these alternative investments explicitly compared, Twilio, Inc. appears to be a logical buy preference now for investors seeking near-term capital gains.
This article was written by

Disclosure: I/we have no stock, option or similar derivative position in any of the companies mentioned, but may initiate a beneficial Long position through a purchase of the stock, or the purchase of call options or similar derivatives in TWLO over the next 72 hours. I wrote this article myself, and it expresses my own opinions. I am not receiving compensation for it (other than from Seeking Alpha). I have no business relationship with any company whose stock is mentioned in this article.
Additional disclosure: Additional disclosure: Peter Way and generations of the Way Family are long-term providers of perspective information, earlier helping professional investors and now individual investors, discriminate between wealth-building opportunities in individual stocks and ETFs. We do not manage money for others outside of the family but do provide pro bono consulting for a limited number of not-for-profit organizations.
We firmly believe investors need to maintain skin in their game by actively initiating commitment choices of capital and time investments in their personal portfolios. So our information presents for D-I-Y investor guidance what the arguably best-informed professional investors are thinking. Their insights, revealed through their own self-protective hedging actions, tell what they believe is most likely to happen to the prices of specific issues in coming weeks and months. Evidences of how such prior forecasts have worked out are routinely provided. Our website, blockdesk.com has further information. Pls see SA articles numbered 1495621 and 1936131.