SPY: The Bear Market Pause Likely Near The End

Summary
- The bear market is currently in the pause phase.
- However, the next leg down is likely forthcoming, as the economic data starts to deteriorate.
- The S&P 500 Index, as represented by the SPDR S&P 500 Trust ETF SPY, is facing considerable downside risk, as the recession is still not priced in.
DNY59
The Grantham's 2023 outlook
Jeremy Grantham, who predicted the 2000 bear market, the 2008 bear market, and more recently the 2022 drawdown, just published his 2023 S&P 500 (SP500) outlook. His view is that the S&P 500 will finish 2023 near the 3200 level.
Here is the key quote:
My calculations of trendline value of the S&P 500, adjusted upwards for trendline growth and for expected inflation, is about 3200 by the end of 2023. I believe it is likely (3 to 1) to reach that trend and spend at least some time below it this year or next.
However, Grantham also sees much more uncertainty in 2023:
The real risk from here is in the unusually wide range of possibilities around this central point. I would suggest wide and asymmetric error bars around any such forecast. Regrettably there are more downside potentials than upside.
More importantly, Grantham sees a possible delay in the unfolding bear market, which could definitely frustrate the bears and "trap" the bulls:
There are some complicating factors that seem quite likely to drag this bear market out. Let's start with that irritating factor, the Presidential Cycle...Other factors suggesting a long or delayed decline include the fact that we start today with a still very strong labor market, inflation apparently beginning to subside, and China hopefully regrouping from a strict lockdown phase that has badly interfered with both their domestic and international business.
How does this compare to my 2023 outlook?
I published my 2023 outlook for the S&P 500 on Dec 21st, with the 2023 target at 2800. Essentially, my outlook is very similar to the Grantham's outlook. Specifically, I include the chart of the S&P 500 "trendline" that Grantham also refers to. Here is the chart from my outlook:
Barchart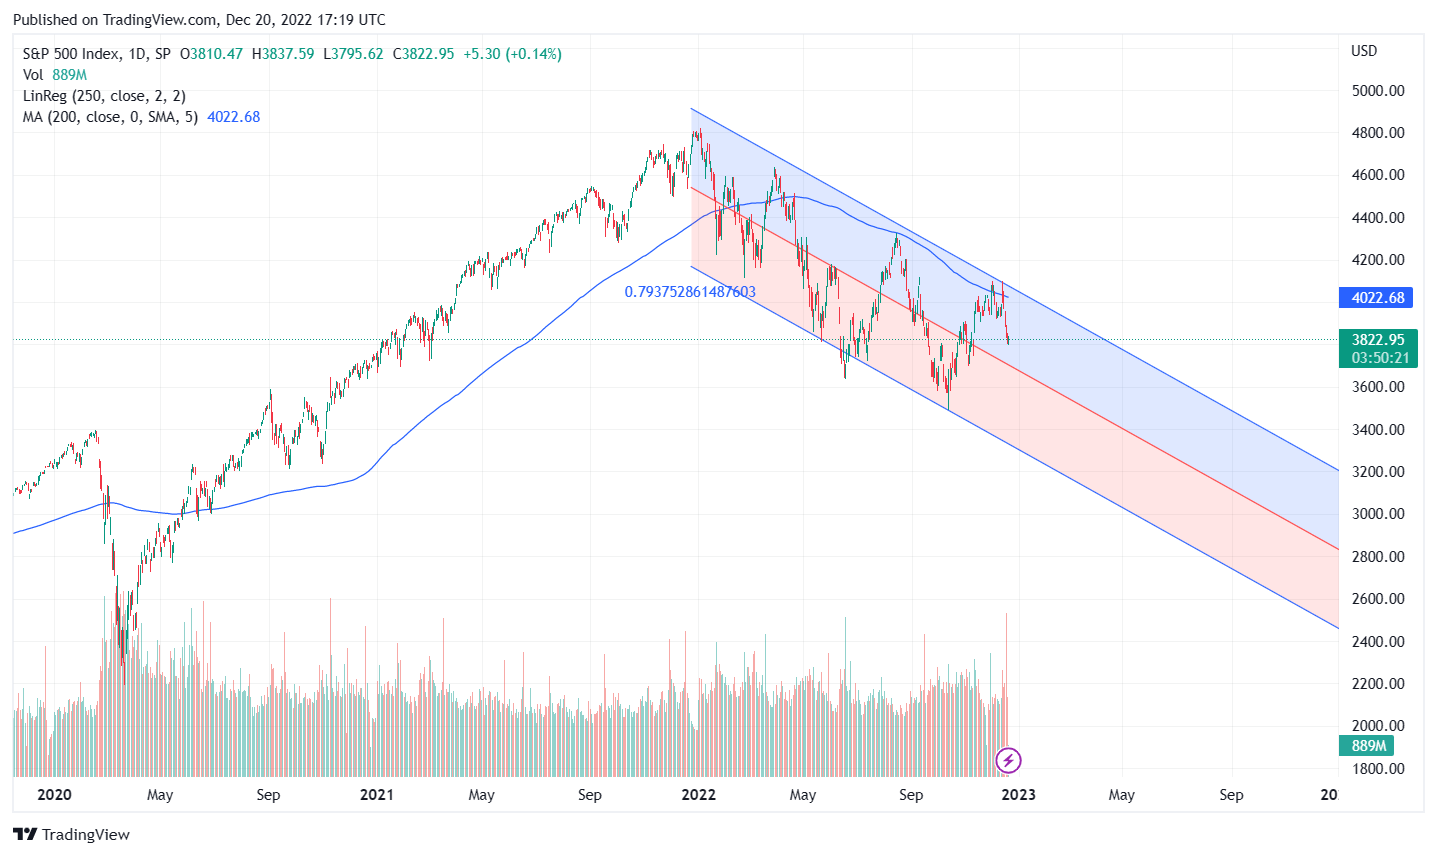
As you can see, the range of my predicted trendline is 2400 to 3200, with the mid-point right at 2800. I selected the 2800 level as the target because it's the mid-point of the range, but essentially the S&P 500 could be anywhere within this wide range at the end of 2023. This is consistent with the Grantham's 3200 level, with "some time spent below that level."
The bear market pause
The most frustrating thing that questions the bearish outlook is the bear market pause or the delay, especially if the downtrend is broken. In fact, recently the investor-preferred exchange-traded fund ("ETF") that tracks the S&P 500, namely SPDR S&P 500 Trust ETF (NYSEARCA:SPY), has been trading right at, or slightly above, the key downtrend trendline, or the 200dma. Here is the SPY chart:
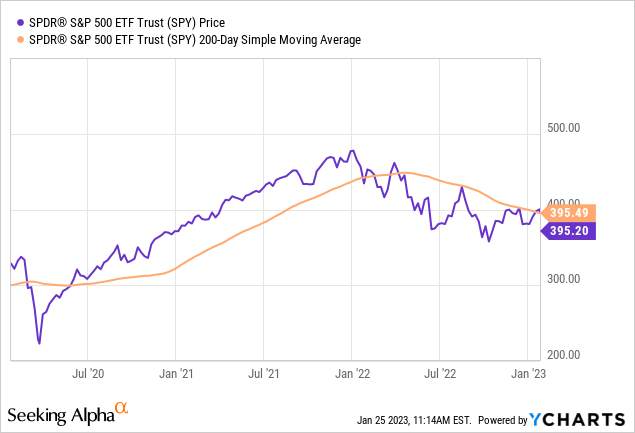
Clearly, the bear market in SPY has been paused, as SPY is essentially flat over the last 6 months. The resolute technical breakout above the 200dma could bring the trend-followers, which could cause the spike in price - and the change in trend to uptrend. So, how does this downtrend pause, or potential change in the trend fit into the bearish outlook?
The Phase 2 selloff is forthcoming
As my followers already know, my research shows that the full bear market has three distinctive stages. In fact, I did accurately predict the 2022 selloff, and the beginning of the bear market pause starting in May 2022. These are the bear market Phases:
- The Phase 1: The liquidity-based selloff induced by the expectations of the aggressive monetary policy tightening. In this stage, the excessive speculative bubbles are busted, such as Bitcoin, meme stocks, and overvalued tech. This is essentially what Grantham refers to as the 2022 easily predicted bear market stage.
- The Phase 2: The recessionary selloff. In this stage, the economic environment deteriorates, the corporate earnings get revised lower, and the valuation multiple contracts. This is eventually what Grantham sees as the last, but more uncertain stage of the bear market.
- The Phase 3: The credit crunch. This is the ultimate stage of the bear market, and the most painful stage of the bear market due to the forced selling and the margin calls. This is what some people call the "when something breaks" stage, or the "ultimate capitulation" stage.
So where are we now? As I mentioned in my outlook, we are now in-between the Phase 1 and the Phase 2. The Fed is near the end of the interest rate tightening cycle, which ends the Phase 1, but we are still not in a recession - so the Phase 2 selloff has not started yet. Thus, we are at the bear market pause stage.
However, the Phase 2 selloff is forthcoming. The inverted yield curve, which Grantham also refers to, is signaling a deep recession. In fact, the survey type data, such as the PMIs have been signaling the recession since the mid-2022. For example, the composite PMI has been below 50 (negative growth) since July 2022. Here is the chart:
Trading Economics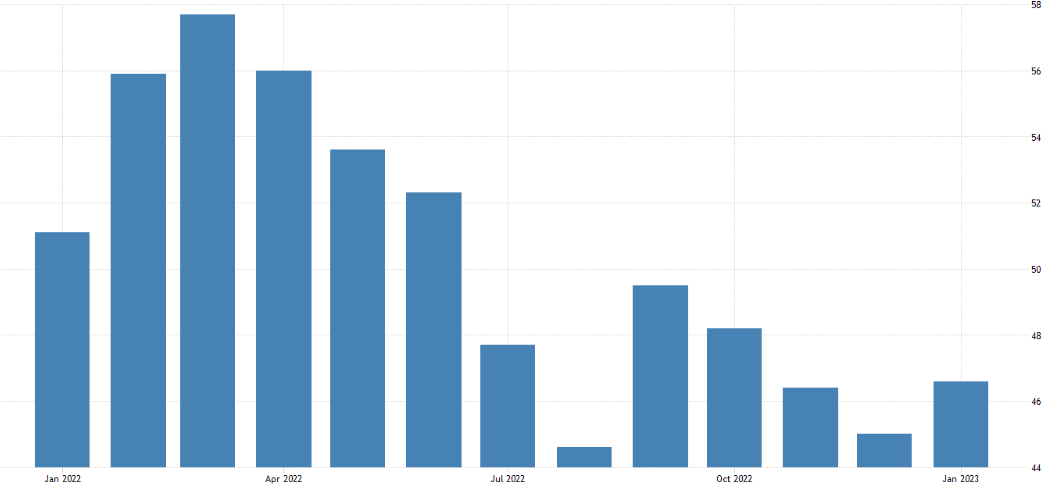
The S&P 500 is facing this recession overvalued, with the P/E ratio near 21, while the historical average is 15-16x. Thus, this next stage of the bear market, or the Phase 2, could be also very painful, as the valuation contracts possibly by 23%, which put the S&P 500 near the 3000 level.
But watch out for the Phase 3 of the bear market
Grantham sees the recessionary selloff as the ultimate stage of the bear market. However, there is the Phase 3. This is when something breaks, which causes the credit crunch, forced selling, and the ultimate capitulation.
At this point, it's premature to discuss the Phase 3 stage, as we are not in the Phase 2 stage yet, and we don't know yet "what is going to break," or whether anything will break at all. However, Grantham does mention the possibility of the S&P500 going to the 2000 level, and even refers to the P/E ratio dropping down to 7x. This is obviously what I refer to as the Phase 3 selloff, and at this point, this is just the downside risk, but not part of the outlook.
Implications
The bullish investors see the Phase 1 and the Phase 2 interphase as the bear market bottom, rather than as the bear market pause. The technical "breakout" could cause the bull market trap, as many will buy in anticipation of the new bull market. The bullish narrative is that the Phase 1 is finished - the Fed is done, and there will be only a soft landing - no Phase 2 selloff.
This is a possible scenario, but unlikely. The Fed needs the recession to ease the labor shortage, if nothing else. The Fed's target is 4.6% unemployment rate (currently 3.5%) - so the increase in the unemployment rate is recessionary by definition. So, bulls are fighting the Fed.
The Phase 2 selloff is likely imminent, as the real economic data is likely to start deteriorating, following the signals from the survey type data. Thus, the next leg of the bear market is likely forthcoming.
The SPY sector analysis
SPY is up YTD by 4.62% - a strong January performance, which Grantham refers to as the "January effect." However, the rally has been led by the cyclical sectors: Communications XLC, Discretionary XLY, and Technology XLK. This type of leadership before an imminent recession is not sustainable, which supports the thesis that the recent rally is just the bear market rally.
S&P 500 Index | +4.62% | ||
Communication Services XLC | +12.27% | ||
Consumer Discretionary XLY | +9.16% | ||
Consumer Staples XLP | -1.88% | ||
Energy XLE | +3.18% | ||
Financials XLF | +4.62% | ||
Health Care XLV | -1.74% | ||
Industrials XLI | +2.57% | ||
Materials XLB | +6.98% | ||
Real Estate XLRE | +6.96% | ||
Technology XLK | +7.90% | ||
Utilities XLU | -1.28% |
This article was written by

Disclosure: I/we have a beneficial short position in the shares of SPX either through stock ownership, options, or other derivatives. I wrote this article myself, and it expresses my own opinions. I am not receiving compensation for it (other than from Seeking Alpha). I have no business relationship with any company whose stock is mentioned in this article.