Nandish Shah, Senior Derivative & Technical Analyst at HDFC Securities
The short term trend remains positive as Nifty managed to close above its 20-day EMA (exponential moving average) which is currently placed at 18,450 odd levels. Moreover, Nifty also closed above its previous swing close of 18,410 (November 16) which would interchange its role as a support. In the Option segment, Puts being written at 18,300-18,400 levels which coincides with the Monday’s intraday low of 18,350 odd levels.
Therefore, on the downside, 18,350-18,450 could now be considered as an immediate support for the Nifty and short-term trend will remain positive till Nifty is trading above 18,350 levels.
A move below 18,350 can take the Nifty further down to the previous swing lows of 18,133.
All eyes will be on the US Federal Reserve as it wraps up a two-day FOMC meeting and pronounces its verdict on interest rates' pace and magnitude.
On the upside, 18,665-18,729 could act as an immediate resistance for Nifty. Nifty may see sharp upside momentum once Nifty manages to surpass 18,729 convincingly.
Nifty Midcap and Smallcap registered smart recovery from session's low on Monday and both the indices closed near session's high with advancing shares outnumbered the declining shares on BSE. Nifty midcap/ small cap indices have outperformed the benchmark index in the December month till now and we expect their outperformance to continue during the comings weeks.
Here are three buy calls for the next 3-4 weeks:
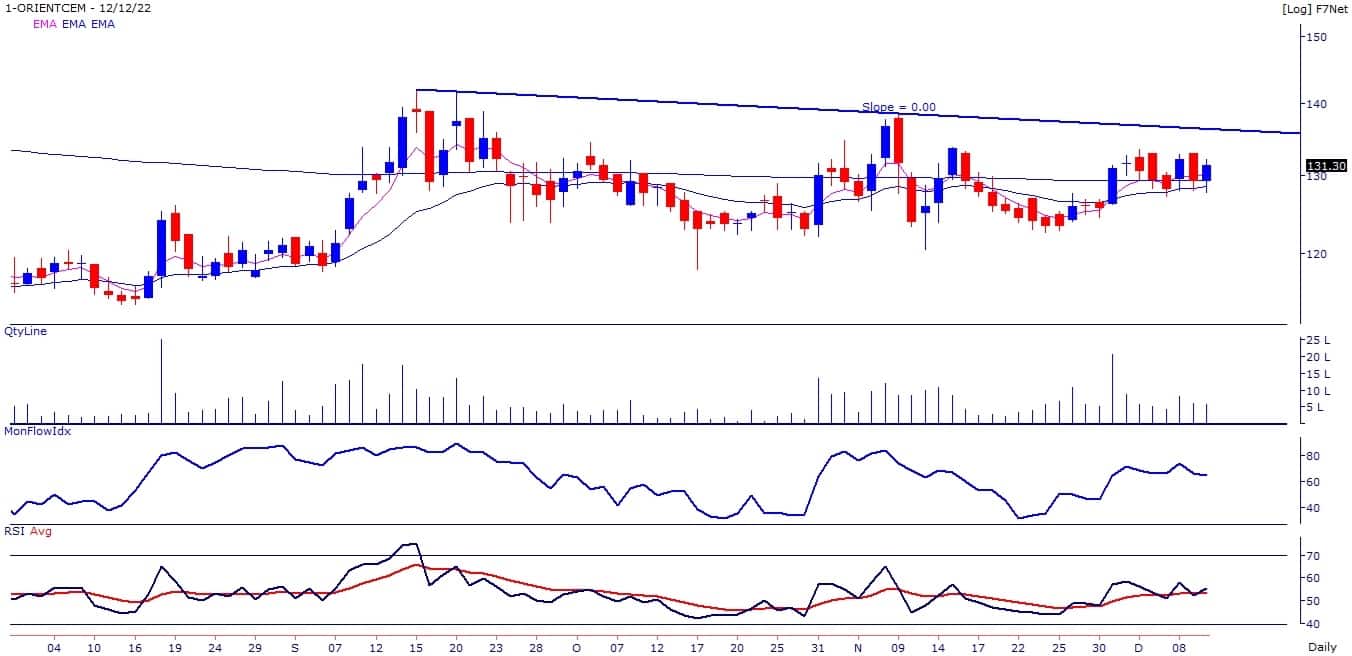
Orient Cement: Buy | LTP: Rs 131.3 | Stop-Loss: Rs 125 | Target: Rs 139-145 | Return: 10 percent
Accumulation was seen in the Orient Cement from November where volumes were higher on up days as compared to down days. Short term trend of the stock is positive as stock price has closed above its 5, 11 and 20-day EMA.
The stock price is on the verge of breaking out from the downward sloping trendline on the daily chart, adjoining the highs of September 20 and November 9, 2022. Momentum Oscillators like RSI (relative strength index - 11) and MFI (money flow index - 10) are placed above 50, indicating strength in the stock. One can buy the stock in the range of Rs 131.3-128.
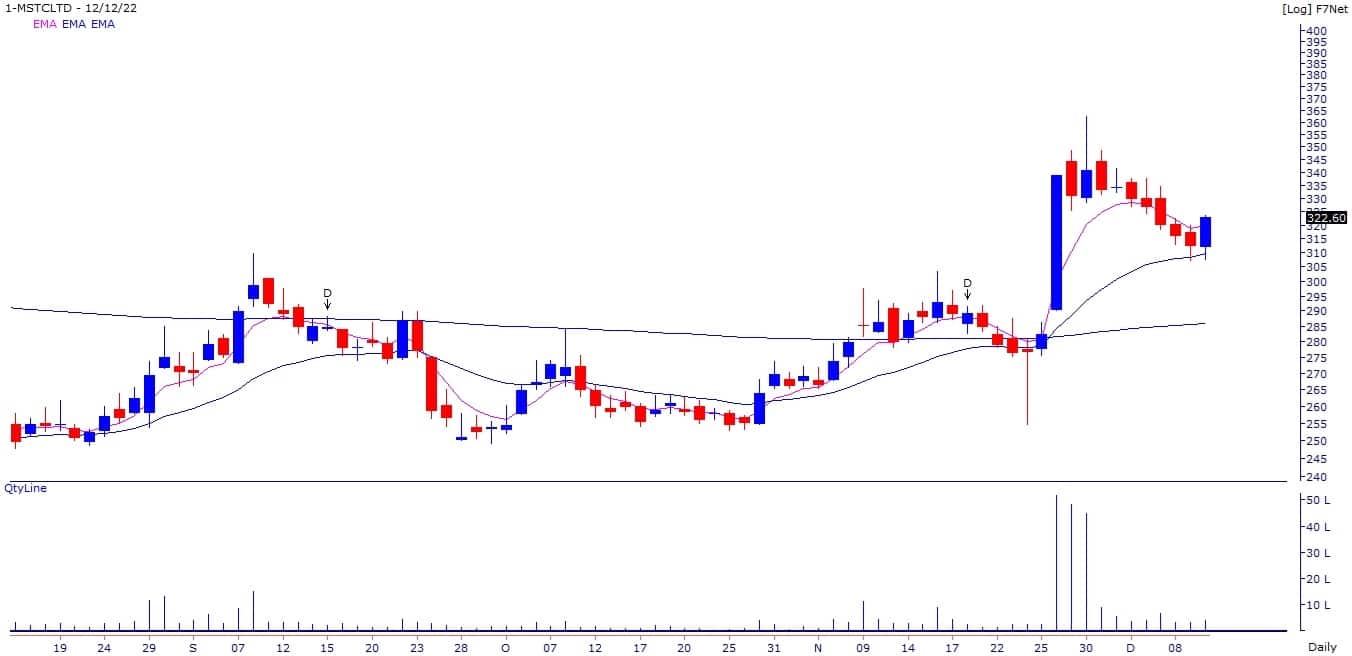
MSTC: Buy | LTP: Rs 321.45 | Stop-Loss: Rs 300 | Target: Rs 347-360 | Return: 12 percent
After taking support at 20-day EMA, the stock price reversed northward to trade above its 5 and 11-day EMA. Primary trend of the stock is positive as stock price is trading above its 100 and 200-day EMA.
Accumulation was seen in the MSTC during last couple of months where volumes were higher on up days as compared to down days.
RSI and MFI oscillator is placed above 50 and rising upwards on the weekly chart, indicating strength in the current uptrend. One can buy the stock in the range of Rs 321-310.
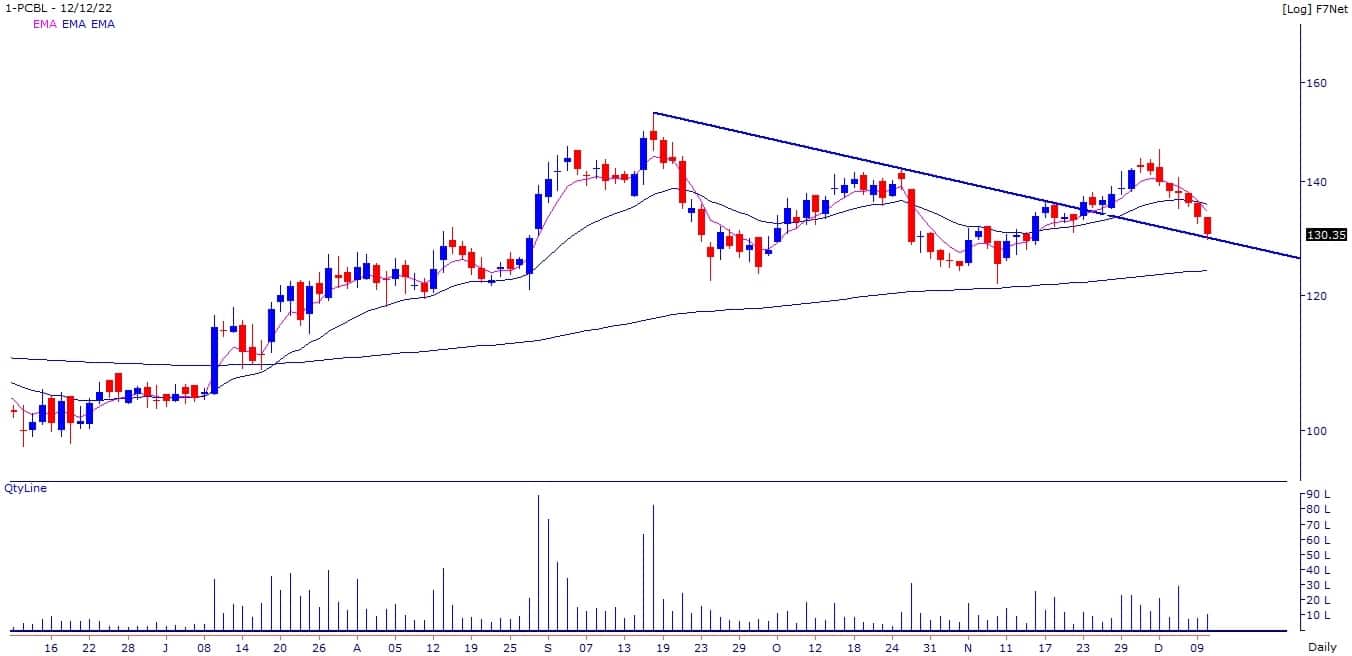
PCBL: Buy | LTP: Rs 130.35 | Stop-Loss: Rs 123 | Target: Rs 140-144 | Return: 10 percent
The stock price has witnessed running correction during the last few days and now reached close to the trendline support. Stock price has formed multiple bottoms around Rs 124 odd levels in September-November which coincides with the 200-day EMA which is placed around Rs 124 levels.
Primary trend remains positive as stock price is trading above its 100 and 200-day EMA. Therefore, we believe that risk reward is favourable in buying stocks at current levels. One can buy the stock in the range of Rs 130.35-127.
 Disclaimer: The views and investment tips expressed by investment experts on Moneycontrol.com are their own and not those of the website or its management. Moneycontrol.com advises users to check with certified experts before taking any investment decisions.