The Nifty managed to close above its trend line and horizontal resistance level of 18,200 on November 7 to start its dream journey toward 19,000. But on the way up, 18,350 will act as resistance, while 18,000 will be the immediate support in case of a correction.
The Bank Nifty came out of its consolidation range of 40,800-41,600 to close above 41,600 in the previous trading session. It may find resistance at its lifetime high of 41,800–42,000. On the downside, support is at 41,000 followed by 40,800-40,500.
If the banking index manages to go past 42,000, we can expect a move towards 42,500-43,000.
India VIX, the volatility index, trading below the 200-DMA gave confidence to bulls, and second-quarter numbers will continue to lead the stock-specific movement.
Global markets are also showing some signs of relief, however, the dollar index, bond yields and US macro data will remain in focus.
Here are three buy calls for the next two-three weeks:
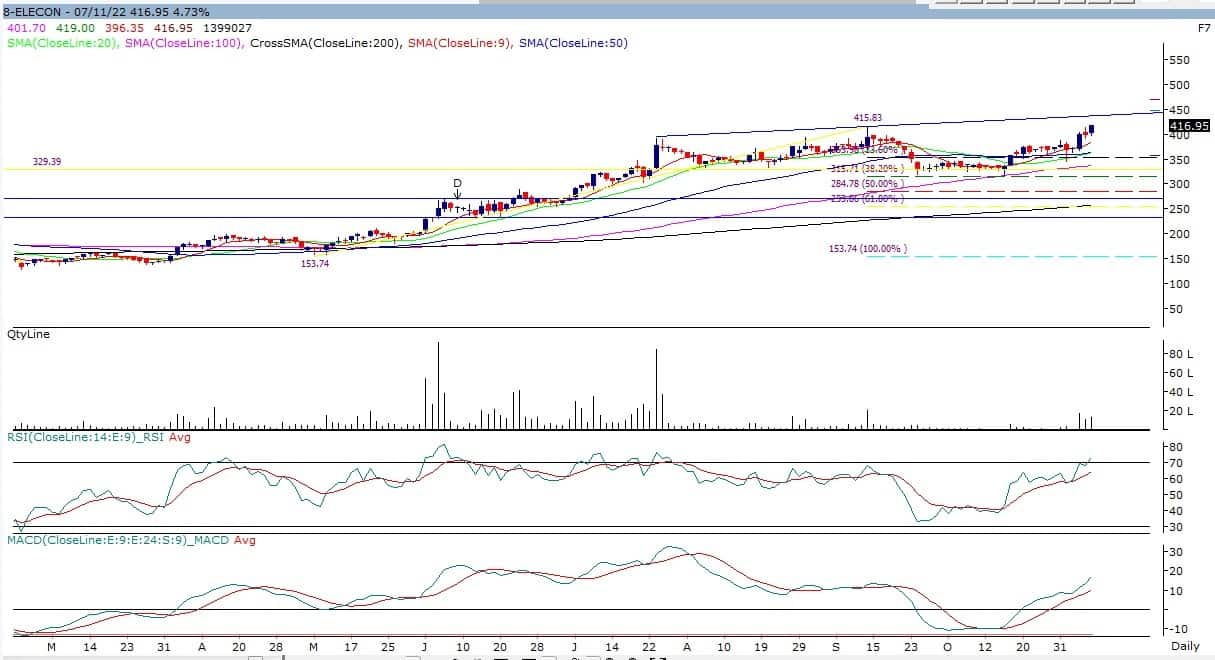
Elecon Engineering Company: Buy | LTP: Rs 417 | Stop-Loss: Rs 377 | Target: Rs 484 | return: 16 percent
The stock is looking lucrative on technical fronts. It has bounced back from a 38.2 percent retracement of the previous rally. It is trading above its all-important moving averages with higher highs and higher low formations.
On the higher time frame, there is a breakout of a bullish Flag formation, which suggests much more upside in this counter. The momentum indicator relative strength index (RSI) is trading above the 50 mark with a positive bias, whereas moving average convergence and divergence (MACD) is witnessing a centerline crossover.
On the upside, Rs 430 will be an immediate hurdle but Rs 484 looks like an imminent target in the near term. On the downside, the 9-simple moving average (SMA) of Rs 377 is a strong support level.
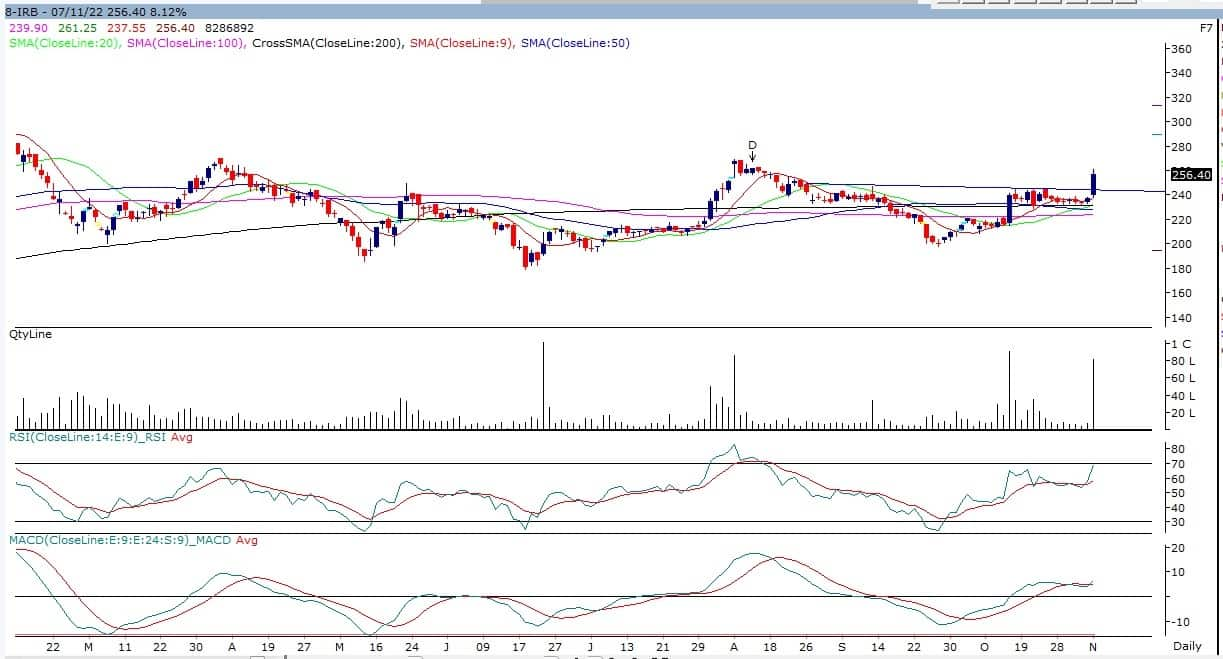
IRB Infrastructure Developers: Buy | LTP: Rs 256 | Stop-Loss: Rs 227 | Target: Rs 314 | Return: 22 percent
The structure of the counter is bullish, as it has witnessed a breakout of an Inverse Head & Shoulder formation with huge volume on the daily chart. It is coming out of a long consolidation range with a triangle formation breakout on the weekly chart.
It is trading above its all-important moving averages with higher highs and higher low formations. On the upside, Rs 270 is the immediate horizontal resistance, above this, we can expect Rs 300+ in the near term.
On the downside, a clustre of moving averages formed the base at around Rs 227.
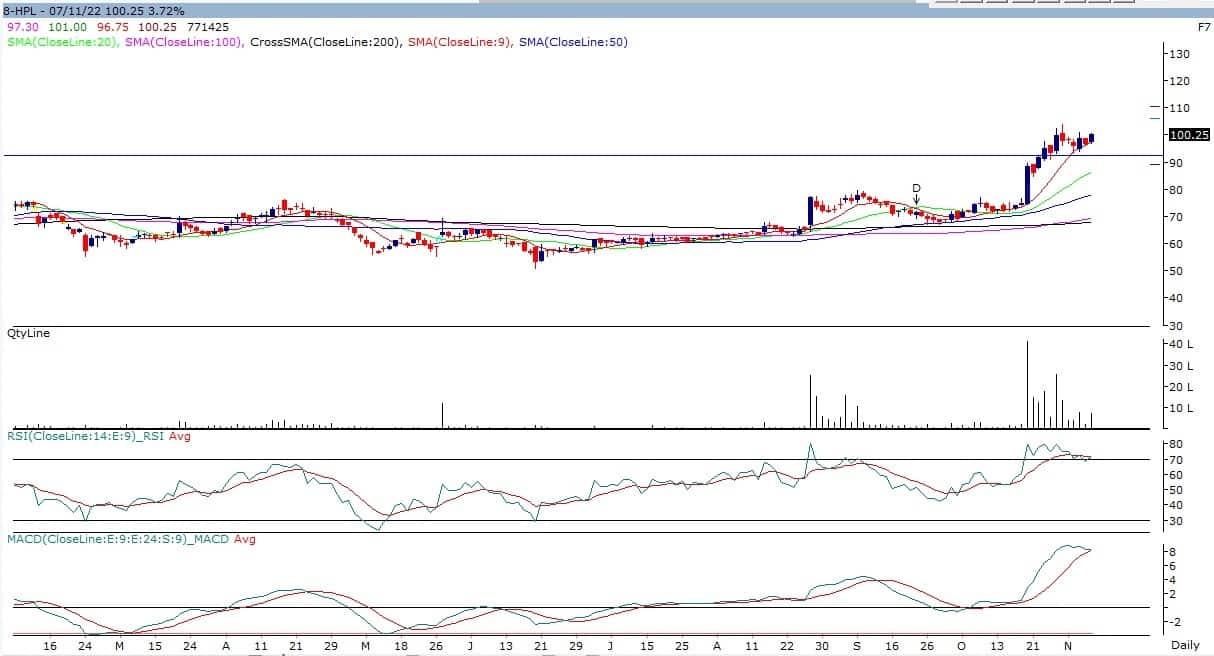
HPL Electric and Power: Buy | LTP: Rs 100 | Stop-Loss: Rs 87 | Target: Rs 124 | Return: 24 percent
The counter is in classical bullish momentum and forming a Flag on the daily chart. The overall structure is lucrative, as the counter is trading above all its moving averages.
RSI is also positively poised and MACD is supporting the current strength.
On the higher side, Rs 105 is the immediate resistance, above which one can expect Rs 124 levels in the near term. On the lower side, Rs 87 will be an important support during a correction.