 No matter how you look at data, it is visibly evident that the pace of decline in poverty, whether measured through the conventional unidimensional way or through using modern multidimensional measures, accelerated post-2014. (Representational Photo: Bloomberg)
The recent release of the NFHS data for 2019-21 allows for a detailed analysis of the progress in the reduction of absolute poverty and related determinants like nutrition. Very few, if any, are disputing the trend of poverty decline in India; some residual debate is on the subject of whether there was a larger rate of decline in the UPA Sonia Gandhi-Manmohan Singh period between 2004-2013 or the NDA Narendra Modi period 2014-2021. The latter question is our major concern in this article. Our previous articles on the subject began with ‘Why chemistry trumps arithmetic‘ (IE, June 1, 2019) followed up by ‘Rethink poverty — and policy‘ (IE, June 29, 2019). Both argued that India’s economic growth had been the most inclusive between 2014 and 2019. This assertion was backed by strong empirical evidence, yet it was strongly contested by some. The presentation at NCAER in February 2020 of an early draft of our IMF working paper with Arvind Virmani, ‘Pandemic, Poverty and Inequality — Evidence from India’ (April 2022), was viewed with much scepticism as many argued that extreme poverty had not only not declined, but increased between 2014 and 2019. The latter out-of-the-box interpretation has now also been contested by several authors at the World Bank. The accepted conclusion now is: Poverty did decline between 2011-12 and 2017-18 or 2019-20 (recall that the 2017-18 unpublished NSS survey of consumption expenditures had indicated an 8 per cent decline in rural consumption and a corresponding increase in extreme poverty).
Policy-makers and academics have given a higher priority to the poverty-reducing properties of inclusive growth rather than growth per se. The two time periods under examination – 2005 to 2011 (P-1) and 2011 to 2021 (P-2) – are separated by per capita income growth declining in the world (2.8 to 2.2 per cent) and in India (from 6.3 to 4.4 per cent). A priori, we would expect poverty to have declined at a faster pace during 2005-11. Did it? It did not.
The detailed NFHS data for 2005-6, 2015-16 and 2019-21 (supplemented by NCAER 2011/12 NCAER IHDS survey) allow us to close this debate — indeed, the data suggests that there is no debate. The NFHS surveys are part of a multinational attempt to provide estimates of a multidimensional poverty index. Its computation rests on estimates of poverty according to 10 different indicators (see table). The deprivation index for each indicator is the per cent poor (deprived) according to that indicator. The aggregation of the 10 indicators into one index involves legitimate issues of weighting, but individual components do not suffer from this drawback.
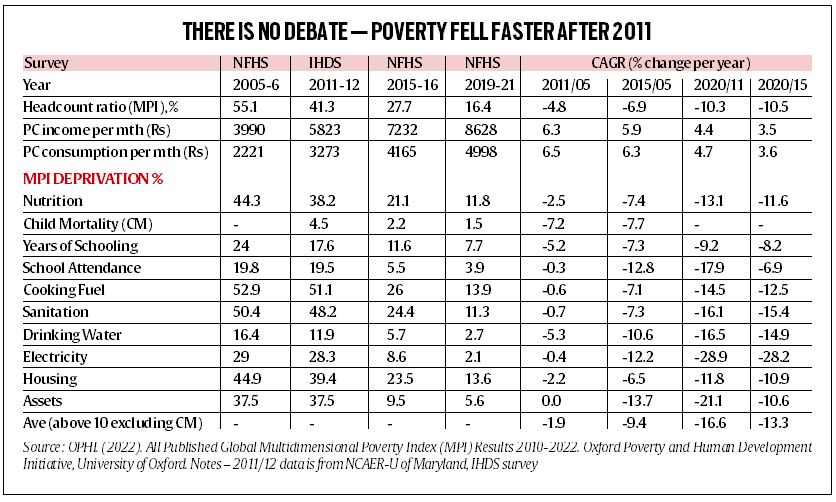
First, the data facts. In addition to the NFHS indicator data, national accounts data for income and consumption are also reported. The result: Multidimensional poverty declined at a compounded annual average rate of 4.8 per cent per year in P-1 and more than double that pace at 10.3 per cent a year during P-2. There are some issues with the 2011 child-mortality data, but for each of the 10 components of the MPI index, the rate of decline in P-2 is considerably faster than in P-1. The average equally weighted decline for nine indicators was 1.9 per cent per annum in P-1 and a rate of 16.6 per cent per annum, more than eight times higher in P-2. This unambiguous and strong conclusion needs further investigation – what made growth so inclusive in P-2?
Very recently, yet another poverty indicator has been released – the Global Hunger Index (GHI). This index does show a worsening of hunger in India between 2014 and 2021, and hence contradicts the large improvement documented in the NFHS data. In a well-researched article titled ‘How not to measure hunger’ (IE, October 21), Sonalde Desai (also the project leader of the IHDS survey) documents the many flaws in the GHI. We only want to add that the DHS nutrition index improved at a 2.5 per cent rate during 2005/11 and at a more than five times faster rate during 2020/11. A similar improvement is found in nutrition deprivation, which registered a CAGR decline of 11.6 per cent from 2015 onward. Both NFHS and GHI cannot possibly be right.
Before we proceed, some additional data and perspective on inclusive growth. Every single household survey or analysis has shown that consumption inequality declined during P-2. This is consistent with the above finding of highly inclusive growth during P-2. But what made growth so inclusive? Inclusion, like growth, does not fall like manna from heaven.
This improvement is not by chance but a reflection of several public policy initiatives by the Modi government. A major factor behind the inclusive nature of growth during P-2 is the focus of government policies on each of the individual indicators indicative of a dignified standard of living. A direct impact of this dedicated fiscal push is that slow-moving variables such as housing, access to cooking fuel, sanitation, etc, have witnessed a remarkable increase. Take access to toilets. The Modi government’s Swachh Bharat mission in P-2 constructed over 110 million toilets — even if some were without easy access to water, many were. Similarly, close to one-third of Indians were deprived of electricity till as recently as 2014. It was only after a dedicated push (Saubhagya Yojana) that India managed to electrify every village, and eventually households. Electricity deprivation declined by a 28.2 per cent rate post-2014; between 2005 and 2011, the rate of decline was close to zero. Another example is the Jan Dhan Yojana which made financial inclusion a reality in India, especially for women.
There are other examples. On access to modern cooking fuel (through the Ujjwala Yojana), deprivation was nearly halved from 26 per cent to 14 per cent in just five years. The previous halving (2005/6 to 2015/16) took 10 years. The affordable housing scheme (Awas Yojana) has meant that less than 14 per cent are now deprived, compared to thrice that number in 2011/12. More recently, after 2019, PM Modi has embarked on an ambitious project of ensuring universal access to piped water under the Jal Jeevan Mission. Rural piped water coverage was a little less than 17 per cent in 2019, but is now well above 54 per cent and expected to at least be near, if not meet, the 100 per cent target by 2024.
It is the proactive use of fiscal policy combined with effective targeting that marks a crucial departure from the earlier attempt of spending money “in the name of the poor”. This departure has delivered in terms of ensuring that the benefits of growth are more equitably distributed across a wider class of citizens. The decline in multidimensional poverty and in extreme poverty is a manifestation of the success of the Modi government in delivering a dignified standard of living to all, but more importantly, in transforming deemed luxuries into necessities. This was achieved without making them rights, but rather focusing on effective delivery through improved targeting marking a sharp departure from the “entitlements”-based approach between 2004-13.
No matter how you look at data, it is visibly evident that the pace of decline in poverty, whether measured through the conventional unidimensional way or through using modern multidimensional measures, accelerated post-2014. India’s poverty decline was already remarkable before 2014. Now, it is second to none. Finally, it is worth noting that except for the 2017-18 dubious NSS survey, India makes public all of its data. In contrast, unit-level poverty data on China is not even made available to the World Bank, a body authorised to publish country-level estimates of poverty.
Bhalla is former executive director, IMF and Bhasin is pursuing a PhD at SUNY, Albany. Views expressed are personal