Vidnyan Sawant, AVP - Technical Research at GEPL Capital
In monthly timeframe, prices are sustaining below prior month low, suggesting corrective undertone in the index.
On the weekly chart of Nifty, prices have given a breakdown from the Double Top pattern which indicates beginning of the trend on the downside.
Prices in daily time frame have sustained below 50 day SMA (simple moving average), confirms the reversal of trend on the downside.
RSI in the daily timeframe has formed lower low, lower high which reflects the lack of positive momentum for short to medium term.
The index has its immediate support placed at the level of 16,788 (20 week SMA) and 16,653 (key support). On the other hand, the resistance is placed at the level of 17,196 (weekly high) followed by 17,324 (key resistance).
Looking at the overall chart pattern, we feel that if the Nifty breaches below 16,788 (20 week SMA) then the prices can go lower till the level of 16,653 (gap support) followed by 16,463 (swing low).
Here are three buy calls for next 2-3 weeks:
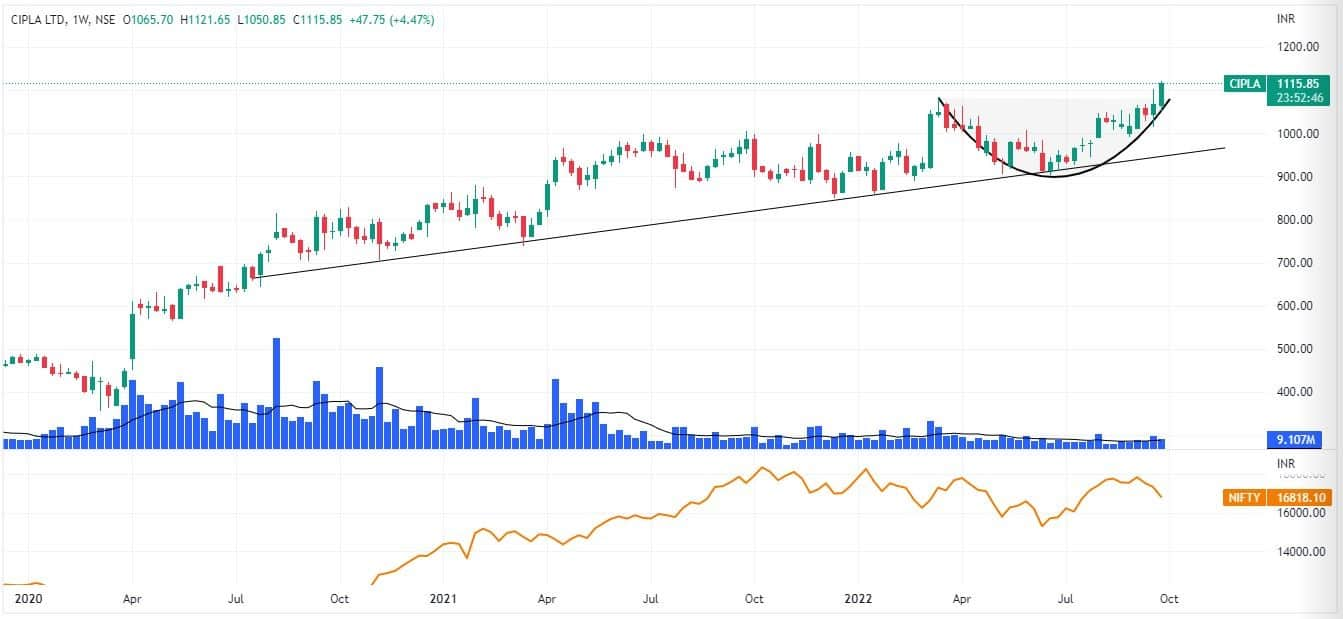
Cipla: Buy | LTP: Rs 1,115.85 | Stop-Loss: Rs 1,060 | Target: Rs 1,250 | Return: 12 percent
Comparing the price chart of Cipla versus Nifty, we can spot that post October 2021 the benchmark index Nifty formed lower low, lower high pattern but the Cipla did not get into the mentioned pattern. This shows that the Cipla is relatively stronger.
Prices in the latest trading week has given a breakout from the rounding bottom pattern while taking support from the bullish trend line indicating the beginning of trend on the upside. The Trend line has been respected by the prices since July 2020.
The stock is continuously hovering around the upper Bollinger band on the daily charts which points towards the rising volatility of the prices for upside move.
RSI (relative strength index) on the daily timeframe is roaming between 70 and 50 levels without attempting to enter oversold zone reflects the strong momentum in the prices.
Going ahead, we expect the prices to go higher till the level of Rs 1,250 where the stop-loss must be Rs 1,060 on the closing basis.
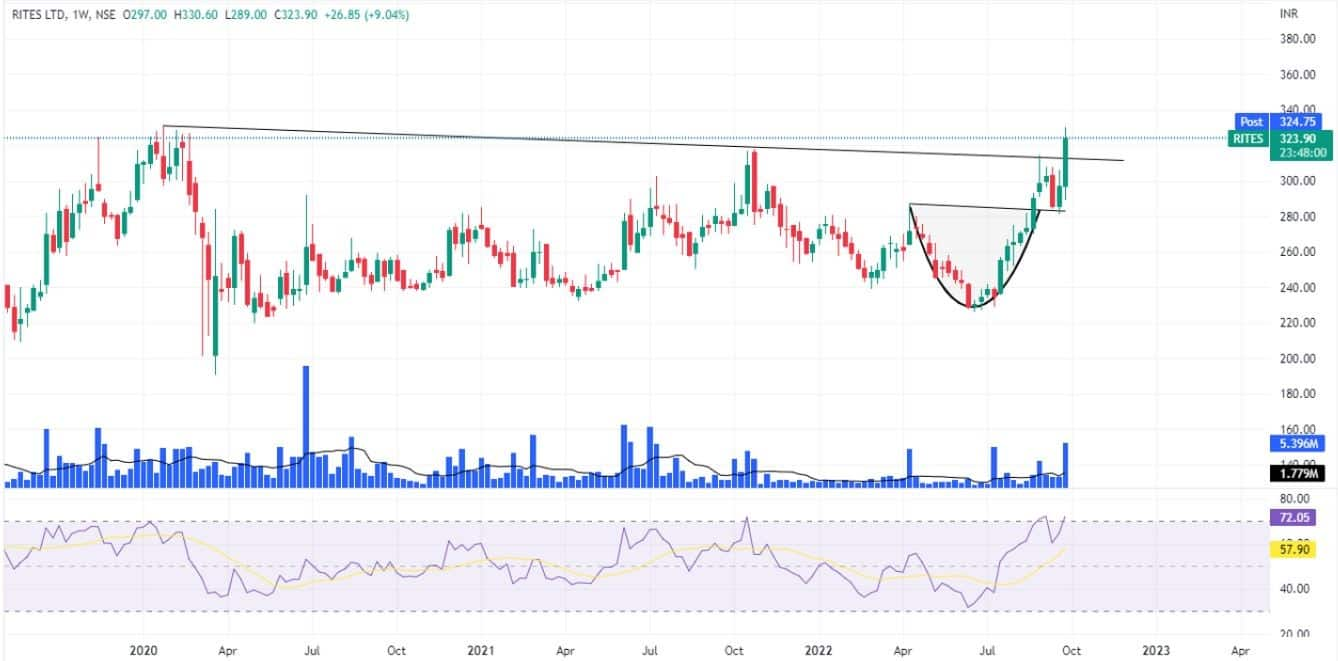
RITES: Buy | LTP: Rs 323.90 | Stop-Loss: Rs 285 | Target: Rs 400 | Return: 23 percent
RITES is currently nearing its record high level which shows that the prices are already in a strong momentum.
Post breakout from the rounding bottom pattern on August 22, 2022, prices retested the neckline and have shown a faster bounce on upside pointing towards beginning of the trend on the upside.
The breakout is accompanied by the volumes which hereby confirms the breakout.
The Bollinger band has opened with the rising volumes advising the rise in volatility for upside move.
RSI on the weekly as well as on daily timeframe have sustained above 50 mark reflecting strong momentum built up in the stock.
Going ahead, we expect the prices to go higher till the level of Rs 400 where the stop-loss must be Rs 285 on the closing basis.
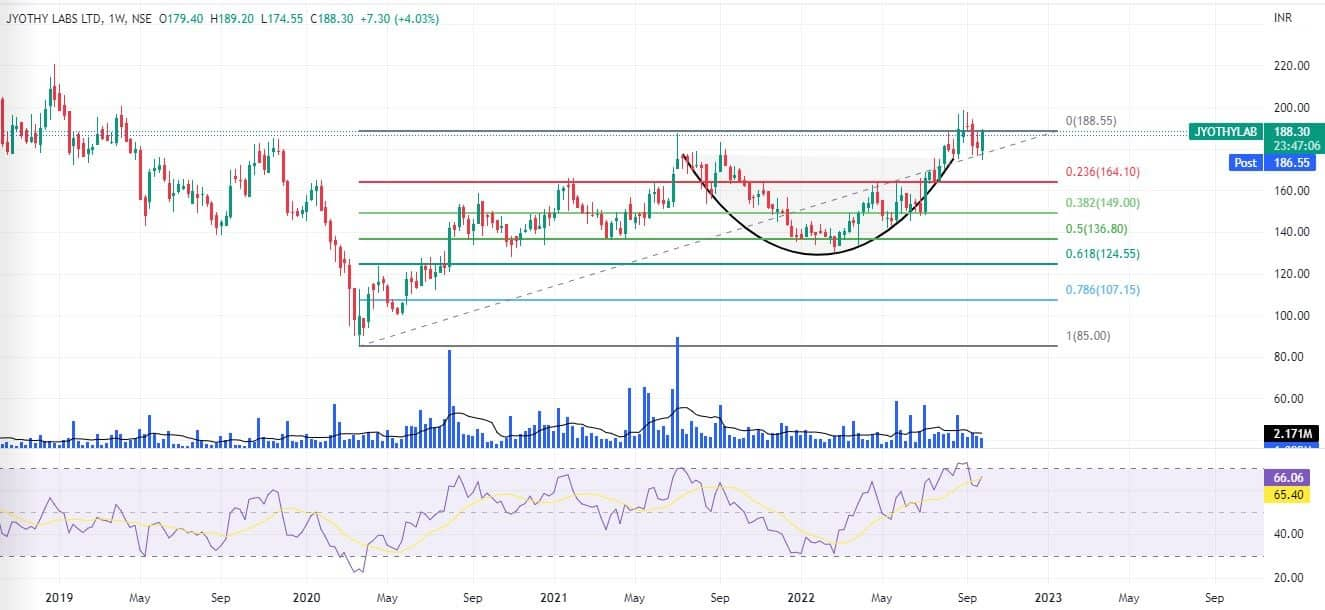
Jyothy Labs: Buy | LTP: Rs 188.30 | Stop-Loss: Rs 285 | Target: Rs 222 | Return: 18 percent
Jyothy Labs has shown a bounce on the upside while taking support from the 50 percent Fibonacci retracement level from March 2020 low of Rs 85 level to Rs 187.3 high of July 2021.
Post breakout from the rounding bottom pattern in August 2022, prices retested the neckline and have shown a bounce on upside pointing towards beginning of the trend on the upside.
Prices on the daily timeframe are above key moving averages which confirms the trend is on the upside.
RSI on the weekly as well as on daily timeframe have sustained above 50 mark reflecting strong momentum in the stock.
Going ahead, we expect the prices to go higher till the level of Rs 222 where the stop-loss must be Rs 285 on the closing basis.