The weakness in global peers following rate hike by the US Federal Reserve weighed on the Indian equity markets on September 22. While the benchmark share indices fell half a percent each, the broader markets performed better with Nifty Midcap 100 and Smallcap 100 indices rising a third of a percent and six-tenth of a percent respectively.
The BSE Sensex declined more than 300 points to 59,120, and the Nifty50 fell 89 points to 17,630, dragged by banking & financial services, and select IT stocks.
Stocks that were in action and performed better than broader markets included Tata Chemicals which was the second largest gainer in the futures & options segment. The stock rose nearly 5 percent to settle at Rs 1,150 apiece. It has seen a robust bullish engulfing candlestick pattern on the daily charts with above average volumes.
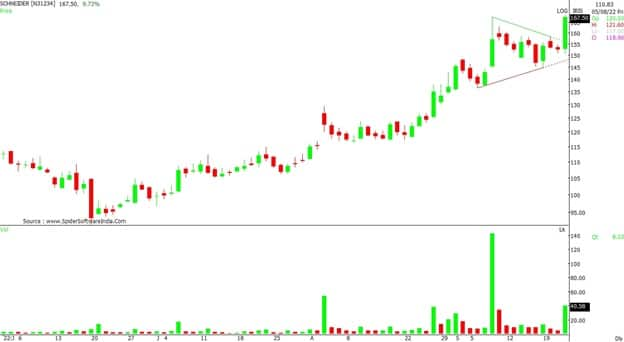
Schneider Electric Infrastructure shares surged over 9 percent to Rs 166.70, the highest closing level since November 1, 2016 and formed strong bullish candle on the daily charts with above average volumes. On monthly charts, the stock has seen a breakout of long downward sloping resistance trend line adjoining June 1, 2015 and April 1, 2022, and the uptrend has been maintained for third consecutive month.
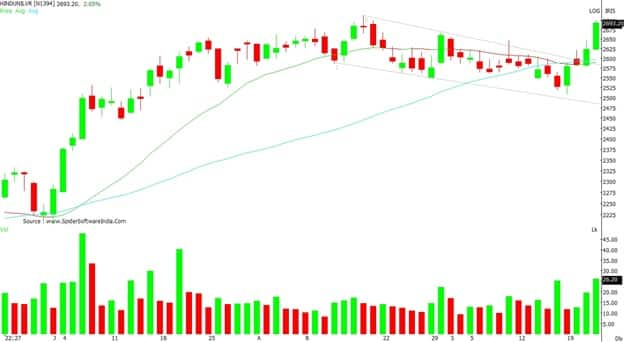
Hindustan Unilever was up 2.6 percent at Rs 2,693, the highest closing level since October 5, 2021, continuing uptrend for fourth straight session and formed bullish candle on the daily charts with healthy volumes.
Here's what Shrikant Chouhan of Kotak Securities recommends investors should do with these stocks when the market resumes trading today:
After a short term correction, the stock took the support near Rs 2,500 level and reversed sharply. In this week so far, the stock rallied over 6 percent and formed long bullish candle on daily and weekly charts, which is broadly positive.
We are of the view that, as long as the stock is trading above 50 days SMA (simple moving average) or Rs 2,610, the uptrend texture is likely to continue.
Above which, the stock could move up to Rs 2,750. Further upside may also continue which could lift the stock up to Rs 2,800. However, below Rs 2,610 uptrend would be vulnerable.
After a short term correction, the stock has formed double bottom formation near Rs 1,100. On last Thursday, the stock bounced back sharply, rallied over 5 percent.
On daily charts the stock has formed long bullish candle and currently it is comfortably trading above 20 days SMA (simple moving average) level of Rs 1,127.
Unless it is trading below Rs 1,105, positional traders retain an optimistic stance and look for a target Rs 1,195-Rs 1,225 fresh buying can be considered now and on dips, if any between Rs 1,155 and Rs 1,125 levels with a stop-loss below Rs 1,105.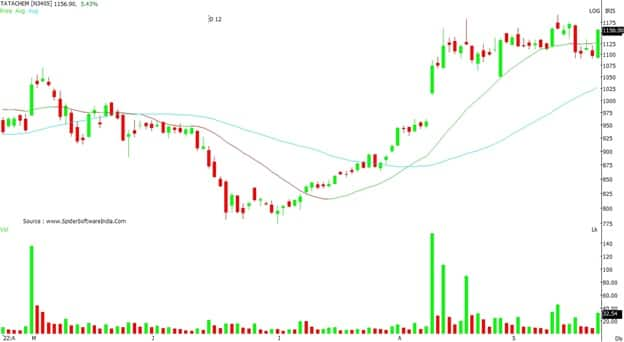
The stock has rallied nearly 10 percent on September 22. On last Thursday, it quickly cleared the short term resistance of Rs 160 with a strong volume activity and after a promising intraday rally, it succeeded to close above the same.
Despite weak market conditions the stock maintained its strong momentum throughout the day. On the short term time frame, the stock has formed strong price volume breakout pattern.
The texture of the pattern suggest breakout action will continue in the near term if stock succeeds to trade above Rs 158 level.
For the swing traders, Rs 158 would be the sacrosanct level, trading above the same we can expect uptrend continuation wave up to Rs 180-185.