Is Macerich Company A Value Trap?
Summary
- The Macerich Company, like Tanger and Simon Property Group, has a unique approach to retail commercial real estate.
- Macerich doesn't have Simon's scale or balance sheet. But MAC's portfolio holds $11 billion in gross assets, many of which are high-quality.
- Macerich has recently reduced debt and trades at only 6.5x forward FFO flow estimates.
- Let's find out if MAC stock is a good buy after recently setting a 52-week low.
- Looking for a helping hand in the market? Members of iREIT on Alpha get exclusive ideas and guidance to navigate any climate. Learn More »
Dmytro Lastovych/iStock via Getty Images
This article was coproduced with Williams Equity Research (WER).
Let's start out right away with the bad news about mall real estate investment trust (REIT) The Macerich Company (NYSE:MAC). Here's where it's traded in recent years…
(Source: Yahoo! Finance)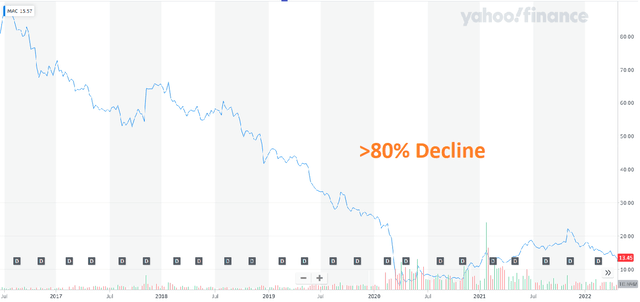
It's done better on a total return basis, but it's still lost most of its value in the past five years. Moreover, here's how it stacks up against competitors Simon Property Group (SPG) and Tanger Factory Outlet Centers (SKT).
(Source: Yahoo! Finance)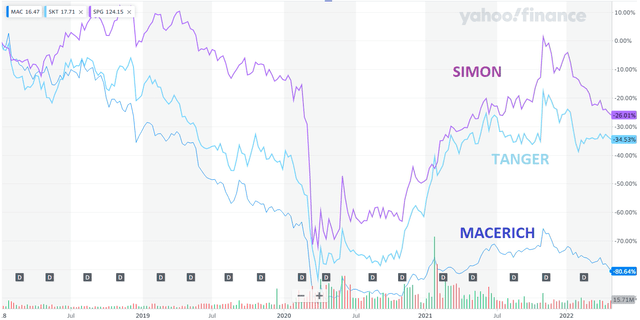
So we can see just how poorly the stock has performed.
On a total return basis – depending on whether dividends were reinvested – Tanger investors are down just 10%-15% from five years ago. Whereas Simon is up around 10%-15%.
(These numbers would both be about 25% higher if we took a snapshot in November 2021.)
Macerich, meanwhile, has lost approximately two-thirds of its value due to deteriorating per-share cash flow and a declining dividend.
Here's MAC stock's 2019 payouts:
(Source: Macerich)
But that $3 per share went out the window once 2020's lockdowns hit.
(Source: Macerich)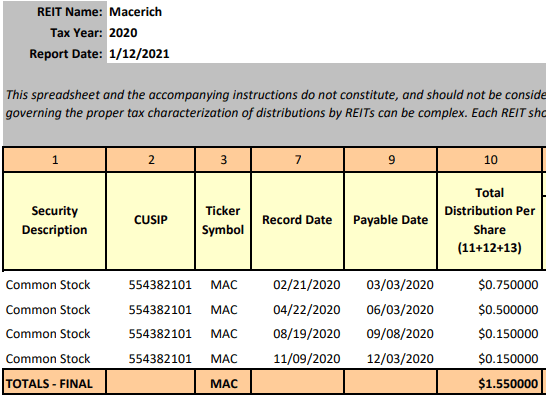
Macerich cut its dividend by 33.3% in Q2 and then another 70% in Q3, where it stayed in 2021.
(Source: Macerich)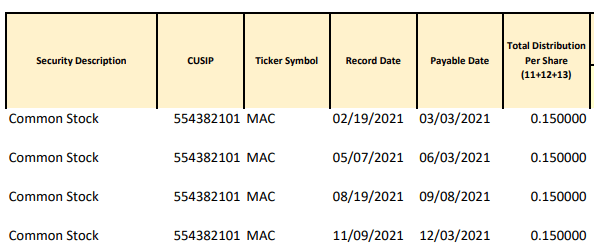
Today, MAC is a mere 20% of pre-pandemic levels. The only immediate consolation prize is its nearly 5% yield… because of its shares' substantial depreciation.
Key Portfolio Facts Of Macerich
So where does that leave us today?
It depends on the level and trends in Macerich's cash flow per share alongside its operations and balance sheet. Its valuation is squarely in distressed territory. But if its financials aren't nearly as bad?
We could have a solid opportunity on our hands.
(Source: Macerich Q4 2021 Earnings Presentation)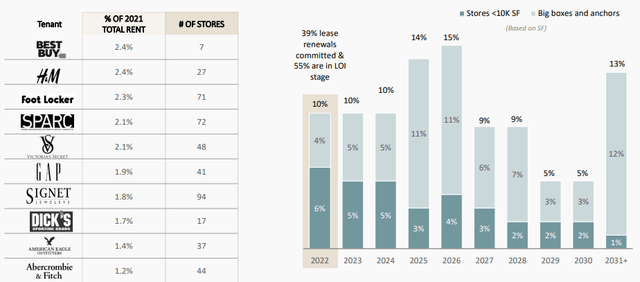
With its 44 portfolio centers spread across many top metropolitan statistical areas ("MSAs"), Macerich has sufficiently good tenant and geographical diversification. Its top 10 tenants are what you'd expect from a firm of its specifics, scope, and size.
These include Best Buy (BBY), H&M, Foot Locker (FL), and SPARC, a joint venture between Simon and Authentic Brands Group.
Most of its top tenants are also publicly traded or part of publicly traded companies. And only a few present a material risk of not making rent.
If we had to assign a grade on this angle alone, it would be a C+ or B-.
The Good, the Bad, and the Complicated About Macerich
The more relevant problem is Macerich's ability to maintain and increase rents – especially without spending a fortune on property redevelopment.
(Source: Macerich Q4 2021 Earnings Presentation)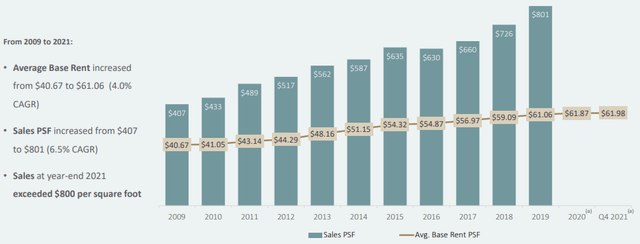
As shown above, average base rent ("ABR") has maintained a positive trend. But that's just barely, increasing less than 2% since the end of 2018.
For those curious about the 2020 and 2021 placements, Macerich says that data isn't available due to the government-mandated shutdowns. Understood. So what about occupancy?
(Source: Macerich Q4 2021 Earnings Presentation)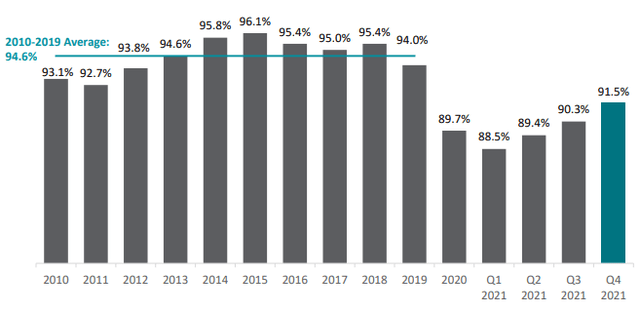
That's recovered to levels comparable to the years immediately after the Great Recession. And it finished 2021 specifically 3% better off than it began the year.
(Source: Macerich Q4 2021 Earnings Presentation)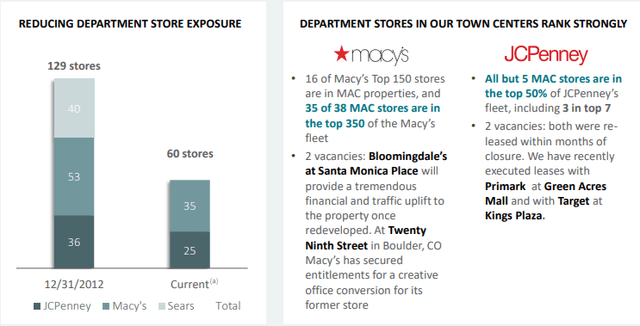
Now, we do have to acknowledge the structural decline of the department (big box) store. Macerich had 129 of those in its portfolio as of 2012. As of its last reporting period, it had 60.
And we're happy to see that reduction.
However, it often requires considerable capital expenditures ("CAPEX") and time to flip these giant department stores to another tenant or group of tenants. Take its 40 Sears properties, for instance. Some of those are even still in process – including the Los Cerritos Center and Washington Square locations, both of which require demolition.
Keep this in mind when reviewing any REIT's portfolio metrics. Removing a troubled or failed tenant excludes it from many portfolio metrics, which can create a mirage of better performance.
Sales per square feet, for example, radically improve after flailing department stores are classified as development projects instead.
Considering MAC's Cash Flow and Dividend Coverage
There are three mechanisms to change cash flow per share, which drives dividends and long-term total returns:
- Revenue (e.g., rental income);
- Margins (e.g., net operating income, or NOI, versus revenue and leasing spreads);
- Shares outstanding (e.g., share buybacks or share issuance).
(Source: Macerich Q4 2021 Supplemental Filing)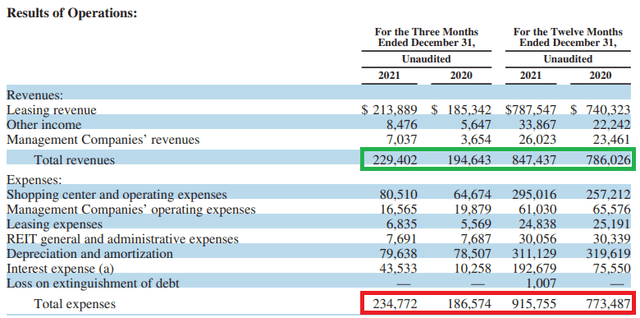
On the revenue front (in green), Q4-21's $213.9 million was a healthy 15.7% improvement over Q4-20's $185.3 million. Total expenses (in red), however, rose even faster, outpacing total revenue in both years.
Since those include non-cash expenses like depreciation, we want to account for that difference.
(Source: Macerich Q4 2021 Supplemental Filing)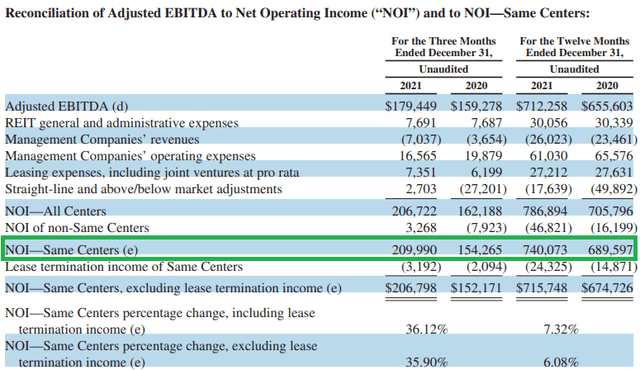
NOI is a good statistic to measure changes in cash flow at the property level rather than the REIT level. In which case, 2021's $740 million looks better than 2020.
Against a current market capitalization of $2.9 billion, that's less than 4x NOI – a compelling statistic and hardly one that screams disaster. Yet the stock looks appalling.
Why?
MAC's Cash Flow and Dividend Coverage Continued
To understand this, we need to recognize two problems and a derivative.
(Source: Macerich Q4 2021 Supplemental Filing)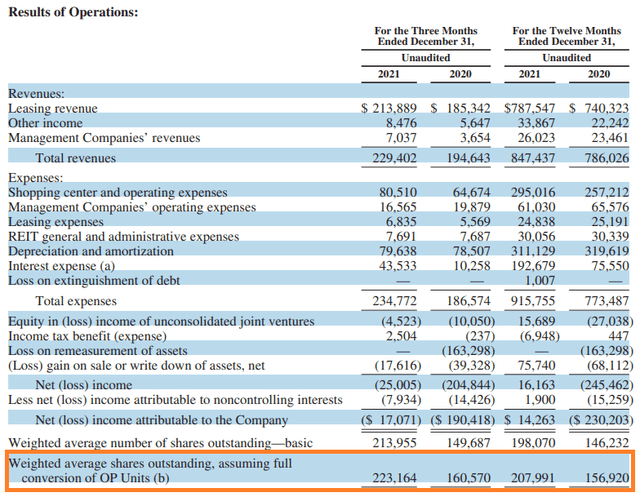
For all of 2018 and 2019, Macerich held the line with about 151.5 million shares outstanding. Yet that changed dramatically last year when shares outstanding climbed from 156.9 million at 2020's end to 223.2 million.
This is around a 42% increase. Very few REITs have growth rates that can possibly offset that level of dilution.
Since Macerich isn't one of them, this leads us directly to issue number two.
(Source: Macerich Q4 2019 Supplemental Filing)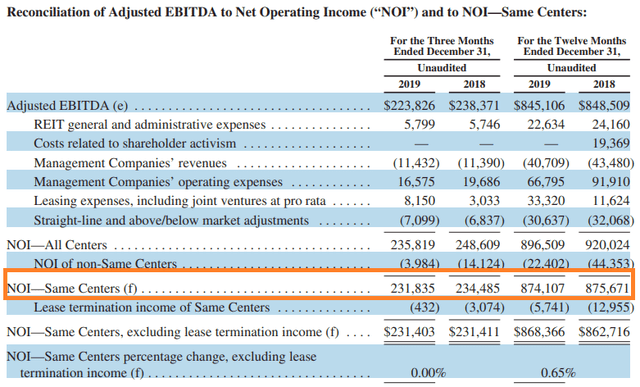
As shown above, 2019's same-center NOI is ~18% greater than 2021's. And albeit by a small margin, 2018's is greater than 2019's too.
But that's before we consider the massive share dilution, which makes Macerich's stock decline make more sense.
(Source: Macerich Q4 2021 Supplemental Filing)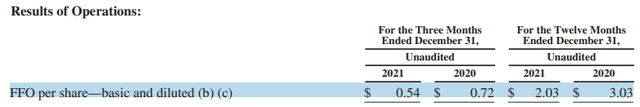
Macerich's funds from operations (FFO) per share declined from $3.03 in 2020 to $2.03 in 2021. Whereas, it guided for $3.40-$3.50 for 2020 in its Q4-19 supplemental filing. Clearly, the pandemic threw a wrench into those plans.
For context, FFO per share was within a nickel of $3 in both 2019 and 2018.
(Source: Macerich Q4 2021 Supplemental Filing)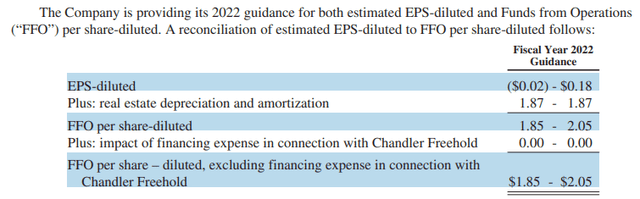
As for 2022, guidance is $1.85-$2.05.
Evaluating Macerich's Balance Sheet and Leverage
Significant share dilution usually occurs because there isn't any other route for management to take. It's really only accretive if:
1. An acquisition or business expansion is carefully planned and executed.
2. Shares are issued at such an elevated valuation that a positive return on investment (ROI) can be generated simply by investing the funds in the firm's normal activities.
More often, however, it's because leverage or liquidity is severely strained.
(Source: Macerich Q4 2021 Supplemental Filing)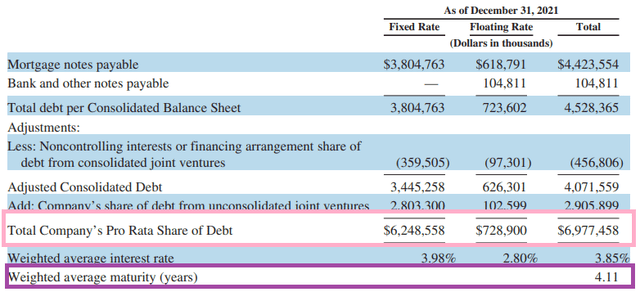
Macerich's total debt – including from joint ventures – totaled $6.3 billion at the end of 2021. And, its weighted average maturity of 4.11 years is among the shortest we've seen.
That gives it less financial flexibility and greater refinancing risk, all other things equal.
To be fair, Macerich's 3.98% weighted average interest rate is still acceptable. Its minimal floating rate debt is also a plus.
That said, its leverage ratios of 10.8x long-term debt/earnings before interest, taxes, depreciation, and amortization (EBITDA) and long-term debt/total equity of about 148% are much higher than its investment-grade-rated peers like Tanger and Simon.
Macerich hired an advisor to better manage its debt position in Q1-21, when its stock had an exceptionally high 24% short interest. Again, this was in 2021, not 2020 when the whole market was in trouble.
(Source: Macerich Q4 2021 Earnings Presentation)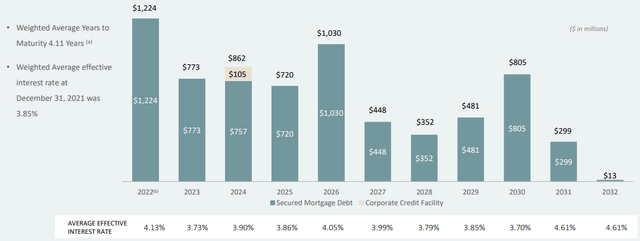
Its maturity schedule is also a significant but surmountable challenge. It started 2022 with:
- $1.224 billion in maturities due that year
- $773 million due 2023
- $862 million due 2024.
These are big numbers for a REIT with a market capitalization under $3 billion… and total liquidity under $650 million (at 2021's end)… and several ongoing development projects.
Balance Sheet and Leverage Continued
To Macerich's credit, it's made good progress on its balance sheet this year. In April, for instance, it closed on a $700 million 3-year renewal of its credit facility.
It also upsized its revolver capacity from $525 million to $800 million. And the $848 million in capital raised from issuing common equity contributed to the >$1.5 billion overall reduction in debt in recent quarters.
Macerich is also selling "non-core" assets to help de-lever, though it's unclear if that's sustainable.
(Source: Macerich Q4 2021 Earnings Presentation)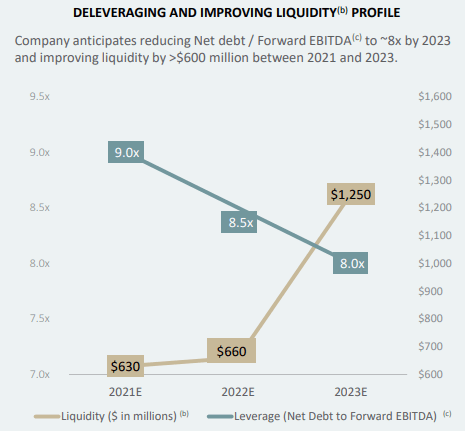
Macerich believes its strategy will result in leverage (defined as net debt/forward EBITDA) declining from 9.0x today to 8.0x in 2023. There is a lot of uncertainty in these numbers, and even 2023's theoretical figure is elevated in absolute and comparative terms.
There is a lot of data in this section, so let's summarize. Macerich has elevated leverage compared to peers but has made progress on the debt side (at the expense of equity holders). The weighted average maturity of barely 4 years means there is considerable refinancing risk in the next couple years, including over $1 billion in liabilities maturing in 2022.
There is a path forward for Macerich, but there isn't a large margin of error, and equity holders should be cognizant that they are first in line at the sacrificial alter, just as they were in 2021.
To be sure, we don't believe Macerich is in the same kind of trouble Washington Prime Group was before declaring bankruptcy last year. Macerich also has much better quality and performing assets.
That said, Macerich – which is unrated by S&P and Moody's – would be well into junk territory simply by comparing credit metrics to other REITs. So we'll be closely monitoring it from here.
A Look at MAC Stock's Valuation
MAC's adjusted FFO (AFFO) of $3.21 per share in 2017 declined every year thereafter to $1.57 in 2021. On the plus side, we don't expect further meaningful declines in the next five years.
Our estimate for 2022 is $1.55-$1.60 AFFO, with $2 being realistic by 2025.
If Macerich can hold the line on its leverage and liquidity profile through 2023, it has a reasonably bright future. We're seeing modest 5%-10% annual cash flow growth going forward.
But continued dilution could happen if management's current efforts to refinance liabilities fail. Cash flow growth at the REIT level won't mean anything for shareholders if there's 40% dilution like there was in 2021.
We're not anticipating that, mind you, but it's a risk to be aware of considering Macerich's balance sheet.
Offsetting that is an extremely compelling valuation. Using our conservative AFFO estimate for 2022, the stock trades at about 7.95x or 6.5x using FFO.
(FAST Graphs)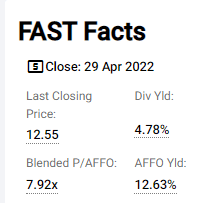
Tanger is also trading near 52-week lows, but historically trades at 9.4x FFO. And Simon sits at 10x. Then again, both are investment-grade rated and implemented much less severe dividend cuts the last two years.
Knowing that, we're giving Macerich's stock a roughly 35%-40% upside at this time. Anything beyond that doesn't make sense when investors would generally prefer less risk.
In Conclusion…
Macerich's quarterly dividend of $0.15 per share (4.8% annually) is backed by an extremely conservative 38% payout ratio. Its 2022 AFFO per share of around $1.58 equates to a 12.6% cash flow yield.
Tanger, for comparison, just increased its dividend 20% to $0.20 with a $1.36 2022 AFFO estimate, or a cash flow yield of 8.4%. While Simon's 9.2% is between the two.
For those willing to take on the elevated risks we've discussed, investors do obtain 30%-40% more cash flow per share with a 20%-25% cheaper valuation than its closest investment-grade-rated peers.
From a risk-adjusted perspective, we believe Simon is the best mall REIT opportunity in today's market. It does have one of the strongest balance sheets in the entire REIT sector, after all, and very similar upside potential of about 40% relative to its historical valuation.
But if Macerich were to decline toward $10, we'll seriously consider picking up shares provided new opportunities don't arise in the interim.
(FAST Graphs)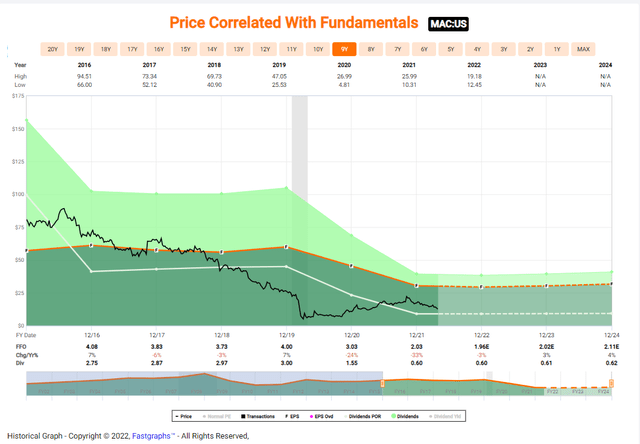
The iREIT BUY ZONE
Join iREIT on Alpha today to get the most in-depth research that includes REITs, mREIT, Preferreds, BDCs, MLPs, ETFs, Banks, and we recently added homebuilders.
We recently added an all-new Ratings Tracker called iREIT Buy Zone to help members screen for value. Nothing to lose with our FREE 2-week trial.

And this offer includes a 2-Week FREE TRIAL plus my FREE book.
This article was written by

Brad Thomas is the CEO of Wide Moat Research ("WMR"), a subscription-based publisher of financial information, serving over 6,000 investors around the world. WMR has a team of experienced multi-disciplined analysts covering all dividend categories, including REITs, MLPs, BDCs, and traditional C-Corps.
The WMR brands include: (1) The Intelligent REIT Investor (newsletter), (2) The Intelligent Dividend Investor (newsletter), (3) iREIT on Alpha (Seeking Alpha), and (4) The Dividend Kings (Seeking Alpha). Thomas is also the editor of The Forbes Real Estate Investor and the Property Chronicle North America.
Thomas has also been featured in Forbes Magazine, Kiplinger’s, US News & World Report, Money, NPR, Institutional Investor, GlobeStreet, CNN, Newsmax, and Fox. He is the #1 contributing analyst on Seeking Alpha in 2014, 2015, 2016, 2017, 2018, and 2019 (based on page views) and has over 96,000 followers (on Seeking Alpha). Thomas is also the author of The Intelligent REIT Investor Guide (Wiley).
Thomas received a Bachelor of Science degree in Business/Economics from Presbyterian College and he is married with 5 wonderful kids. He has over 30 years of real estate investing experience and is one of the most prolific writers on Seeking Alpha (2,800+ articles since 2010). To learn more about Brad visit HERE.Disclosure: I/we have a beneficial long position in the shares of SKT, SPG either through stock ownership, options, or other derivatives. I wrote this article myself, and it expresses my own opinions. I am not receiving compensation for it (other than from Seeking Alpha). I have no business relationship with any company whose stock is mentioned in this article.
Additional disclosure: Author's note: Brad Thomas is a Wall Street writer, which means he's not always right with his predictions or recommendations. Since that also applies to his grammar, please excuse any typos you may find. Also, this article is free: written and distributed only to assist in research while providing a forum for second-level thinking.