Tradeweb: Benefitting From Inflation By Being The Middleman

Summary
- Tradeweb is a hidden company that stands to benefit from inflation.
- Higher inflation and volumes in the bond and credit markets are fueling record revenue growth for Tradeweb.
- Tradeweb has an attractive Valuation compared to its closest peer/rival.
lorozco3D/iStock via Getty Images
In this article, I will be covering Tradeweb Markets (NASDAQ:TW), which I believe is a hidden beneficiary of inflation the stock market is not seeing. It is difficult to have a $17 billion company listed as hidden; however, Tradeweb is producing record revenues, yet has sold off with other high multiple stocks. For those not familiar with Tradeweb, they operate electronic marketplaces for interest rates, credit, equities and money markets. What makes Tradeweb an unconventional and hidden inflation play is the fact that bond and credit trading volumes are through the roof because of the current inflationary environment.
Tradeweb Key Data Points
Tradeweb reported earnings on Thursday last week showing revenues were at record levels reporting over $300 million in quarterly revenues for the first time. The following chart shows rates and credit were up mid double digits and equities revenue was up 40% year/year. In the current environment, these areas have been the driving force behind the recent results. These results and increased volumes in the bond and credit markets shows Tradeweb stands to benefit in this high-inflation environment by being the middleman. The current share price is not reflecting the strength in the underlying business due to rising rates and the volatility that has been, and will continue to be, present.
TradeWeb Q1 2022 Earnings Presentation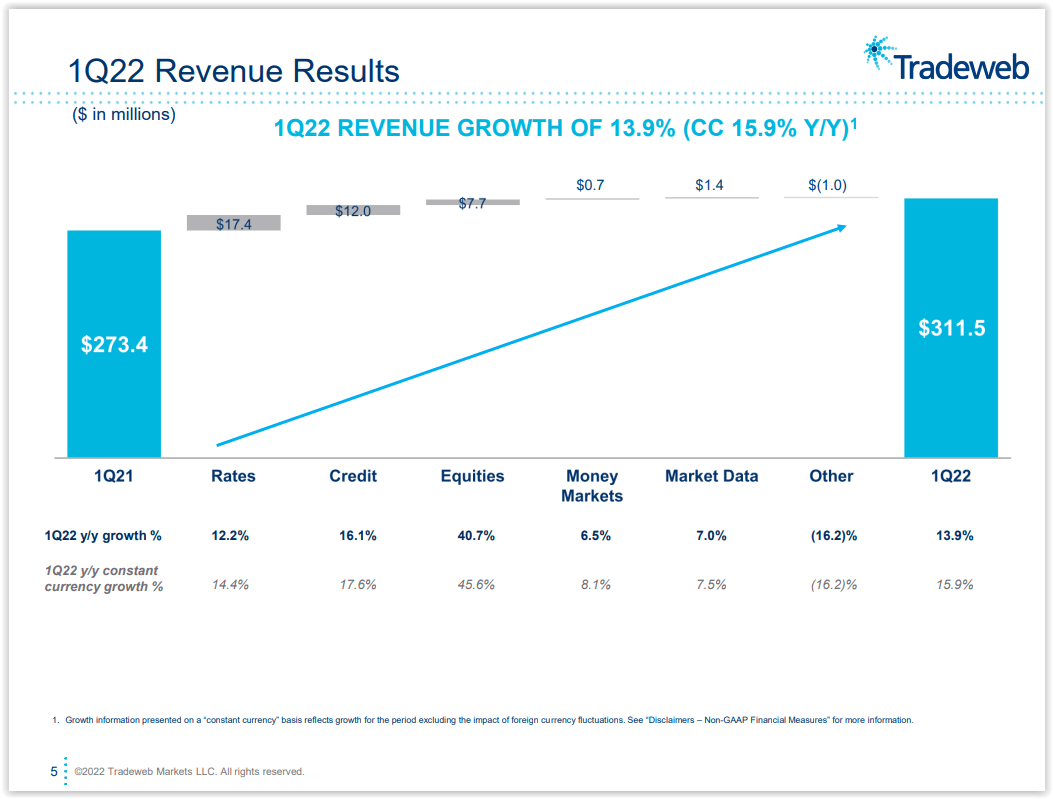
One way to track potential volumes for Tradeweb is to look at the average volume increase in the large bond ETF the iShares Core U.S. Aggregate Bond ETF (AGG). The following weekly chart shows the average volume for this ETF is up year/year just over 20%. With many Federal Reserve hikes expected for the remainder of 2022, I expect that volumes for Tradeweb will remain at elevated levels.
Seeking Alpha Charts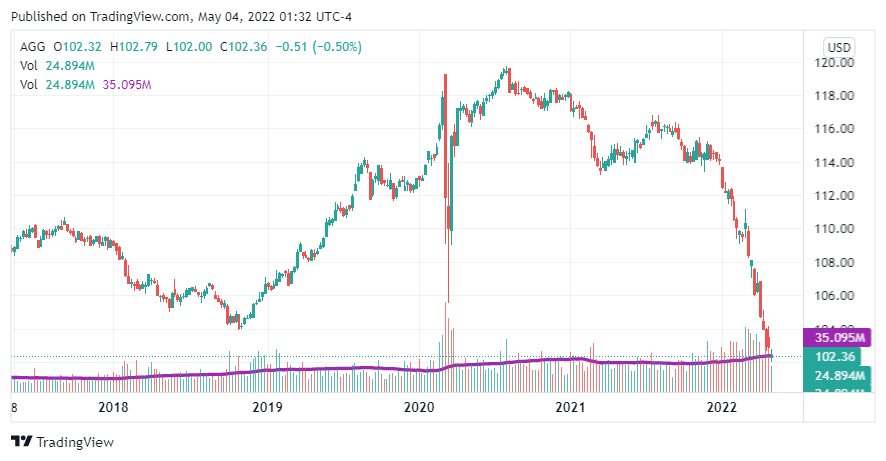
Valuation
For the valuation, I looked at the two most important metrics, cash flows and sales. I examined where Tradeweb currently stands based on price/cash flow and price/sales. Tradeweb is grouped with other high multiple companies and many times those types of companies are judged by the price/sales valuation. In addition, I also compared the valuation metrics of Tradeweb to its main rival MarketAxess Holdings (MKTX).
Price/Cash Flow
Looking at the chart for price/cash flow, Tradeweb is trading right near 25x cash flows, which is a key level. As you can see, the 25x cash flow level was a valuation that Tradeweb gravitated towards back in 2019 and 2020 and with the recent decline is now back to that level. The midpoint of the price/cash flow for Tradeweb over its trading history is 28.54x (Low 17.44, high 39.64), which is higher than where Tradeweb is currently trading.
Seeking Alpha Financial Charts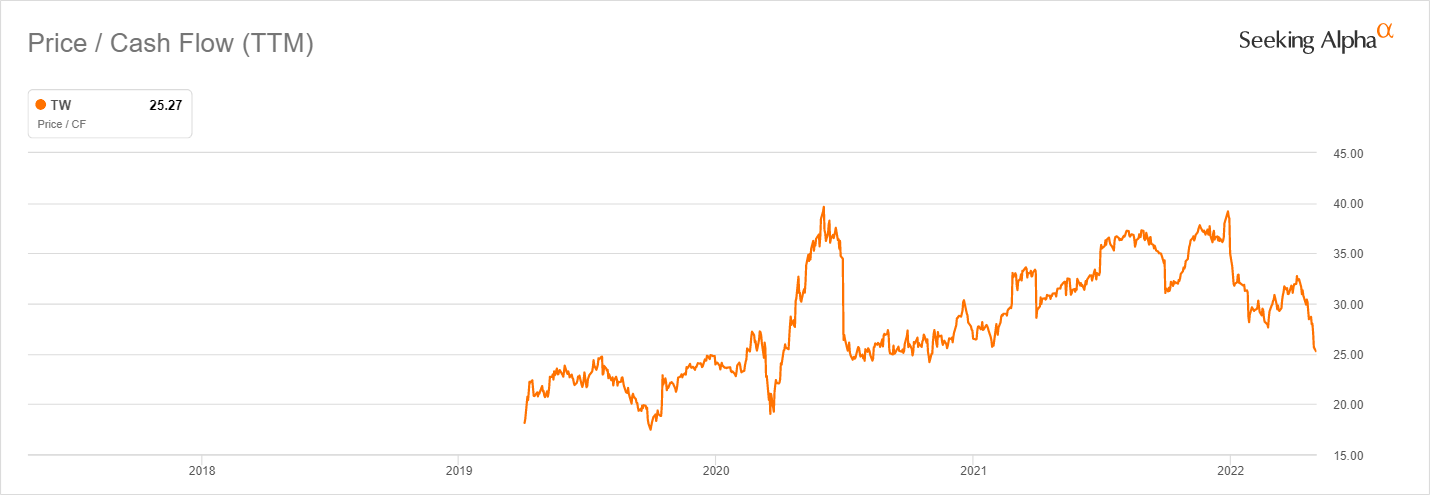
Price/Sales
Looking at the chart for price/sales, Tradeweb is currently trading at just under 13x sales, which is right near the midpoint of 12.42x over their trading history. For Tradeweb the price/sales is still slightly above the midpoint, and to get to the similar key historical level that the stock has gravitated to in the past would mean shares of Tradeweb would need to drop to around 10x sales.
Seeking Alpha Financial Charts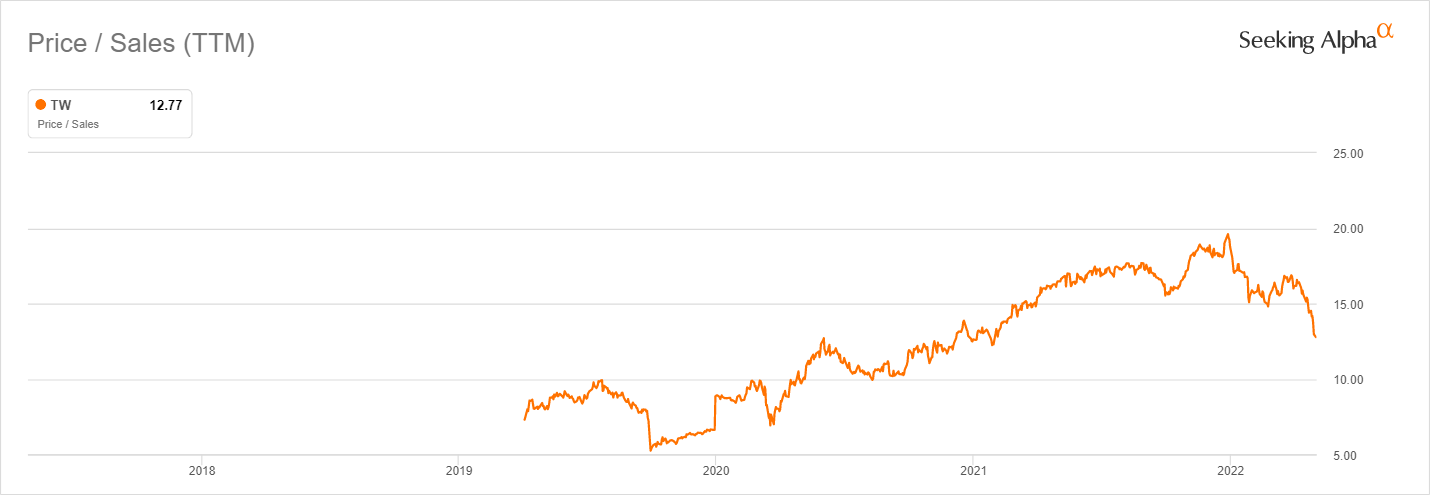
Tradeweb vs. MarketAxess
Tradeweb and MarketAxess are rivals and thus I believe it is also important to consider a comparative valuation. On the most important metrics of current valuation metrics of price/cash flows and price/sales, Tradeweb is trading at a discount to MarketAxess. In addition, looking to the future Tradeweb is projected to grow revenues and EPS at much faster rates than MarketAxess. Combined, these data points signal Tradeweb is the superior choice when comparing the valuations of these two companies.
Price/Cash Flow | Price/Sales | Revenue Growth (FWD) | EPS Growth Diluted (FWD) | |
TW | 25.27 | 12.77 | 14.54% | 16.36% |
MKTX | 35.54 | 14.41 | 7.07% | 0.57% |
Table Data from Seeking Alpha Financial Pages and Peer Comparison
Technical Outlook
Shares of Tradeweb are currently sitting right above a critical technical level. The first chart below shows shares are sitting right near the 50% retracement level from the pandemic bottom in 2020 to the highs in December 2021. A key level of past resistance has been around $69. The stock failed to break through that level in June 2020 and again in December 2020 before finally breaking through in March 2021. These key points are noted with blue circles in the image below.
Seeking Alpha Charts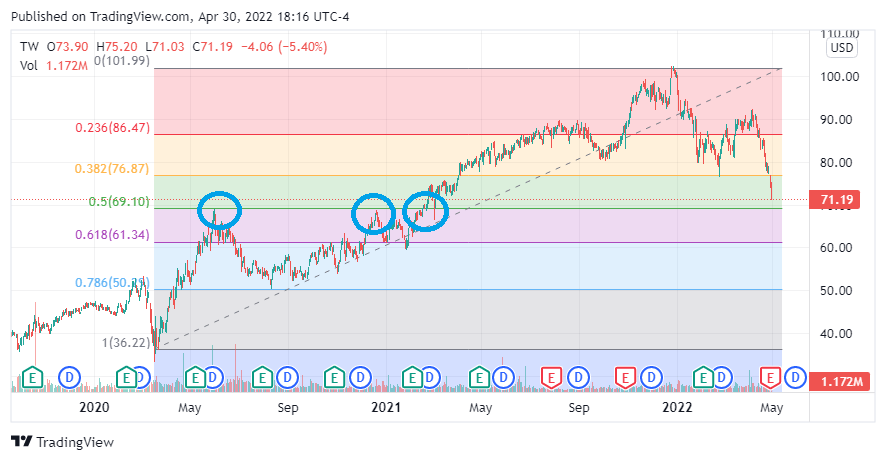
The following chart is a longer-term weekly chart showing the RSI (Relative Strength Index) and MACD (Moving Average Convergence Divergence) for Tradeweb to be at the lowest levels since the company had its IPO. Given the backdrop, Tradeweb is producing record revenues, these two indicators being at record low levels combined with the share price being near a critical level of support points to this potentially being a favorable entry point.
Seeking Alpha Charts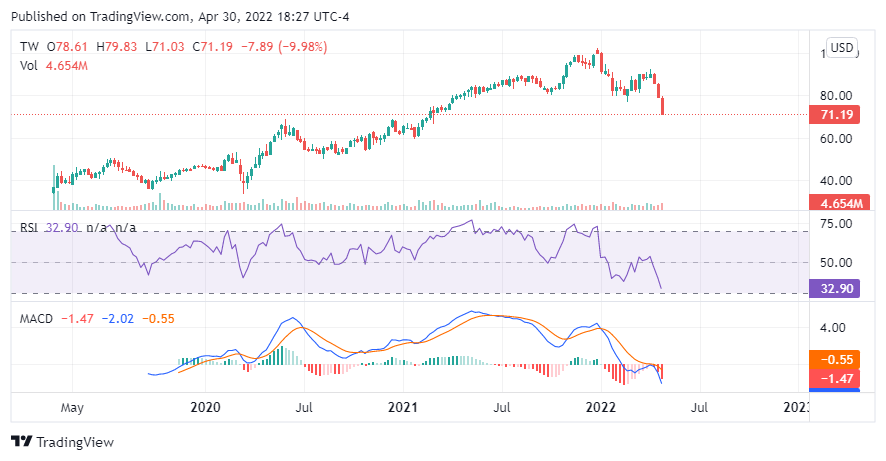
Risks
The first risk Tradeweb faces is the announced transition of the co-founder and CEO to chairman of the board. The current CEO will stay on as CEO until the end of 2022, and then will relinquish that role and just have only the chair of the board title. Anytime one of the founders of a company retires even if they stay on with the board, monitoring for any changes in strategy is very important. A recent example (though not a founder), former CEO of Starbucks, Howard Schultz decided to come back to shift strategy for the company. This is an important example of a former successful CEO or founder coming back to a company to change a strategy that has gone awry. Another example of this that recently came to light was the CEO change at Disney. Even though it was not a founder retiring situation, there was a change in management which led to friction about changes in strategy and approach. I am saying either of these types of situations could happen with Tradeweb, but it is definitely something worth watching.
A second risk Tradeweb faces is being grouped in with other high multiple stocks. Currently, Tradeweb is trading at forward PE of 37, which puts it in the same group as other high multiple stocks whose stock prices have been hit because of rising rates. Even though rising rates have helped the underlying business, the share price is still negatively impacted by rising rates.
Closing Thoughts
In closing, I believe Tradeweb is a good value in the current market because they stand to continue to benefit from inflation in the form of increased trading volumes for the products they offer. In addition, Tradeweb is trading at an attractive valuation compared to its historical valuation and compared to its closest peer MarketAxess. From a technical perspective, shares are sitting right at the 50% retracement level. Therefore, this is a critical juncture for the stock when looking at the overall technical picture. Finally, even with all these potential positives in the underlying business, the biggest risk to consider is the CEO transition that will be occurring later this year.
This article was written by
Disclosure: I/we have no stock, option or similar derivative position in any of the companies mentioned, but may initiate a beneficial Long position through a purchase of the stock, or the purchase of call options or similar derivatives in TW over the next 72 hours. I wrote this article myself, and it expresses my own opinions. I am not receiving compensation for it (other than from Seeking Alpha). I have no business relationship with any company whose stock is mentioned in this article.
Additional disclosure: I/we have no stock, option or similar derivative position in any of the companies mentioned, but may initiate a beneficial Long position through a purchase of the stock, or the purchase of call options or similar derivatives in DIVO over the next 72 hours. I wrote this article myself, and it expresses my own opinions. I am not receiving compensation for it (other than from Seeking Alpha). I have no business relationship with any company whose stock is mentioned in this article.
Disclaimer:
The commentary does not constitute individualized investment advice. The opinions offered herein are not personalized recommendations to buy, sell or hold securities. As I have no knowledge of individual investor circumstances, goals, and/or portfolio concentration or diversification, readers are expected to complete their own due diligence before purchasing any stocks mentioned.
The strategies discussed are strictly for illustrative and educational purposes and should not be construed as a recommendation to purchase or sell, or an offer to sell or a solicitation of an offer to buy any security. There is no guarantee that any strategies discussed will be effective. The information provided is not intended to be a complete analysis of every material fact respecting any strategy. The examples presented do not take into consideration commissions, tax implications or other transaction costs, which may significantly affect the economic consequences of a given strategy.
This material represents an assessment of the market environment at a specific time and is not intended to be a forecast of future events or a guarantee of future results. This information should not be relied upon by the reader as research or investment advice regarding the funds or any security in particular.