Schwab Benefits From High Interest Rates

Summary
- Interest-bearing assets now total over $632 billion.
- Schwab’s net interest margin is expected to rise to 1.85% by 4Q22.
- Historically, net interest margin has been over 3% in higher interest rate environments.
jetcityimage/iStock Editorial via Getty Images
Introduction
High inflation and high interest rates go together like peanut butter and jelly. My thesis is that Schwab (NYSE:SCHW) will benefit if inflation continues such that interest rates move to a higher level and stay there for an extended period of time.
Net Interest Revenue
Bank call reports show that Schwab’s economics for net interest revenue are excellent. A substantial portion makes its way to the bottom line whereas other revenue streams are less meaningful because they have higher expenses. In the April 2022 Spring Business Update, CFO Peter Crawford says the following:
Looking forward, if the Fed hikes rates to a range of 2.25% to 2.5% by the end of the year, as the market currently expects, we could see our net interest margin climb to the mid-1.80s in Q4.
We have a visual of this net interest margin (“NIM”) increase:
NIM Increase (April 2022 Spring Business Update)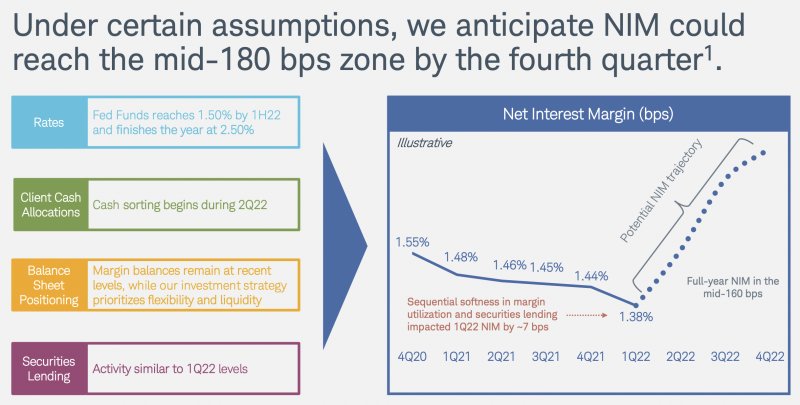
Interest-earning assets reached $632 billion in the latest quarter per the 1Q22 release:
Interest-earning assets (1Q22 release)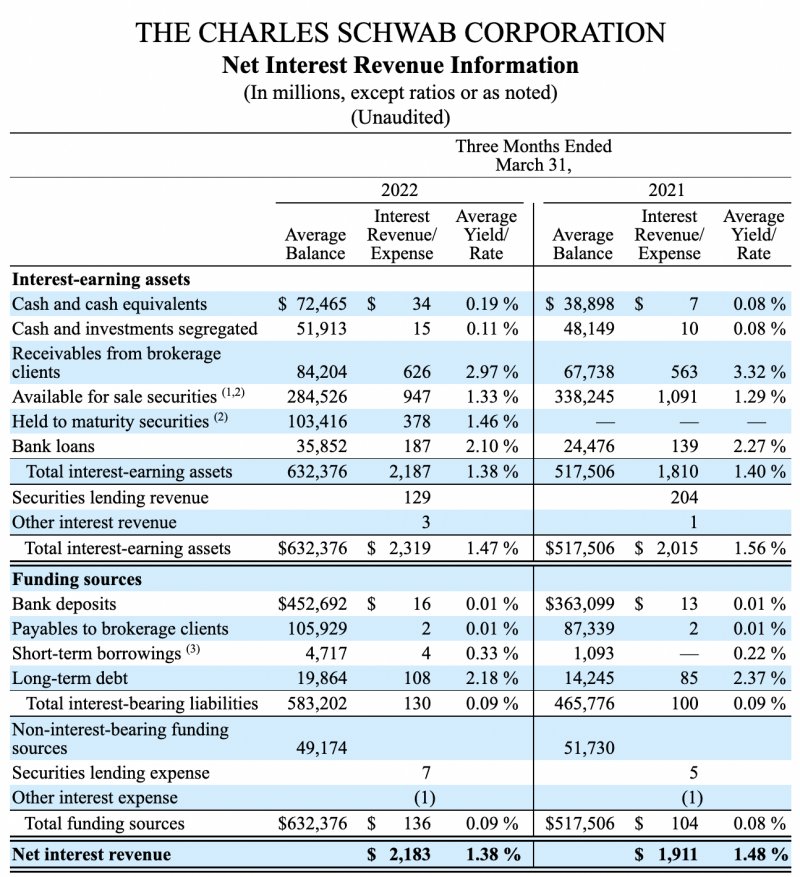
If NIM can get to 1.85% by 4Q22 then that comes to $11.7 billion in annualized net interest revenue without the $632 billion interest-earning assets needing to grow. This compares to the $8.7 billion annualized we have from the 1.38% NIM for 1Q22 [$2,183 million *4]. For comparison, the 2021 10-K shows that net interest revenue was only $8 billion.
The exciting thing is that NIM doesn’t have to stop at 1.85%; it can keep going up well beyond that level. Historically, NIM has been over 3% in higher interest rate environments. This was the case from 2006 to 2008 per the graph below:
Historical NIM (Author’s spreadsheet)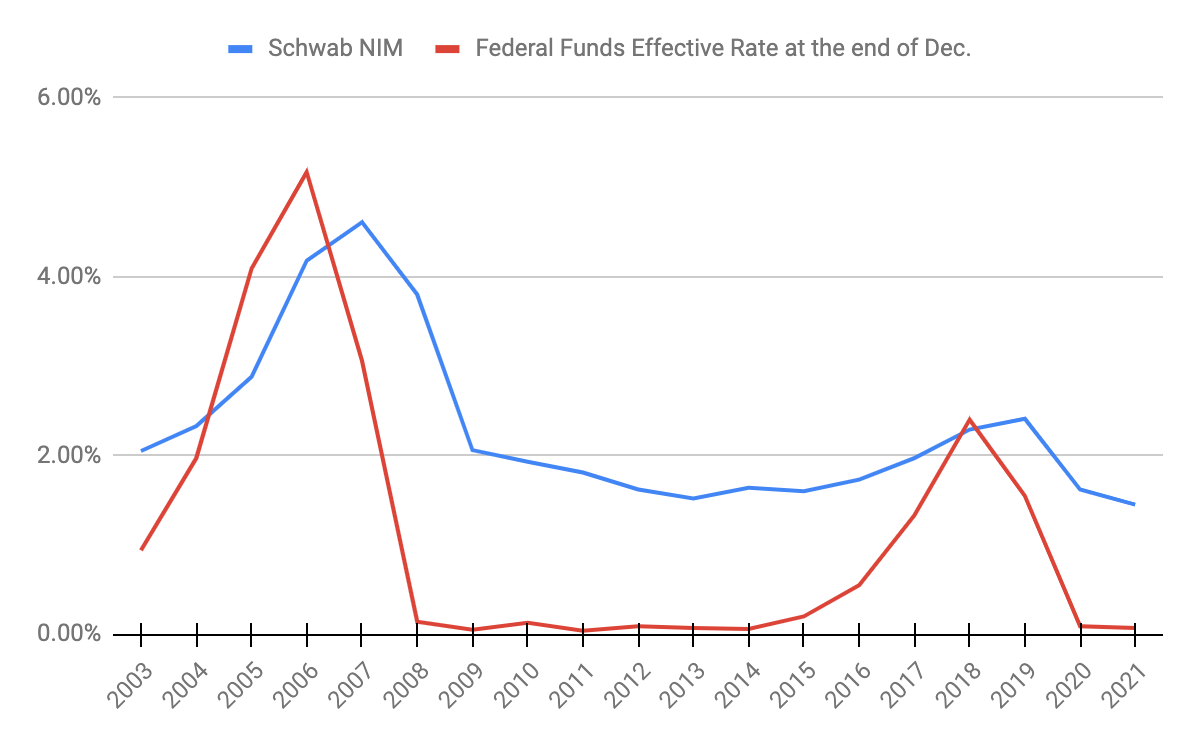
If interest rates keep going up beyond 2022 and we eventually get to a 3% NIM again then it means $19 billion in annual net interest revenue on interest-earning assets of $632 billion!
Gathering Assets
Interest-earning assets go up as client assets go up, so it is important to understand what makes client assets rise. I think of Schwab as a bank that gathers assets by offering financial management services at a discount. In other words, they are the opposite of avaricious and they even go as far as offering free trading. Knowing that their fees are lower than others in the industry, Schwab is keenly aware that they must keep their expenses lower as well. Schwab has always been disciplined with expense management such that it is a competitive advantage; their expenses on client assets (“EOCA”) have consistently been the lowest in the industry. Per the January 2022 Winter Business Update, they’ve been able to increase margins even as revenue on client assets (“ROCA”) has declined:
Historical EOCA (January 2022 Winter Business Update)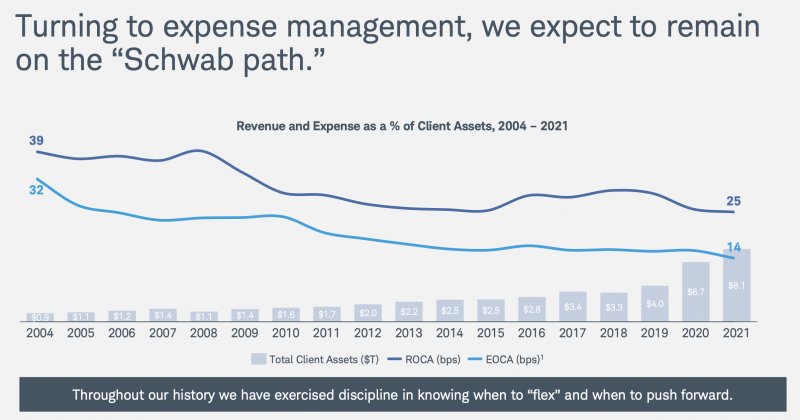
The EOCA for Schwab is just 14 basis points while it is 40 basis points for wirehouses and 55 basis points for broker-dealers. The wirehouses in the graph below are Morgan Stanley Wealth Management (MS), Bank of America Global Wealth & Investment Management (BAC), JPMorgan Asset & Wealth Management (JPM), and Wells Fargo Wealth and Investment Management (WFC). The broker-dealers in the graph are LPL Financial, Raymond James, and Stifel’s Global Wealth Management:
EOCA Advantage (January 2022 Winter Business Update)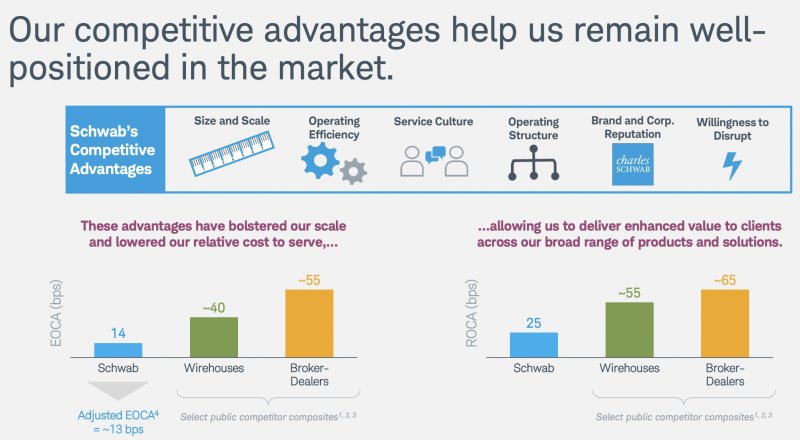
Image Source: January 2022 Winter Business Update
Schwab is regularly gathering more assets due to their low-price reputation. In the 2018 Fall Business Update, CEO Walt Bettinger noted that the transfer of assets (“TOA”) metric is important. Schwab continually wins more than $2 from competitors for every dollar that competitors win from Schwab. On average, clients consistently keep some cash on hand, so Schwab’s interest-bearing assets inevitably go up as overall client assets increase. Due to organic growth and acquisitions like Ameritrade, Schwab’s client assets have increased from $1.24 trillion in 2006 to $7.86 trillion in 1Q22 and interest-bearing assets have increased from $34.3 billion to $632 billion during the same period.
Now more than ever, the NIM is crucial because asset gathering has gone extremely well over the years such that the level of interest-bearing assets is prodigious. Again, there are now $632 billion in interest-bearing assets. Per the 2008 10-K, we have NIMs, actual interest-bearing assets and actual net interest revenue for the 3 years below. I added columns for 1Q22 interest-bearing assets and hypothetical net interest revenue based on historical NIMs multiplied by 1Q22 interest-bearing assets:
Year | NIM | actual i-b assets | actual NIR | 1Q22 i-b assets | hypothetical NIR on 1Q22 assets |
2006 | 4.18% | $34,275 Mn | $1,434 Mn | $632,376 Mn | $26,433 Mn |
2007 | 4.61% | $35,733 Mn | $1,647 Mn | $632,376 Mn | $29,153 Mn |
2008 | 3.80% | $43,771 Mn | $1,665 Mn | $632,376 Mn | $24,030 Mn |
*i-b is interest-bearing
*NIR is net interest revenue
Valuation
One risk for investors is that inflation and high interest rates might not last as long as headlines suggest such that Schwab’s NIM might not have a chance to climb as significantly as management projects. The anticipation of a higher NIM is already priced in so this is not a trivial risk. Another risk is that competitors might get better at offering higher savings rates in an effort to convince Schwab clients to move cash over to them.
I like to look through a lens of having a NIM of 1.85% in 4Q22 along with $632 billion in interest-bearing assets. This implies net interest revenue of $2.9 billion for the quarter compared to the $2.1 billion we saw in the 4Q21 release. Also, I think almost all of this incremental $0.8 billion makes its way down to the bottom line - perhaps $0.7 billion of it. The 4Q21 net income available to common stockholders was $1,449 million and I think it can be $700 million more in 4Q22 due to the above considerations such that it is more like $2,149 million. Annualizing this gets us to $8.6 billion. It’s hard to say what sort of multiple is appropriate for these forward-looking earnings but I think 15 to 20 times is reasonable implying a valuation range of $129 to $172 billion.
There were 1,893,914,470 shares outstanding as of January 31st per the 10-K including 1,814,620,775 common plus 79,293,695 non-voting shares. Multiplying this by the May 3rd share price of $69.46 gives us a market cap of $131.6 billion. We also have $10 billion in preferred shares, but we can leave that out of the equation since we’re factoring in the preferred stock dividends in our earnings multiple. In 2021, the $495 million in the “preferred stock dividends and other” line was the difference between the $5.9 billion net income and the $5.4 billion net income available to common shareholders.
The $131.6 billion in market cap is near the lower end of my valuation range so I think the stock is reasonably valued. If inflation and high interest rates continue to rise for a long period of time, then I think the stock will do very well.
This article was written by
Disclosure: I/we have a beneficial long position in the shares of SCHW, VOO either through stock ownership, options, or other derivatives. I wrote this article myself, and it expresses my own opinions. I am not receiving compensation for it (other than from Seeking Alpha). I have no business relationship with any company whose stock is mentioned in this article.
Additional disclosure: Any material in this article should not be relied on as a formal investment recommendation. Never buy a stock without doing your own thorough research.