2 Simple Cash Flow Rules For Extreme Microcap Returns

Summary
- Microcaps can be volatile and risky.
- Risk can be reduced by analyzing cash flows.
- Excess annual return of this sub-set of microcaps is 13% higher than the Russell microcap benchmark.

Sezeryadigar/E+ via Getty Images
Microcap stocks can be volatile, risky and downright scary to own. But with a couple of sensible risk management techniques, they can also deliver huge returns. In this article I will outline a couple of very important considerations for microcap stock selection.
A Lesson In What Not To Do
I had to learn this one the hard way.
- Do NOT become emotionally involved with story stocks.
Almost every microcap stock has a story of how they are going to turn pennies into mountains of cash. Probably my biggest blunder of the past 10 years was getting sucked into the story of a certain microcap stock which I won't name. My experience is in numbers, statistics, balance sheets and facts. Yet with this particular company I let my guard down thinking I had found the next Amazon based on a story of what the company might be able to do if everything lined up perfectly.
I made a complete and utter fool of myself.
As I try to live down that shame, I promised myself that never again would I pay attention to story stocks and good intentions. I will live and die by the hard numbers and facts as I always had done before.
Find Stocks With Free Cash Flow
When analyzing microcap stocks, one of the most important metrics I look for is free cash flow. I am not interested in companies that are bleeding cash while touting high earnings growth. I use cash flow analysis rather than accrual-based investing (e.g. earnings) because small companies need cash to survive and pay the bills. They don’t have deep pockets like larger companies. In a raising interest rate environment, I believe this to be increasingly important.
I simply require that a stock has some free cash flow for either the most recent quarter or for the trailing 12 month, but I do not require both. I also do not care how much free cash flow they have, only that it is positive or above 0.
Rule 1: Recent quarter or trailing 12 months of free cash flow is positive
How much of a difference does this one filter make?
To demonstrate I will create a long-short portfolio. What this will do is neutralize the performance of microcaps in general and just isolate the excess returns based on free cash flow. For example, I first create a universe of small stocks that have the following properties:
- At least 1 dollar per share
- At least $100,000 of trading value per day
- Less than $700 million market capitalization
If I take all of the stocks passing my liquidity and size rules and create a long portfolio, and then go short by the same amount of money in an ETF like the Russell Microcaps Index (IWC), I should get a return pretty close to 0 because there is nothing in my strategy thus far that is producing additional returns.
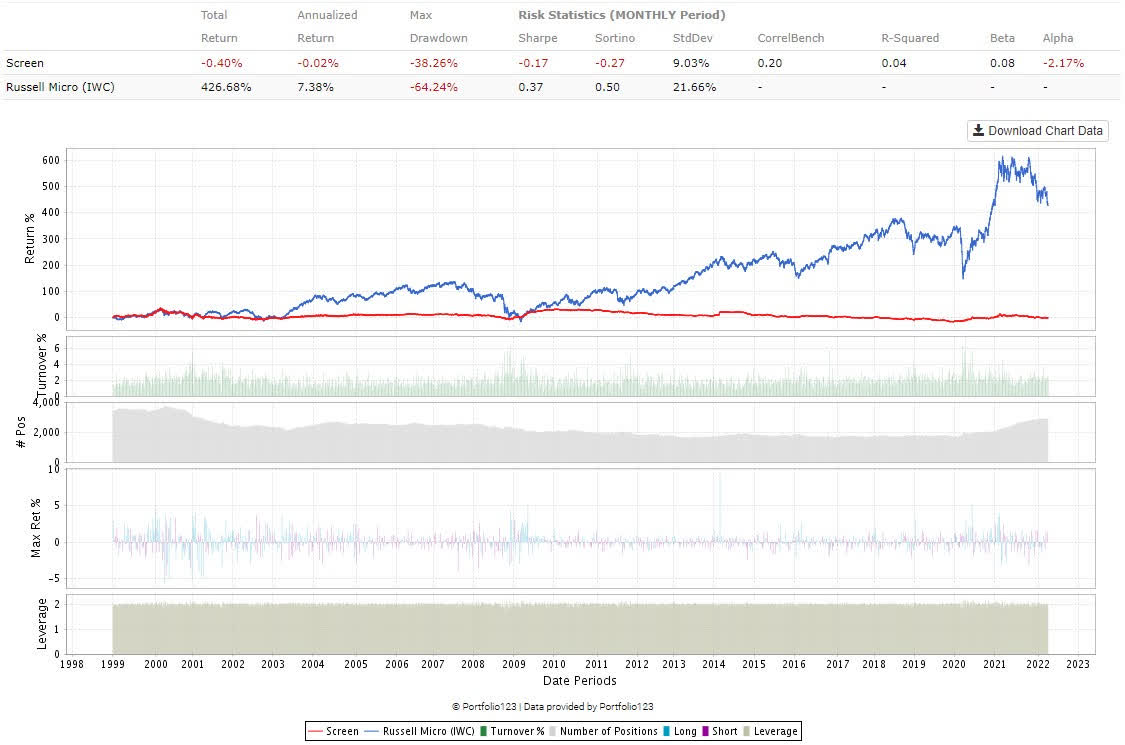
Portfolio123
And that is exactly what you see in the chart above (ignore the IWC benchmark which is the blue line). The red line is my long-short portfolio. There are no excess returns. The annual returns are pretty much flat. Therefore, any rules that I add to this portfolio that results in consistent out-performance will be clearly seen in the upward slope of the red line and will be attributed to the cash flow rule.
The next chart will add rule 1 as a filter for positive free cash flow.
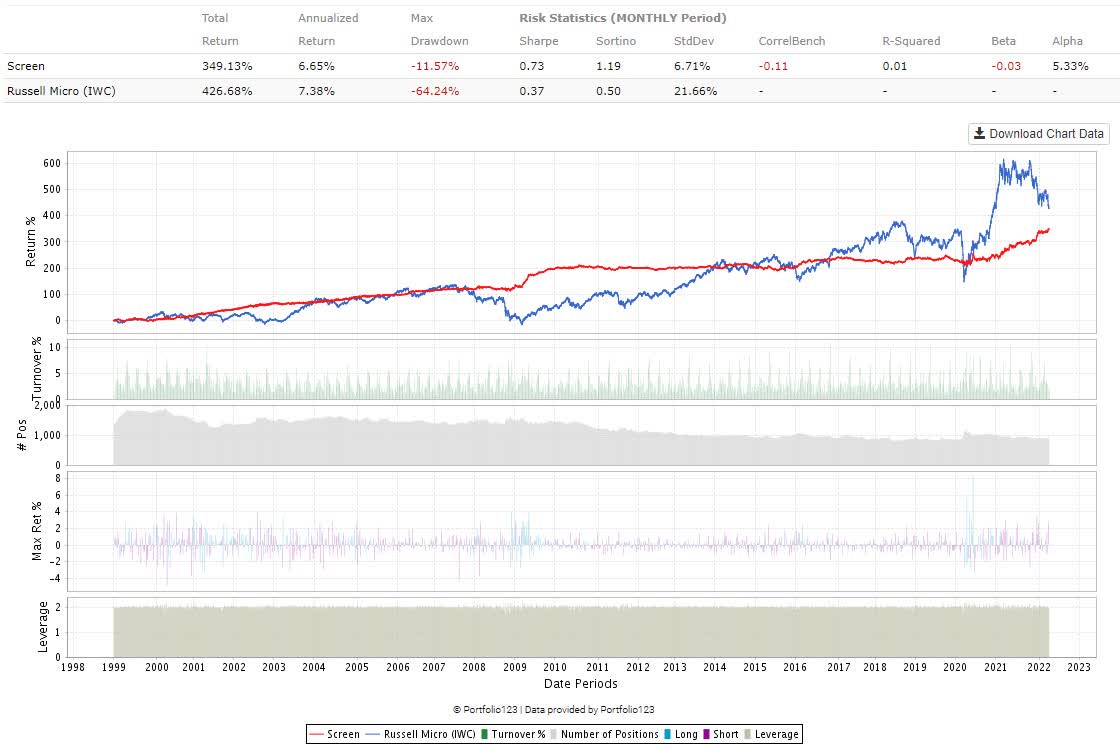
Portfolio123
Since 1999, this long-short portfolio has an annualized return of 6.65% with virtually no turnover. What this means is that the average stock with positive free cash flow has an annual return 6.65% higher than an average stock in the microcap index.
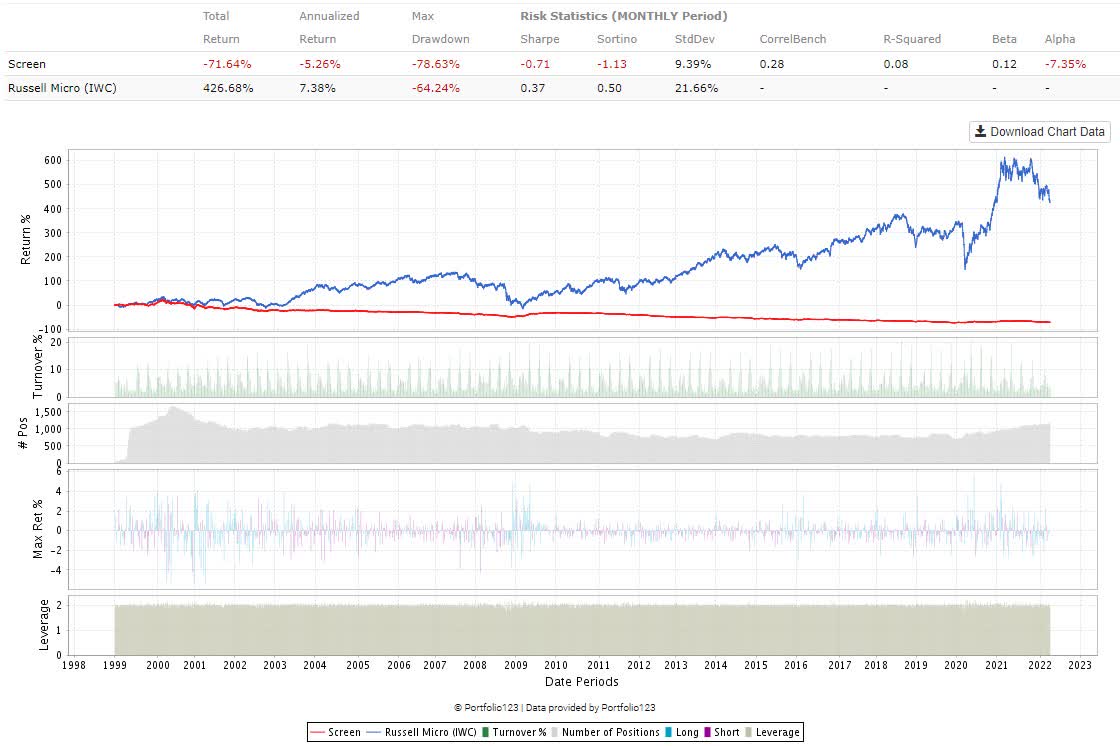
Just to satisfy your curiosity, I also want to present stocks which have negative free cash flow for both the most recent quarter and for the trailing 12 months.
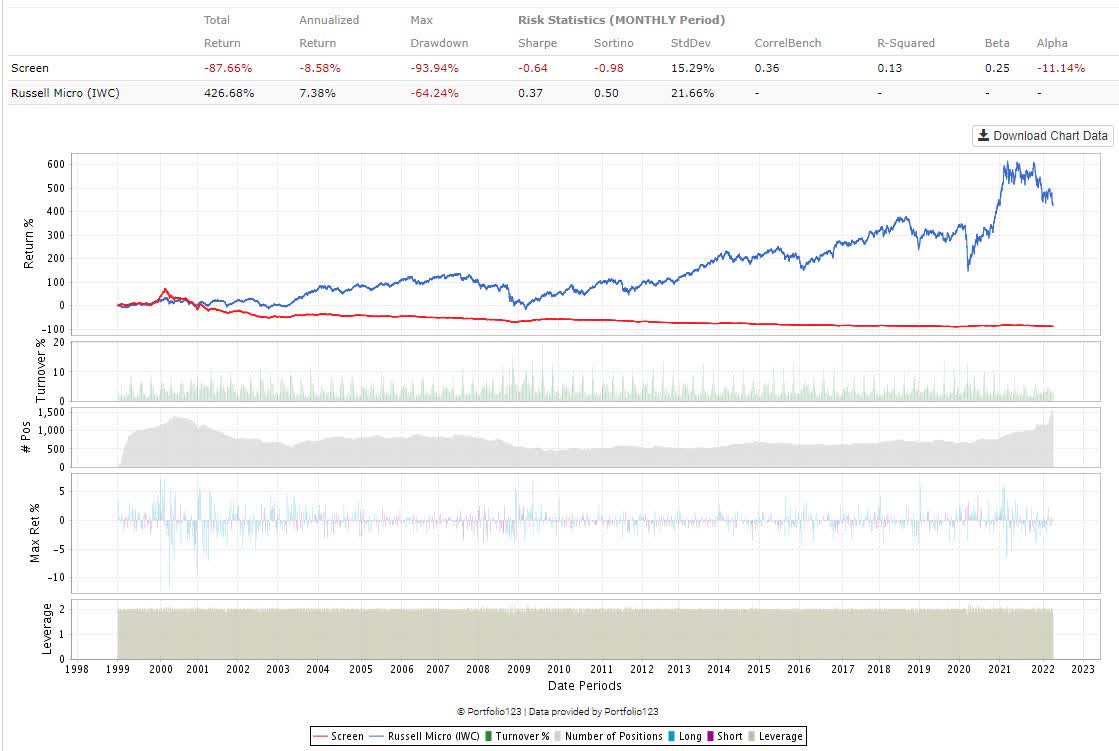
Portfolio123
The average small or microcap stock with negative free cash flow has an annualized return which is 8.58% less than the microcap index.
The implications of this are huge. Imagine a group of microcap stocks with big stories of growth but with negative free cash flow. A second group is devoid of any such bullish forecasts but has positive free cash flow. The consistent and historical difference between these two groups of stocks is more than 15% annually. If the negative free cash flow portfolio earns 5% then we would expect the positive free cash flow portfolio to earn 20%.
Operating Cash Flow Growth
My second microcap filter is also based on cash flows. I require that operating cash flows grow by at least 2-3% from the most recent quarter compared to the same quarter one year ago. The chart below will only depict the excess returns of the operating cash flow rule. I will turn off the free cash flow rule for now.
Rule 2: Quarterly operating cash flow is at least 3% more than the same quarter last year
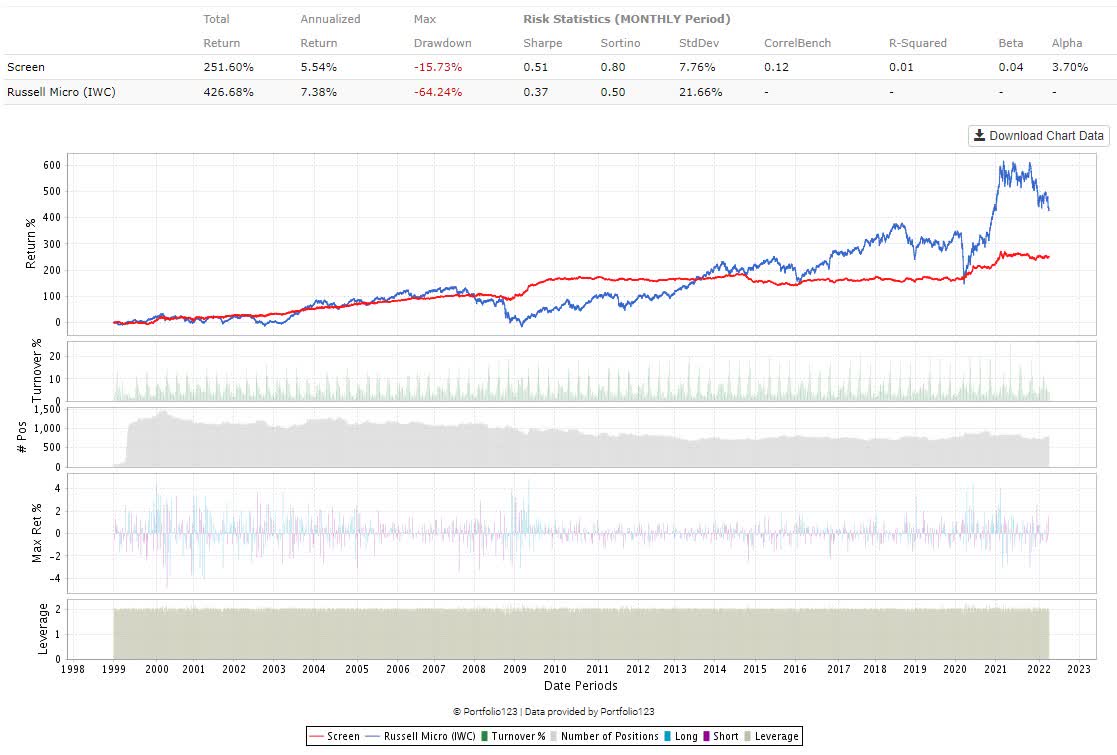
Portfolio123
By analyzing the red equity curve we can see that by keeping companies with increasing operating cash flows, we are able to pick stocks which have an annual 5.54% excess return above their peers. But don't feel you have to use 3%. It is not a magic number. Use 5%. Or 7%. Or whatever you feel good about. I use 3% because it is a positive number but not overly restrictive.
For curiosity sake, let’s look at the relative return of microcap stocks which have negative operating cash flow growth between the comparable quarters one year apart.
Portfolio123
If a stock has less operating cash flow than it did the same quarter last year, it also has an average of 5.26% less return than its peers.
Combining the Two Cash Flow Rules
From here, we want to combine the two cash flow rules and run a long-short portfolio on smaller stocks which have positive free cash flow AND operating cash flow growth between comparable quarters.
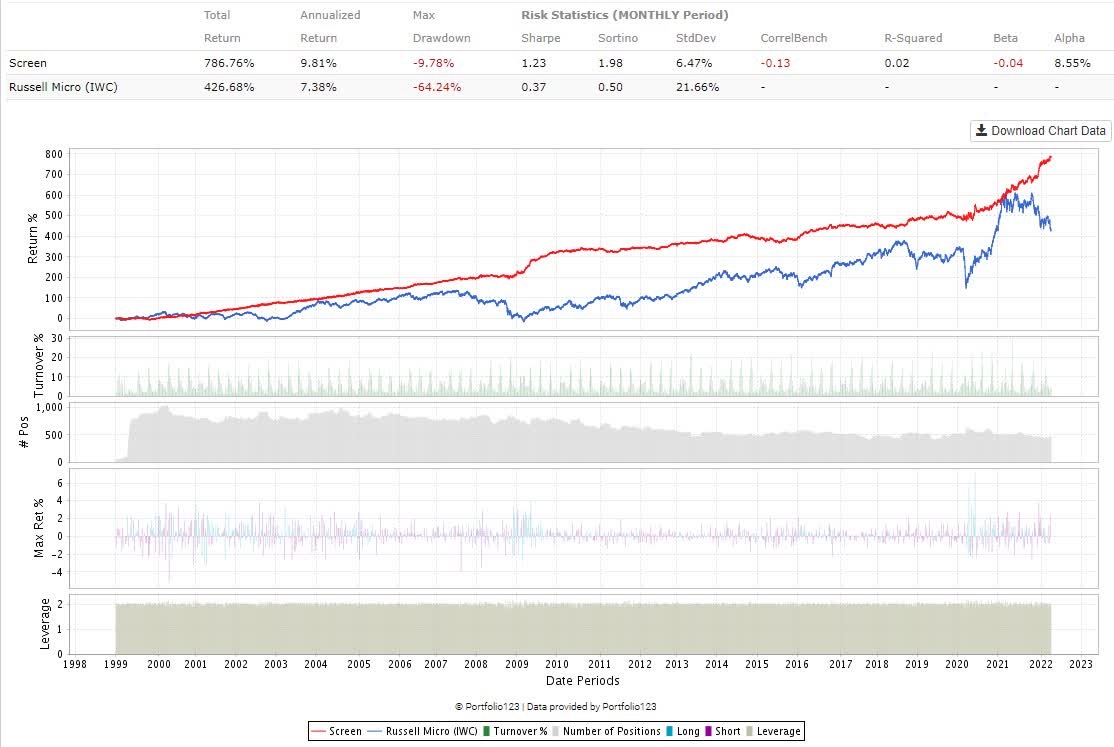
Even with all the liquidity filters, price rules and cash flow requirements, we still have roughly 500 stocks to choose from. And the average stock in our portfolio has 9.81% more annual return than the microcap index. Turnover is also very low with an average of 5-6% weekly. We can lower that turnover even more as I will discuss in a second.
Just to give you an idea of what this looks like as a long only portfolio, I will remove the hedge.
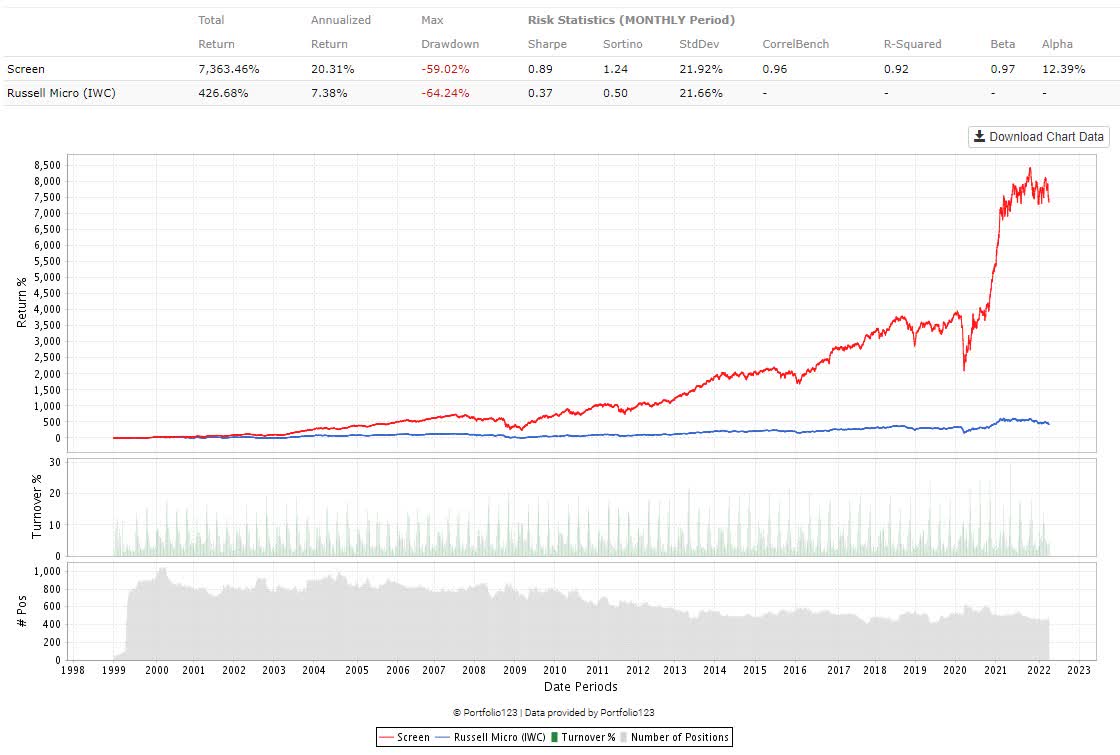
Portfolio123
Since 1999, this super simple filtering technique has returned 20.31% vs the microcap benchmark of 7.38%.
Lowering Turnover and Boosting Returns
Lowering turnover is quite simple. You buy the stocks when both cash flow rules are true. But you only sell when operating cash flow drops to 75-80% of what it was one quarter ago.
- e.g. If OCF is $1 per share then you sell when it drops to $0.75-$0.80 for the quarter.
Be strict when you buy but slacken the rules for a sell trigger. This will slightly reduce your excess returns but will allow you to hang onto a stock much longer to reduce trading and friction costs. Everyone has a different preference so this is where you can use your own good judgement.
And what about further boosting returns? We have 500 stocks to choose from. Do some have higher return potential than others? Yes. Is there a simple way to find the ones with higher return potential? Yes. Stay tuned as I will detail some very easy to analyze factors which have historically resulted in superior microcap stock selection.
This article was written by
Disclosure: I/we have no stock, option or similar derivative position in any of the companies mentioned, and no plans to initiate any such positions within the next 72 hours. I wrote this article myself, and it expresses my own opinions. I am not receiving compensation for it (other than from Seeking Alpha). I have no business relationship with any company whose stock is mentioned in this article.