The XLE Continues In A Leadership Role
Summary
- Oil and gas prices remain elevated.
- The geopolitical landscape supports prices.
- No significant change in US energy policy.
- The XLE has outperformed the stock market indices.
- The APS is long the XLE.
- Looking for a portfolio of ideas like this one? Members of Algo Portfolio System get exclusive access to our model portfolio. Learn More »
peshkov/iStock via Getty Images
Alternative and renewable fuels may be the future, but fossil fuels continue to power the world. For years, oil and gas companies lagged the overall stock market. The energy sector reached rock bottom as energy demand evaporated in early 2020 as the COVID-19 virus gripped the world. NYMEX crude oil futures fell below zero in April 2020, and Brent petroleum dropped to the lowest price of this century at $16 per barrel. In June 2020, natural gas reached $1.432 per MMBtu, a level not seen since 1995. Many traditional energy and related companies faced mounting losses and the potential for bankruptcy.
Those that survived have thrived in 2021 and 2022 as the energy sector experienced an almost perfect bullish storm. Central bank liquidity and government stimulus planted inflationary seeds, and US energy policy underwent a dramatic change, pushing oil and gas prices higher. In 2022, the stock market faces rising interest rates, and all the leading indices are in the red since the end of last year. The oil and gas sector was already moving higher when Russia invaded Ukraine, causing explosive price action that took the prices to multi-year highs. This year, traditional energy companies are leading the stock market, and the APS is long the S&P 500 Energy Select Sector SPDR ETF (NYSEARCA:XLE).
Oil and gas prices remain elevated
As of the final trading day in April 2022, energy prices remained near multi-year highs.
NYMEX Crude Oil Monthly Chart (Barchart)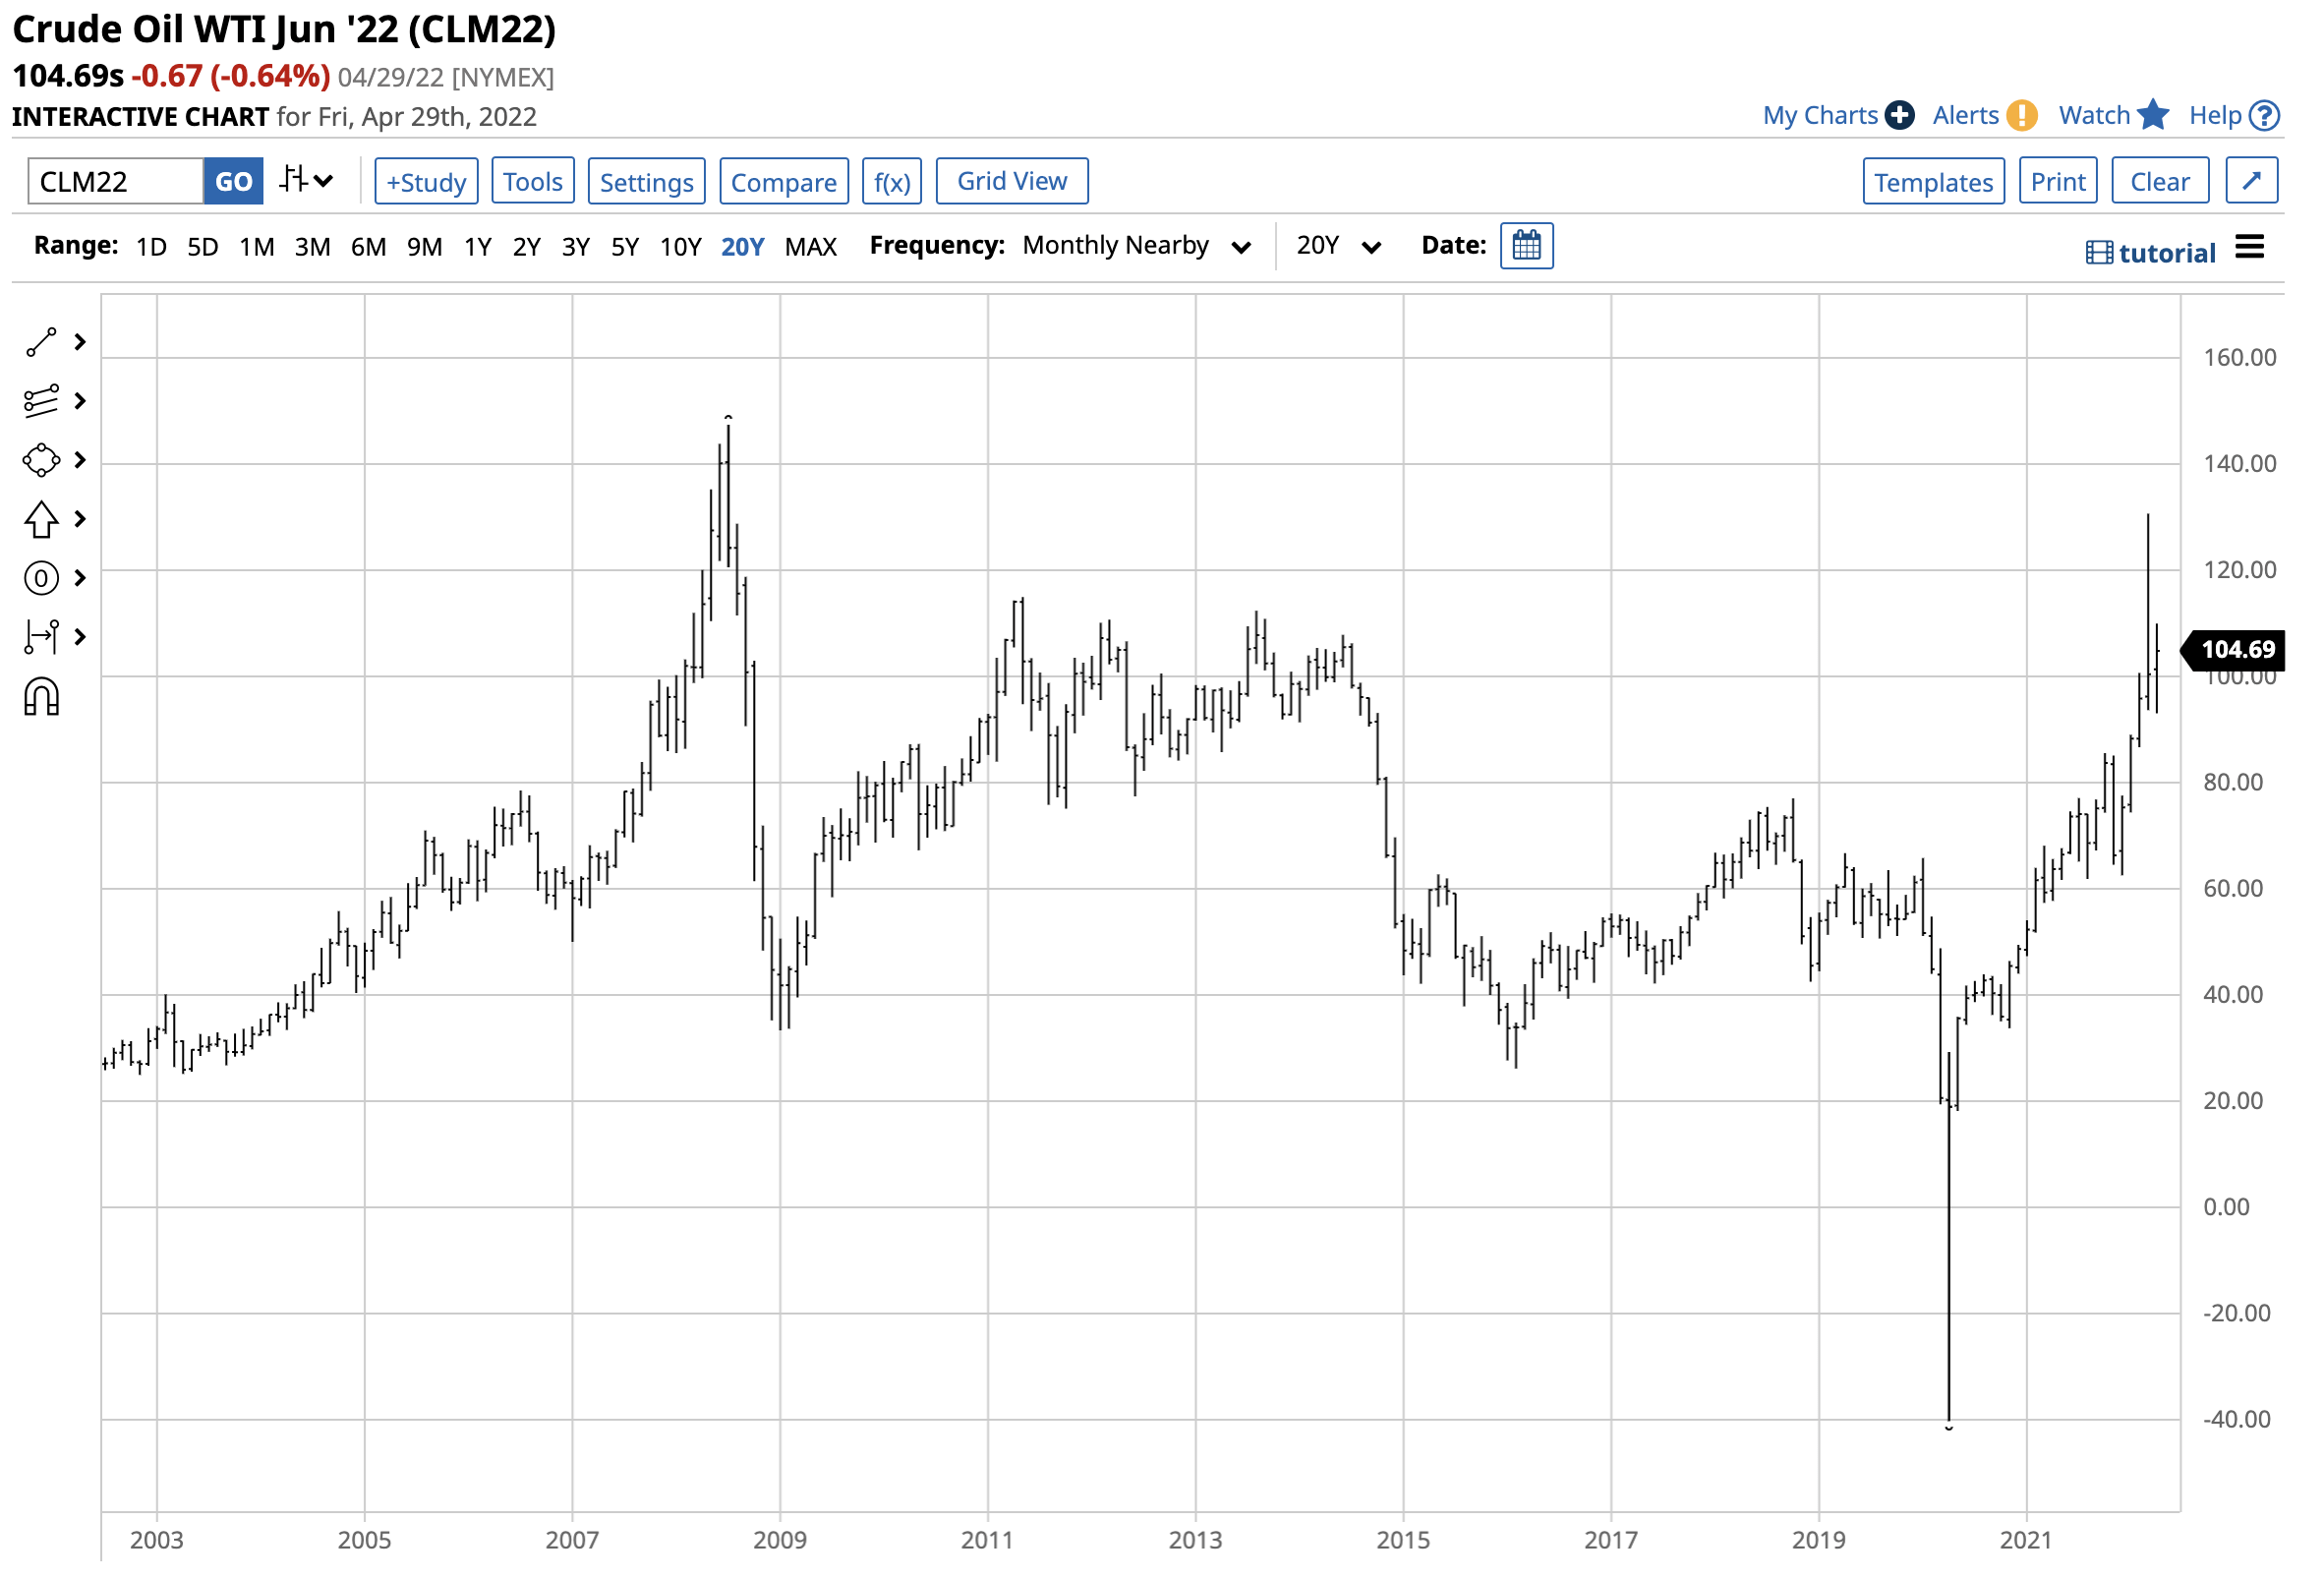
The chart highlights at the $104.69 per barrel level, June NYMEX crude oil futures were at the highest price since 2014 after rising to over $130 in March, the highest level since 2008. Nearby July Brent futures were at a $4.20 premium to the July NYMEX futures.
NYMEX Gasoline Chart (Barchart)
At nearly $3.45 per gallon wholesale, June gasoline futures were close to the 2008 high after reaching a record peak of $3.8904 in March 2022.
NYMEX Heating Oil Chart (Barchart)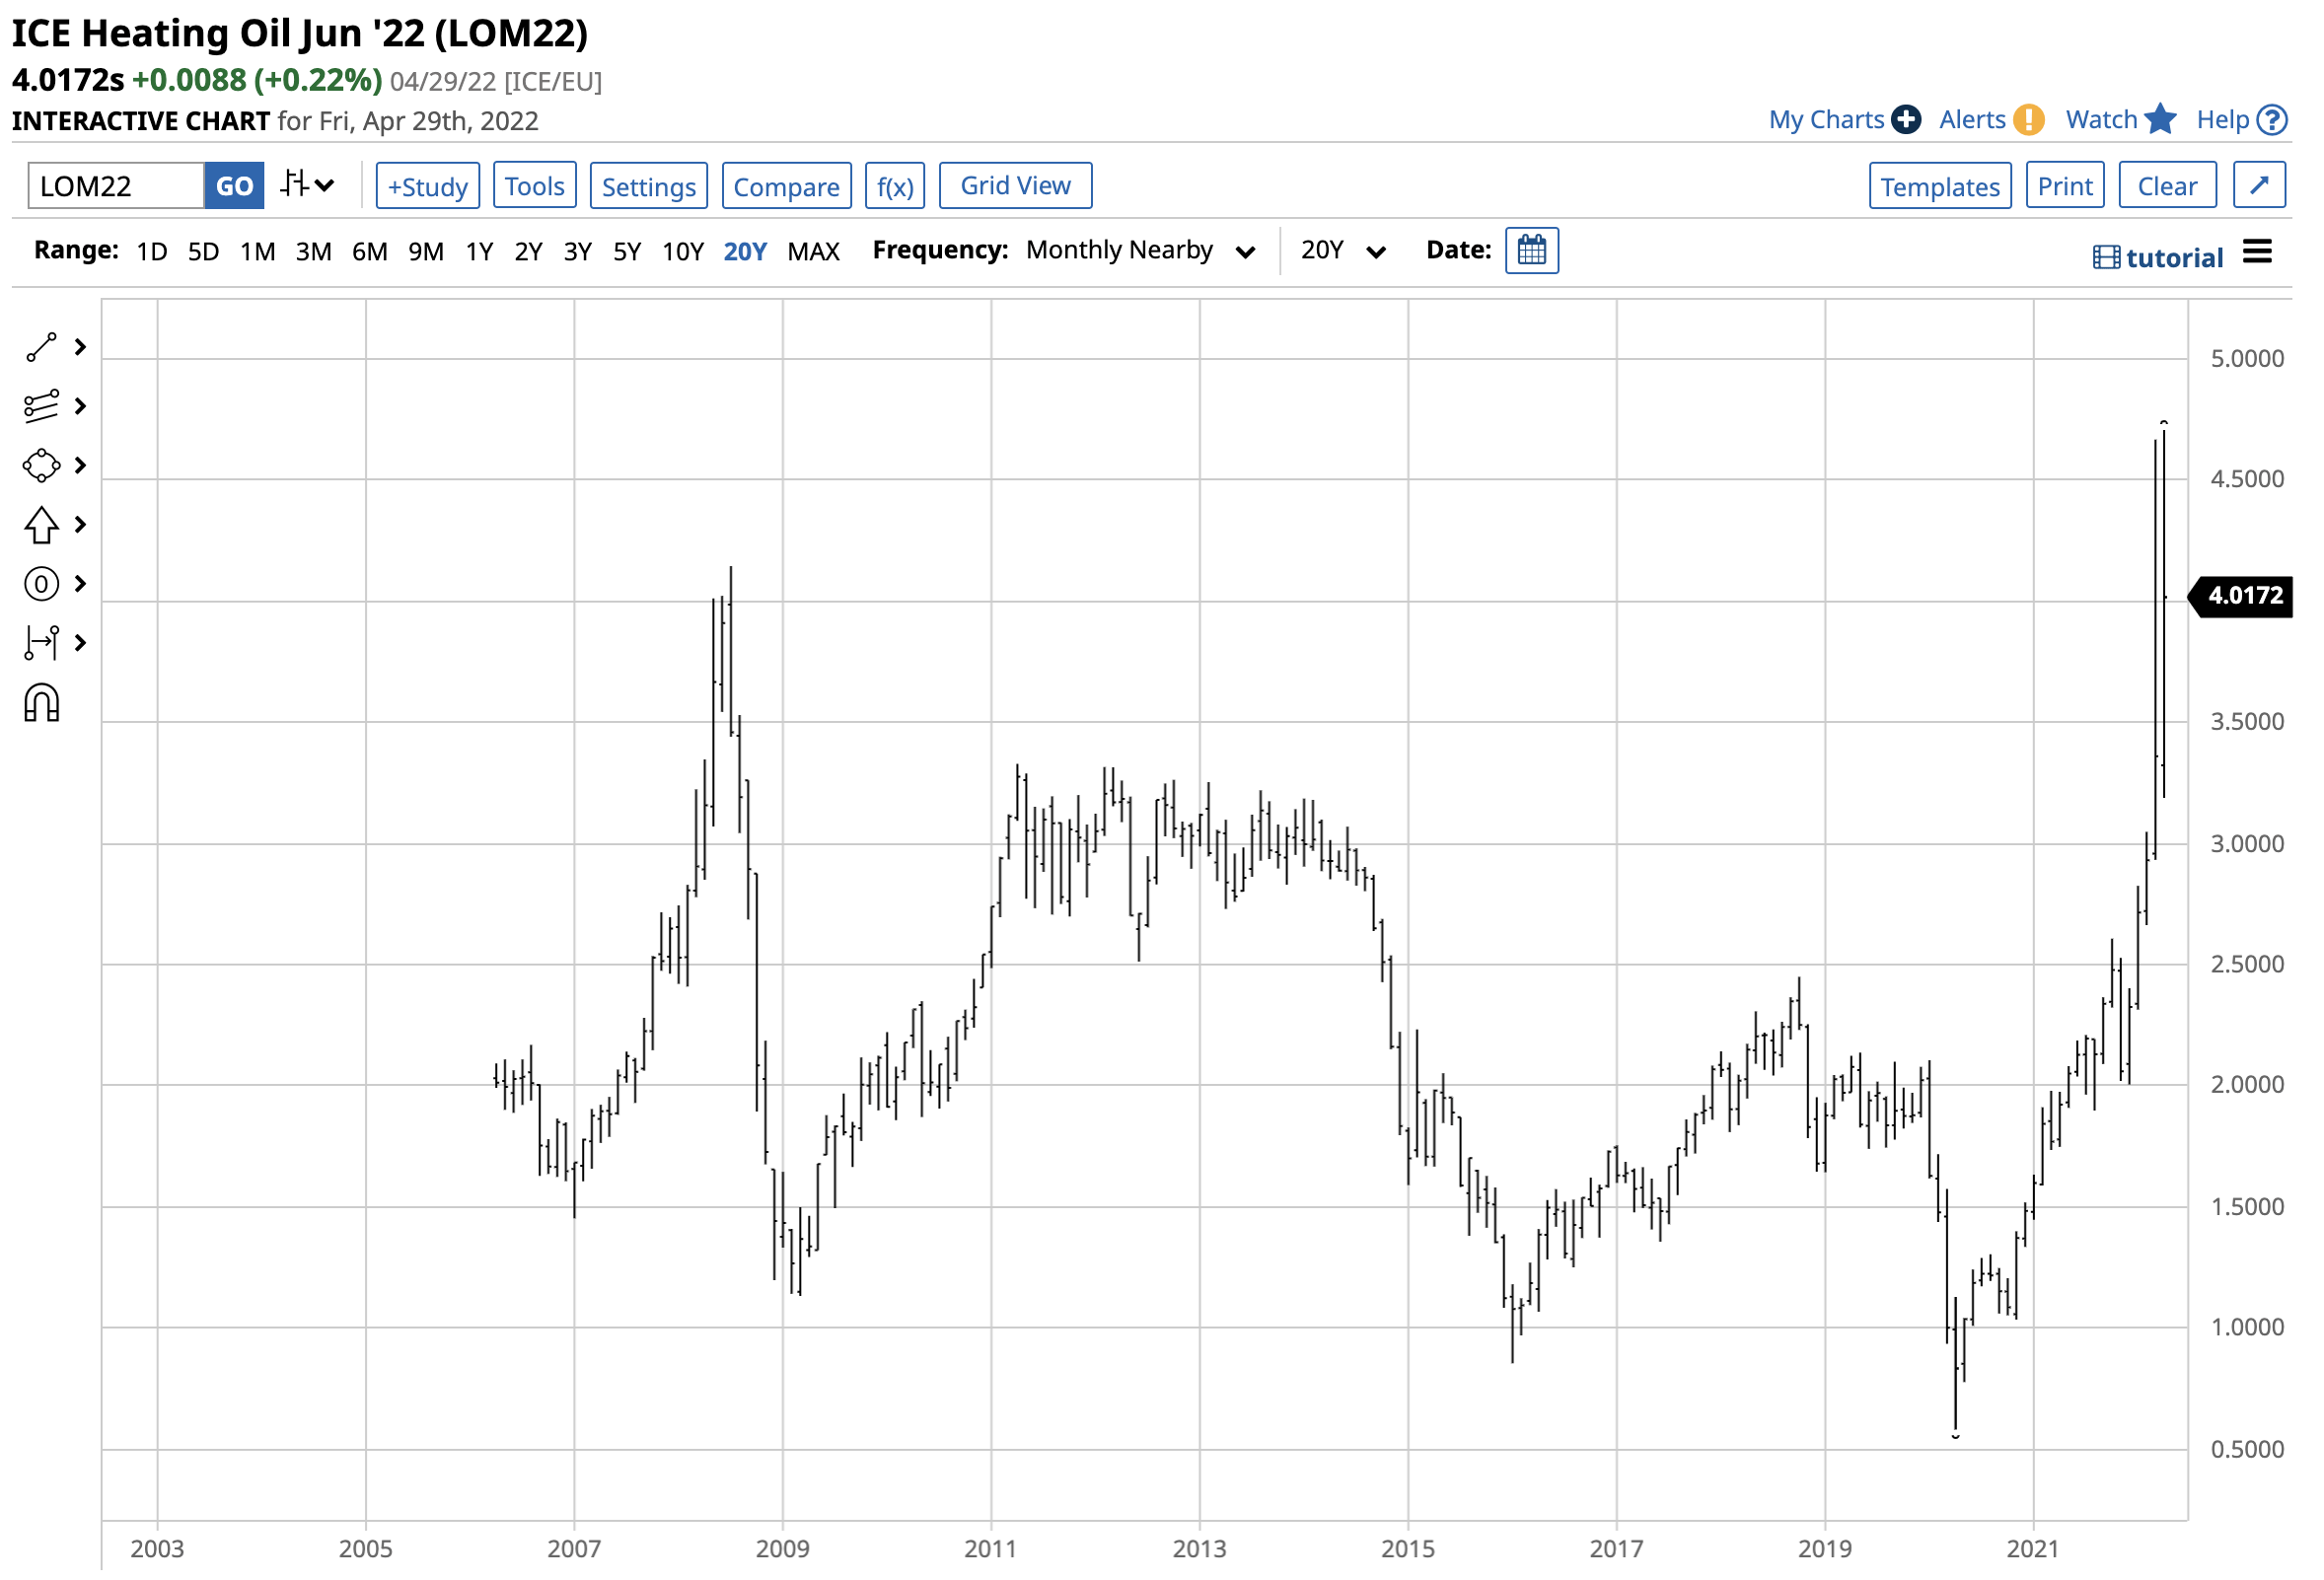
Heating oil and distillate prices at over the $4.00 per gallon wholesale level are in record territory after reaching a peak of $4.7072 in April 2022.
NYMEX Natural Gas Futures Chart (Barchart)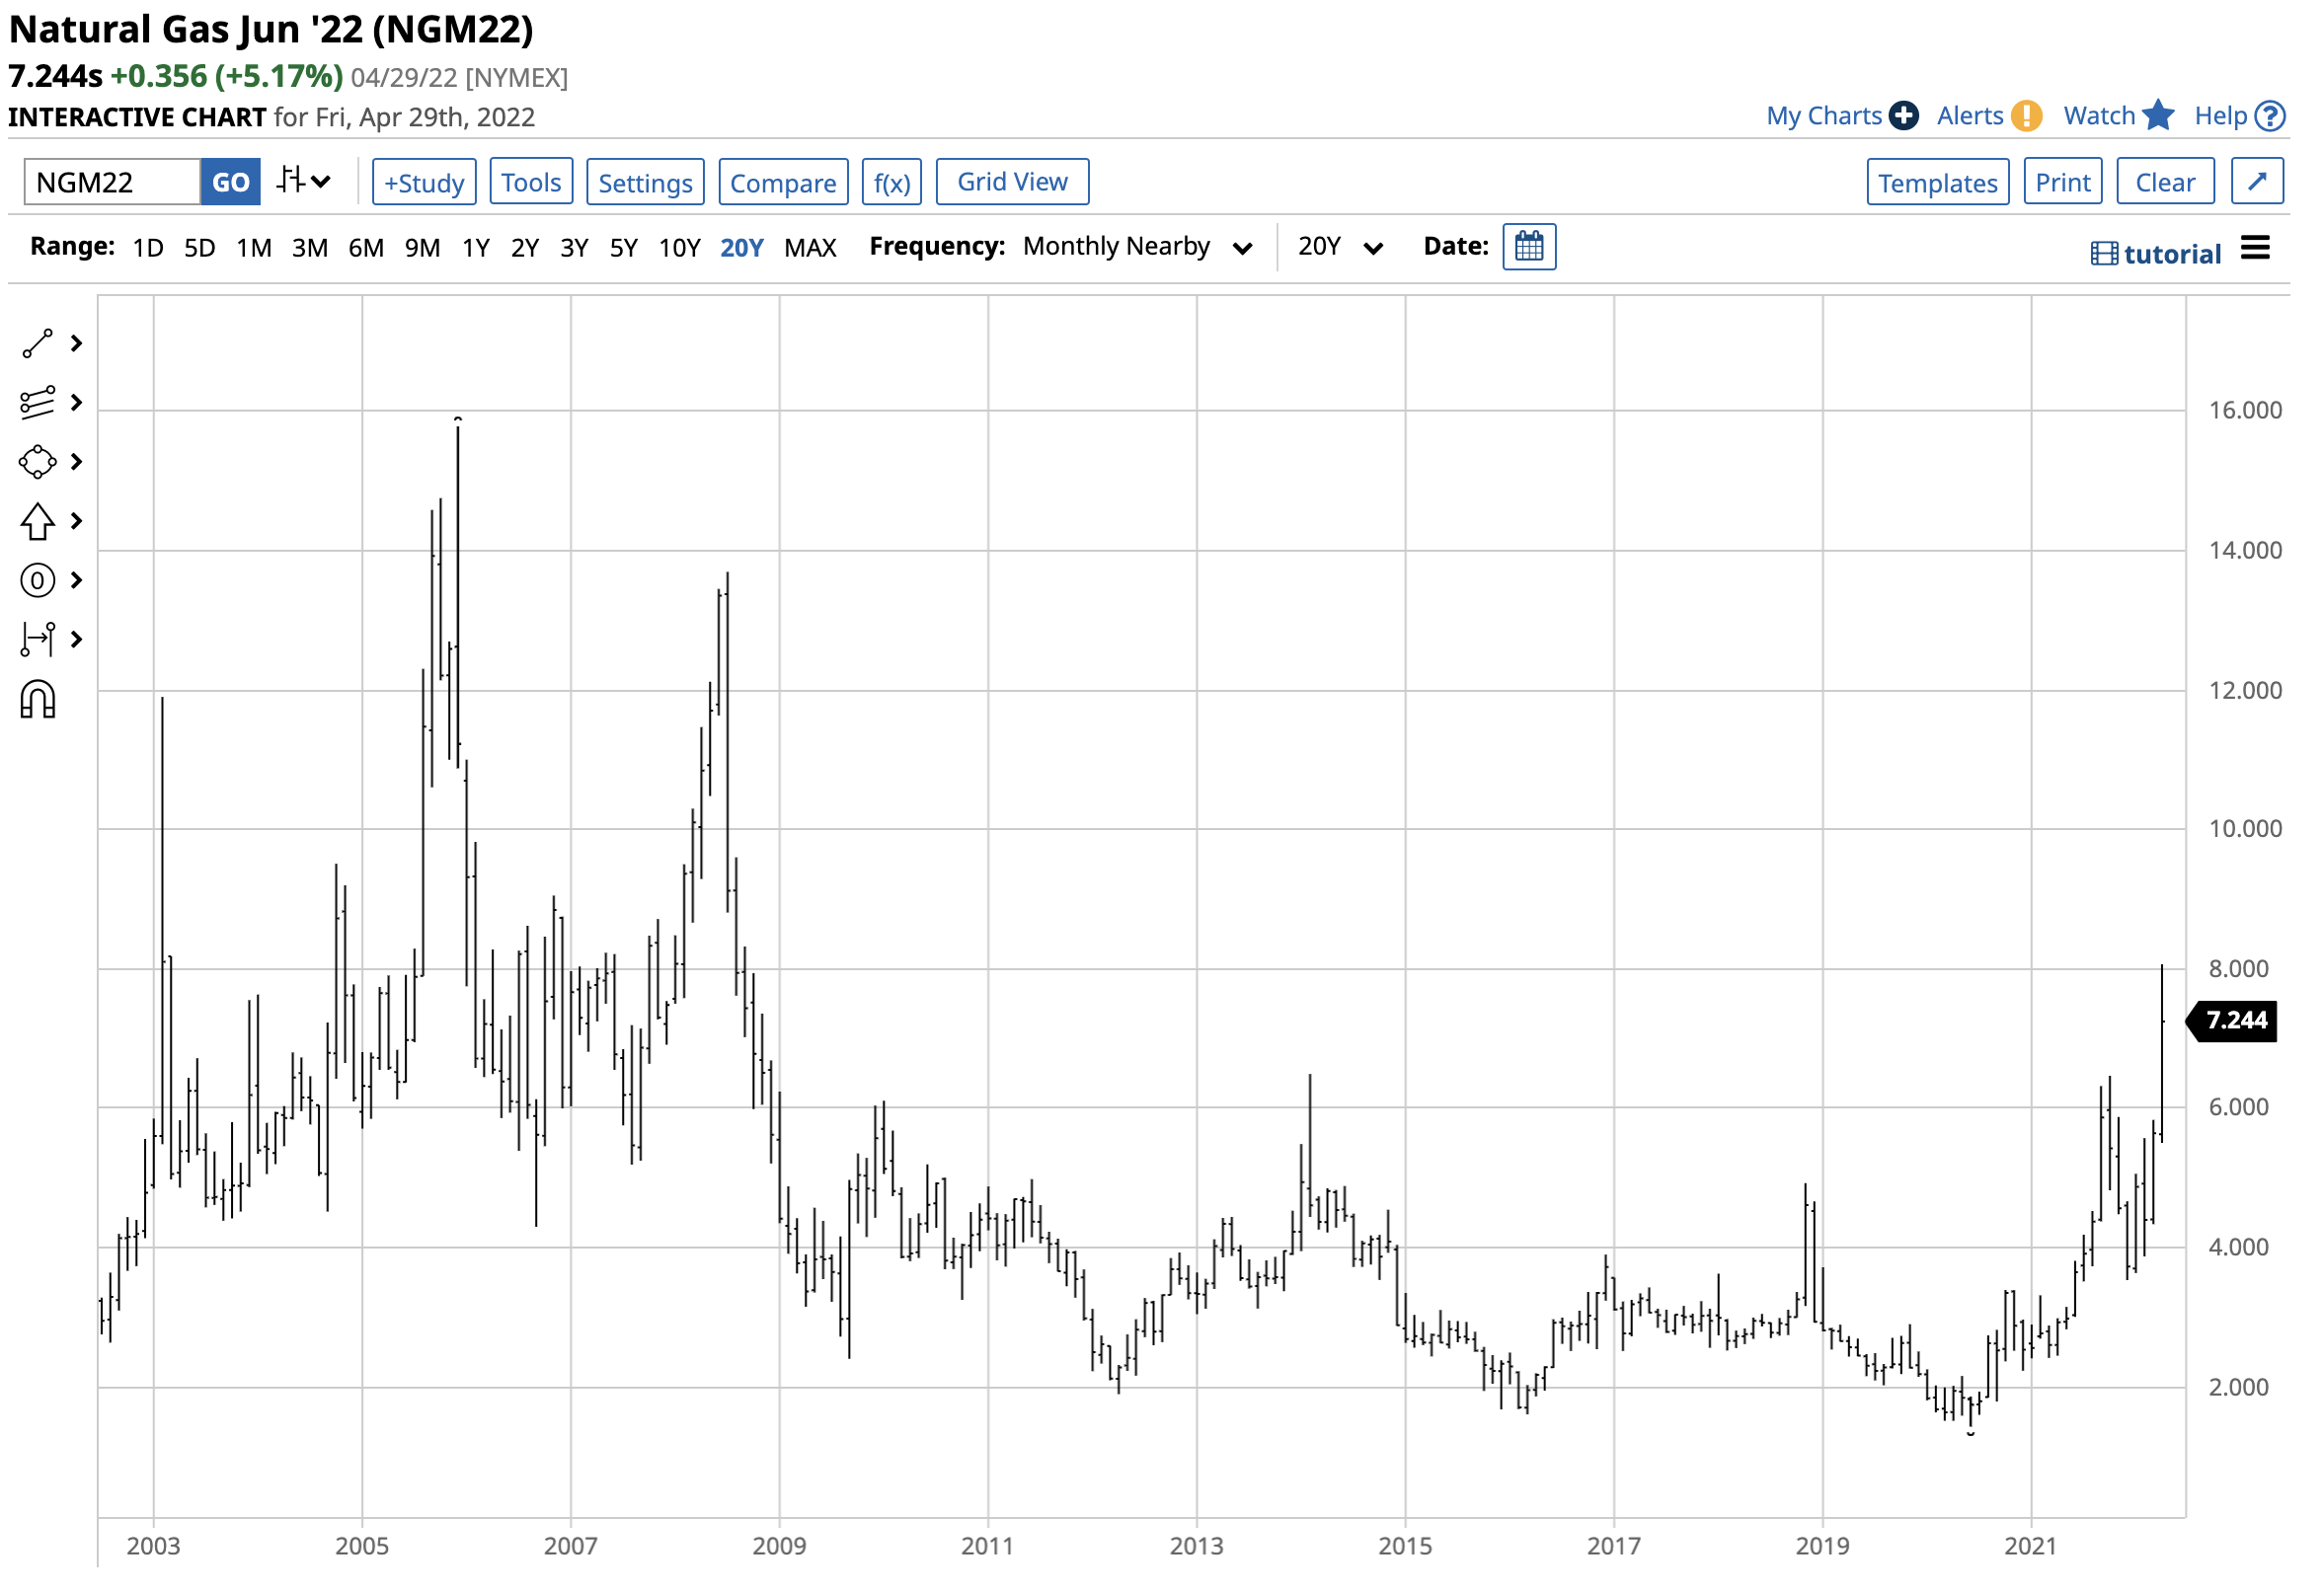
NYMEX natural gas futures at $7.244 per MMBtu was at the highest price since 2008 during the offseason for demand.
The geopolitical landscape supports prices
Since 2016, Russia has had a rising influence in the global energy markets as it has cooperated with OPEC, the international oil cartel, on production policy. Russia also supplies Europe with the natural gas that powers the continent.
The war in Ukraine and sanctions continue to cause supply concerns in the oil and gas arena. Last week, Russia banned natural gas exports to Poland and Bulgaria for their support of Ukraine. Germany is considering banning Russian oil imports, and Russia could impose export bans for all fossil fuels to "unfriendly" countries. China and India continue to import Russian hydrocarbons, so revenues will flow to Moscow.
No significant change in US energy policy
The United States, a substantial producer of oil and gas, continues to address climate change with an energy policy that encourages alternative and renewable fuels and inhibits fossil fuel production and consumption. Last week, the Biden administration overturned the previous administration's policy that would have opened new swaths of Arctic Alaska to oil development despite the global supply concerns and high prices.
There has been no change in the US energy policy since early 2021 to address soaring oil and gas prices because of the economic war between Russia and the west. While the administration is releasing one million barrels of crude oil from the strategic petroleum reserve each day, in 2021, the US consumed around 19.78 million barrels daily. As of the week ending on April 22, the EIA reported that US daily output stood at 11.90 mbpd. Production and the SPR release leave the US around seven mbpd short in the current environment, strengthening Russian and OPEC's influence in the oil market.
When it comes to natural gas, the latest EIA inventory data as of April 22 showed that stockpiles were 21.4% below last year and 17% under the five-year average. While stocks and production are below previous years, the US and global demand remain robust. The geopolitical landscape continues to support higher gas and oil prices, which will boost earnings for traditional energy companies.
The XLE has outperformed the stock market indices
As of the close of business on April 29, the Energy Select Sector SPDR Fund was trading at the $75.15 per share level. The top holdings of XLE include:
Top Holdings of the XLE ETF Product (Barchart)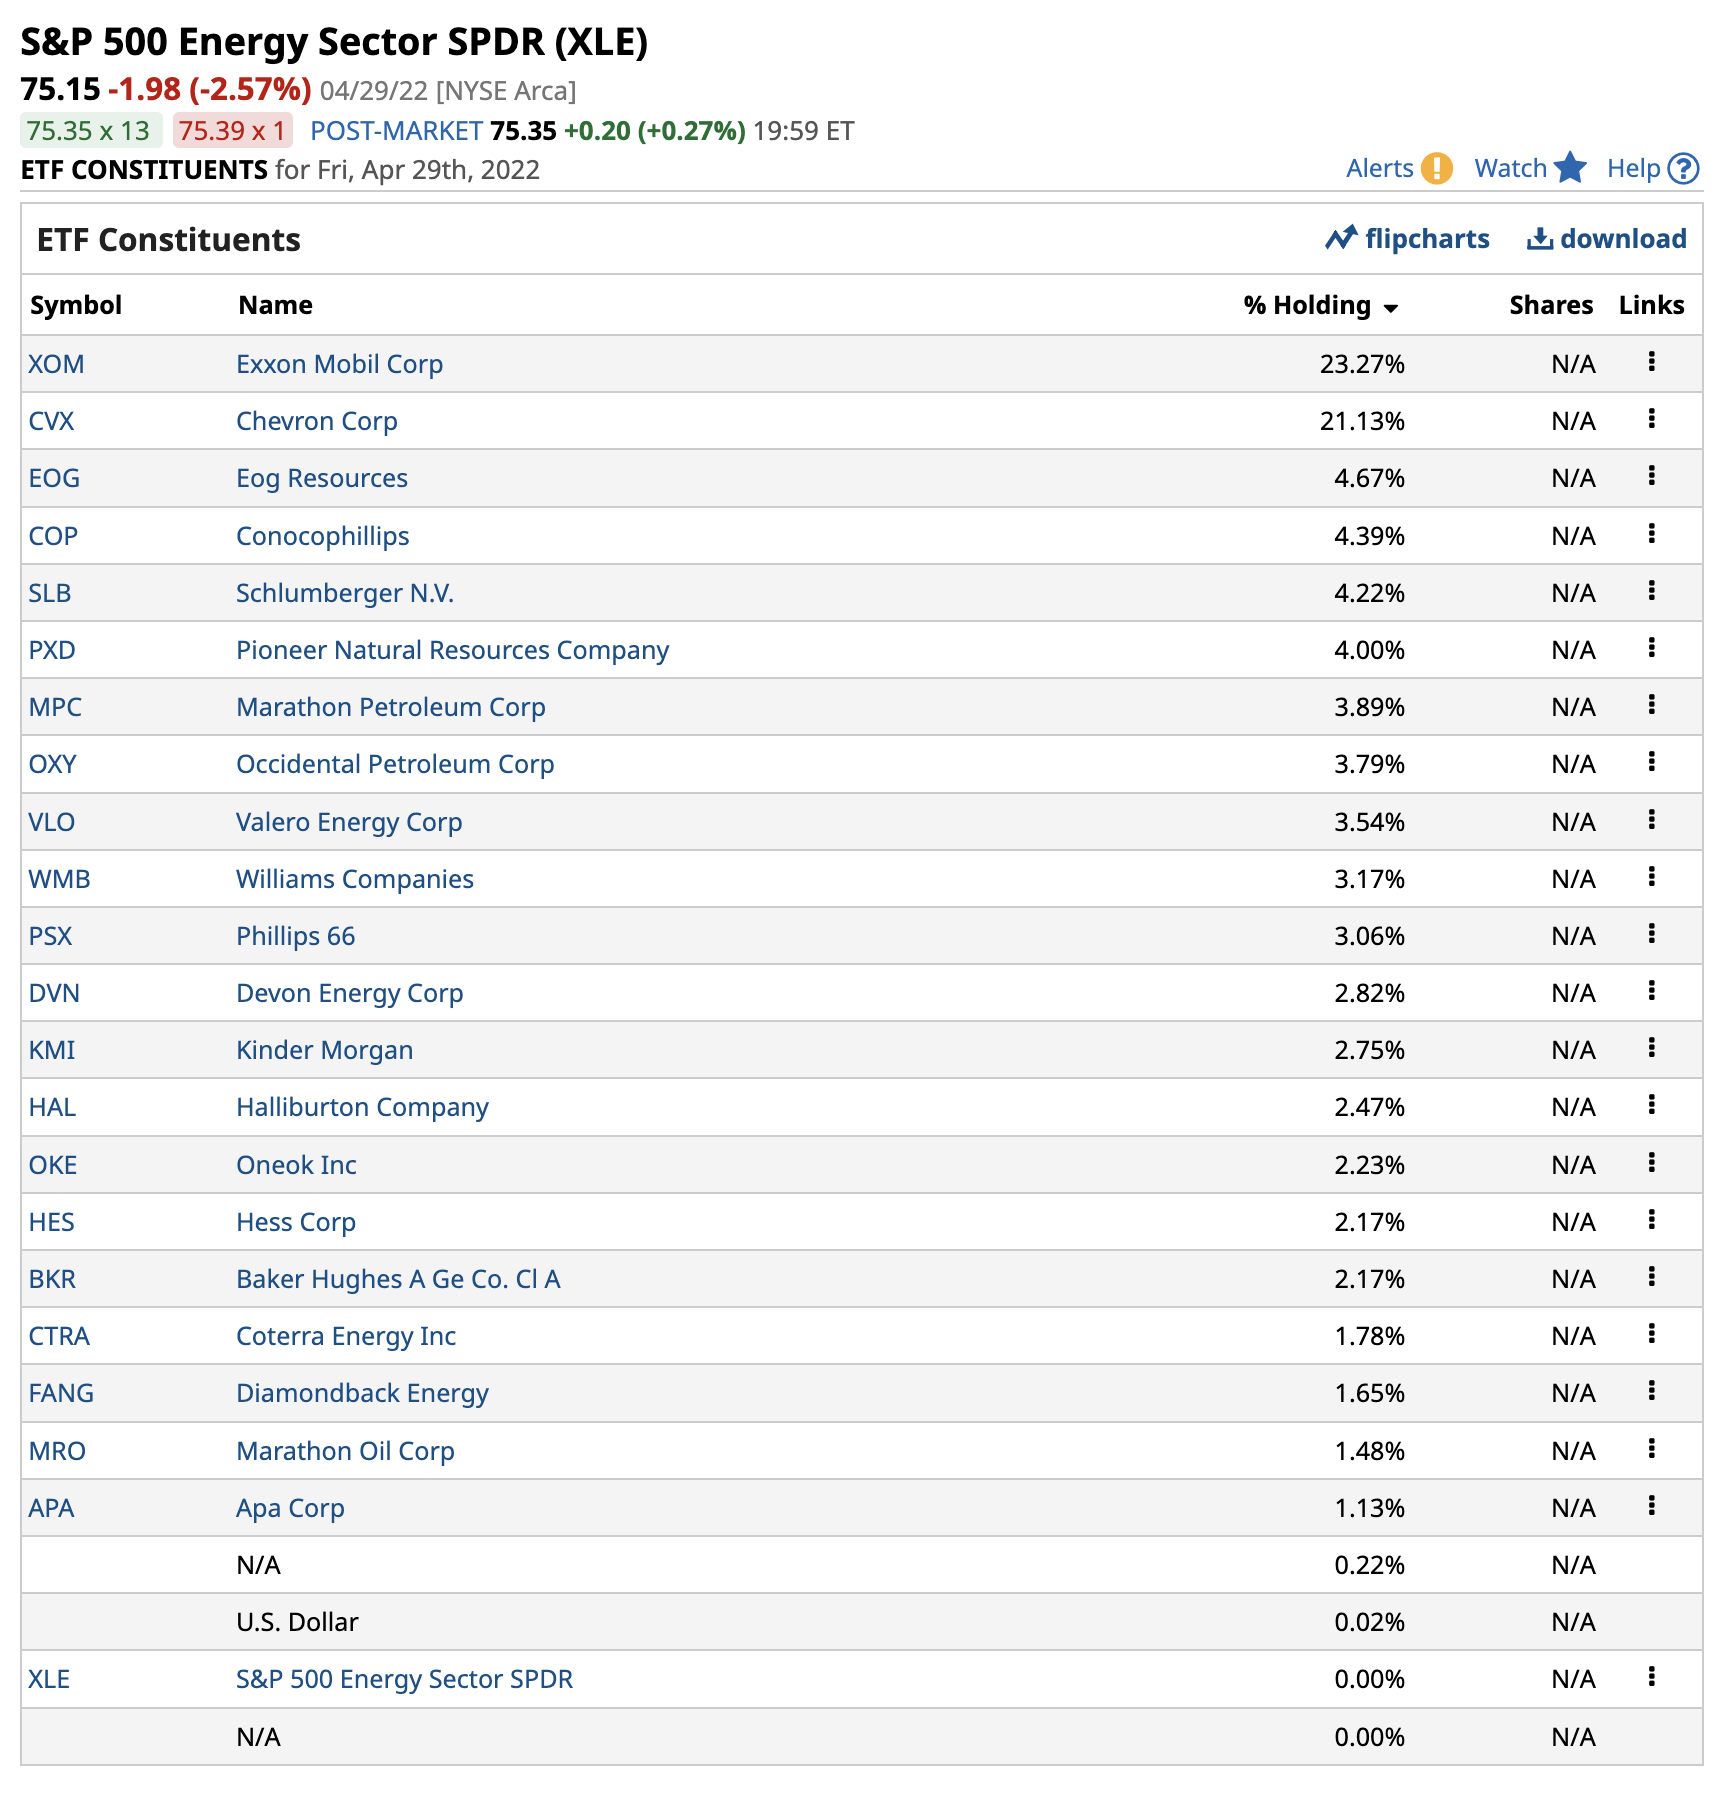
The chart shows that the XLE has a 44.40% exposure to Exxon Mobil (XOM) and Chevron (CVX), the two leading US oil and gas producers that benefit from high fossil fuel prices.
At $75.15, the XLE has over $37 billion in assets under management. The ETF trades an average of over 32.2 million shares each day and charges a 0.10% management fee.
Chart of the XLE ETF Product (Barchart)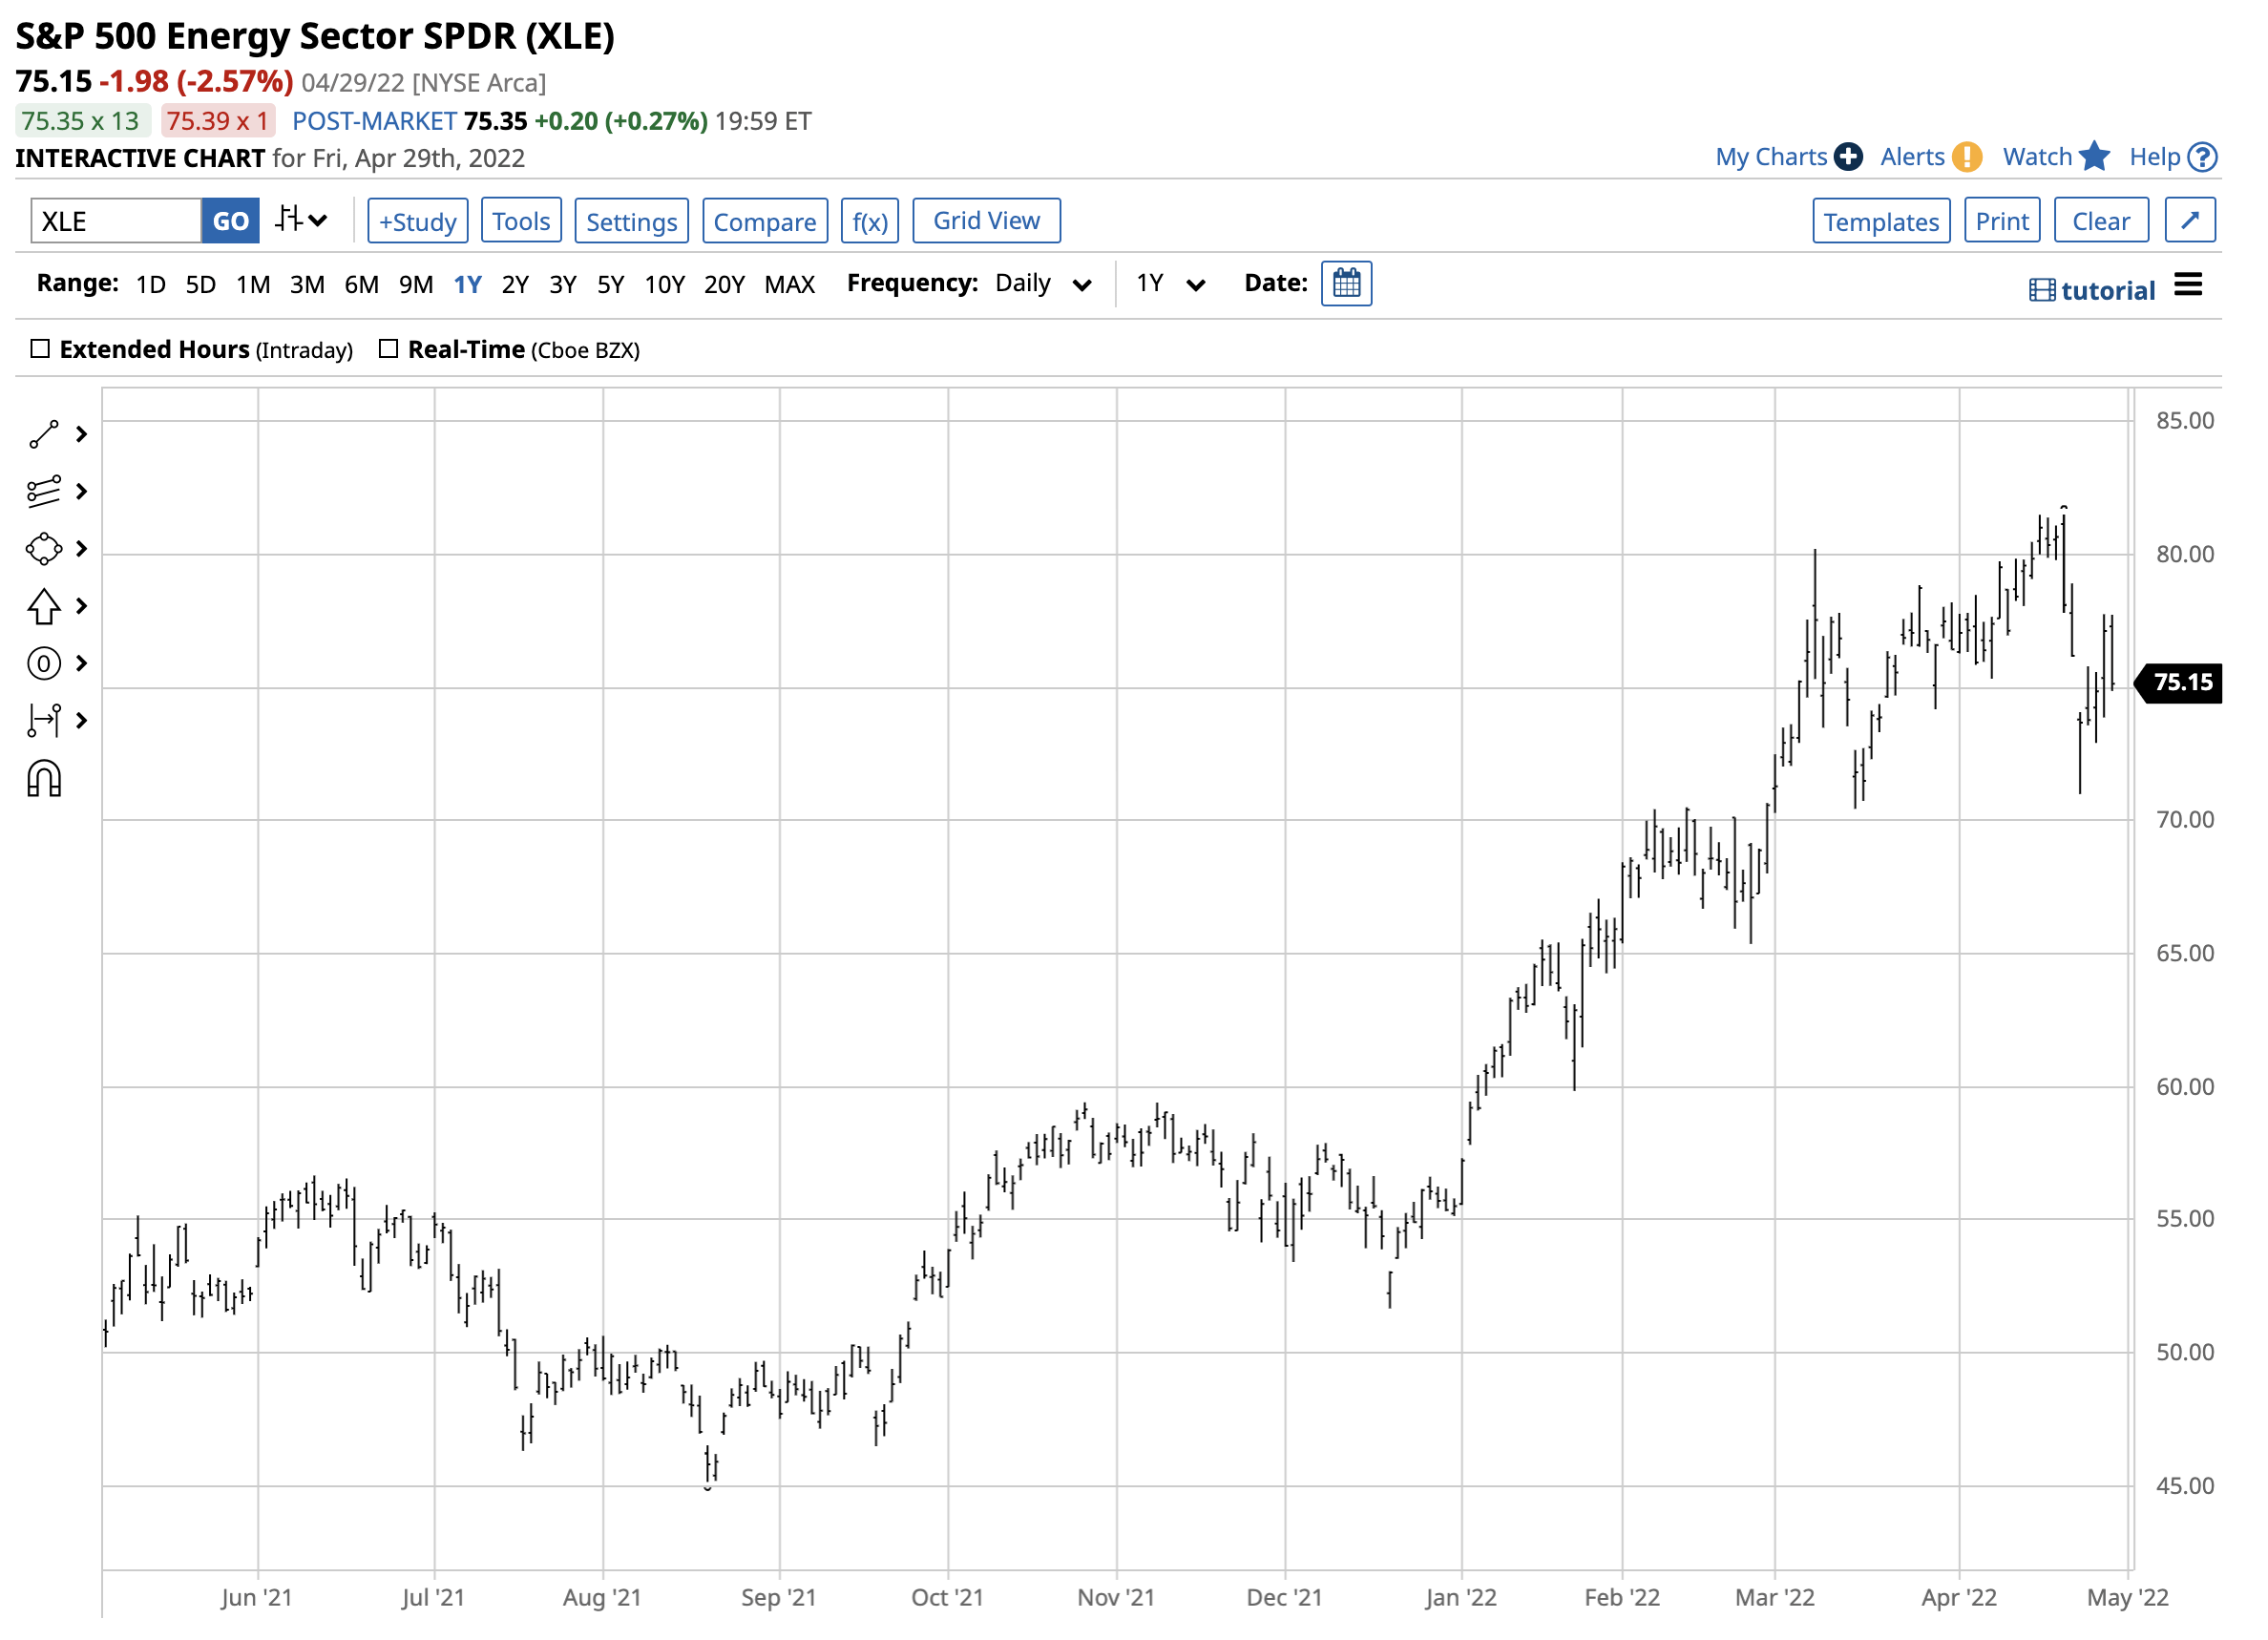
The chart shows the XLE rose from $55.50 on December 31, 2021, to $75.15 on April 29, 2022, a 35.4% gain over the first four months of 2022.
The S&P 500 is the most broadly-based equity index for US stocks.
Chart of the S&P 500 Index (Barchart)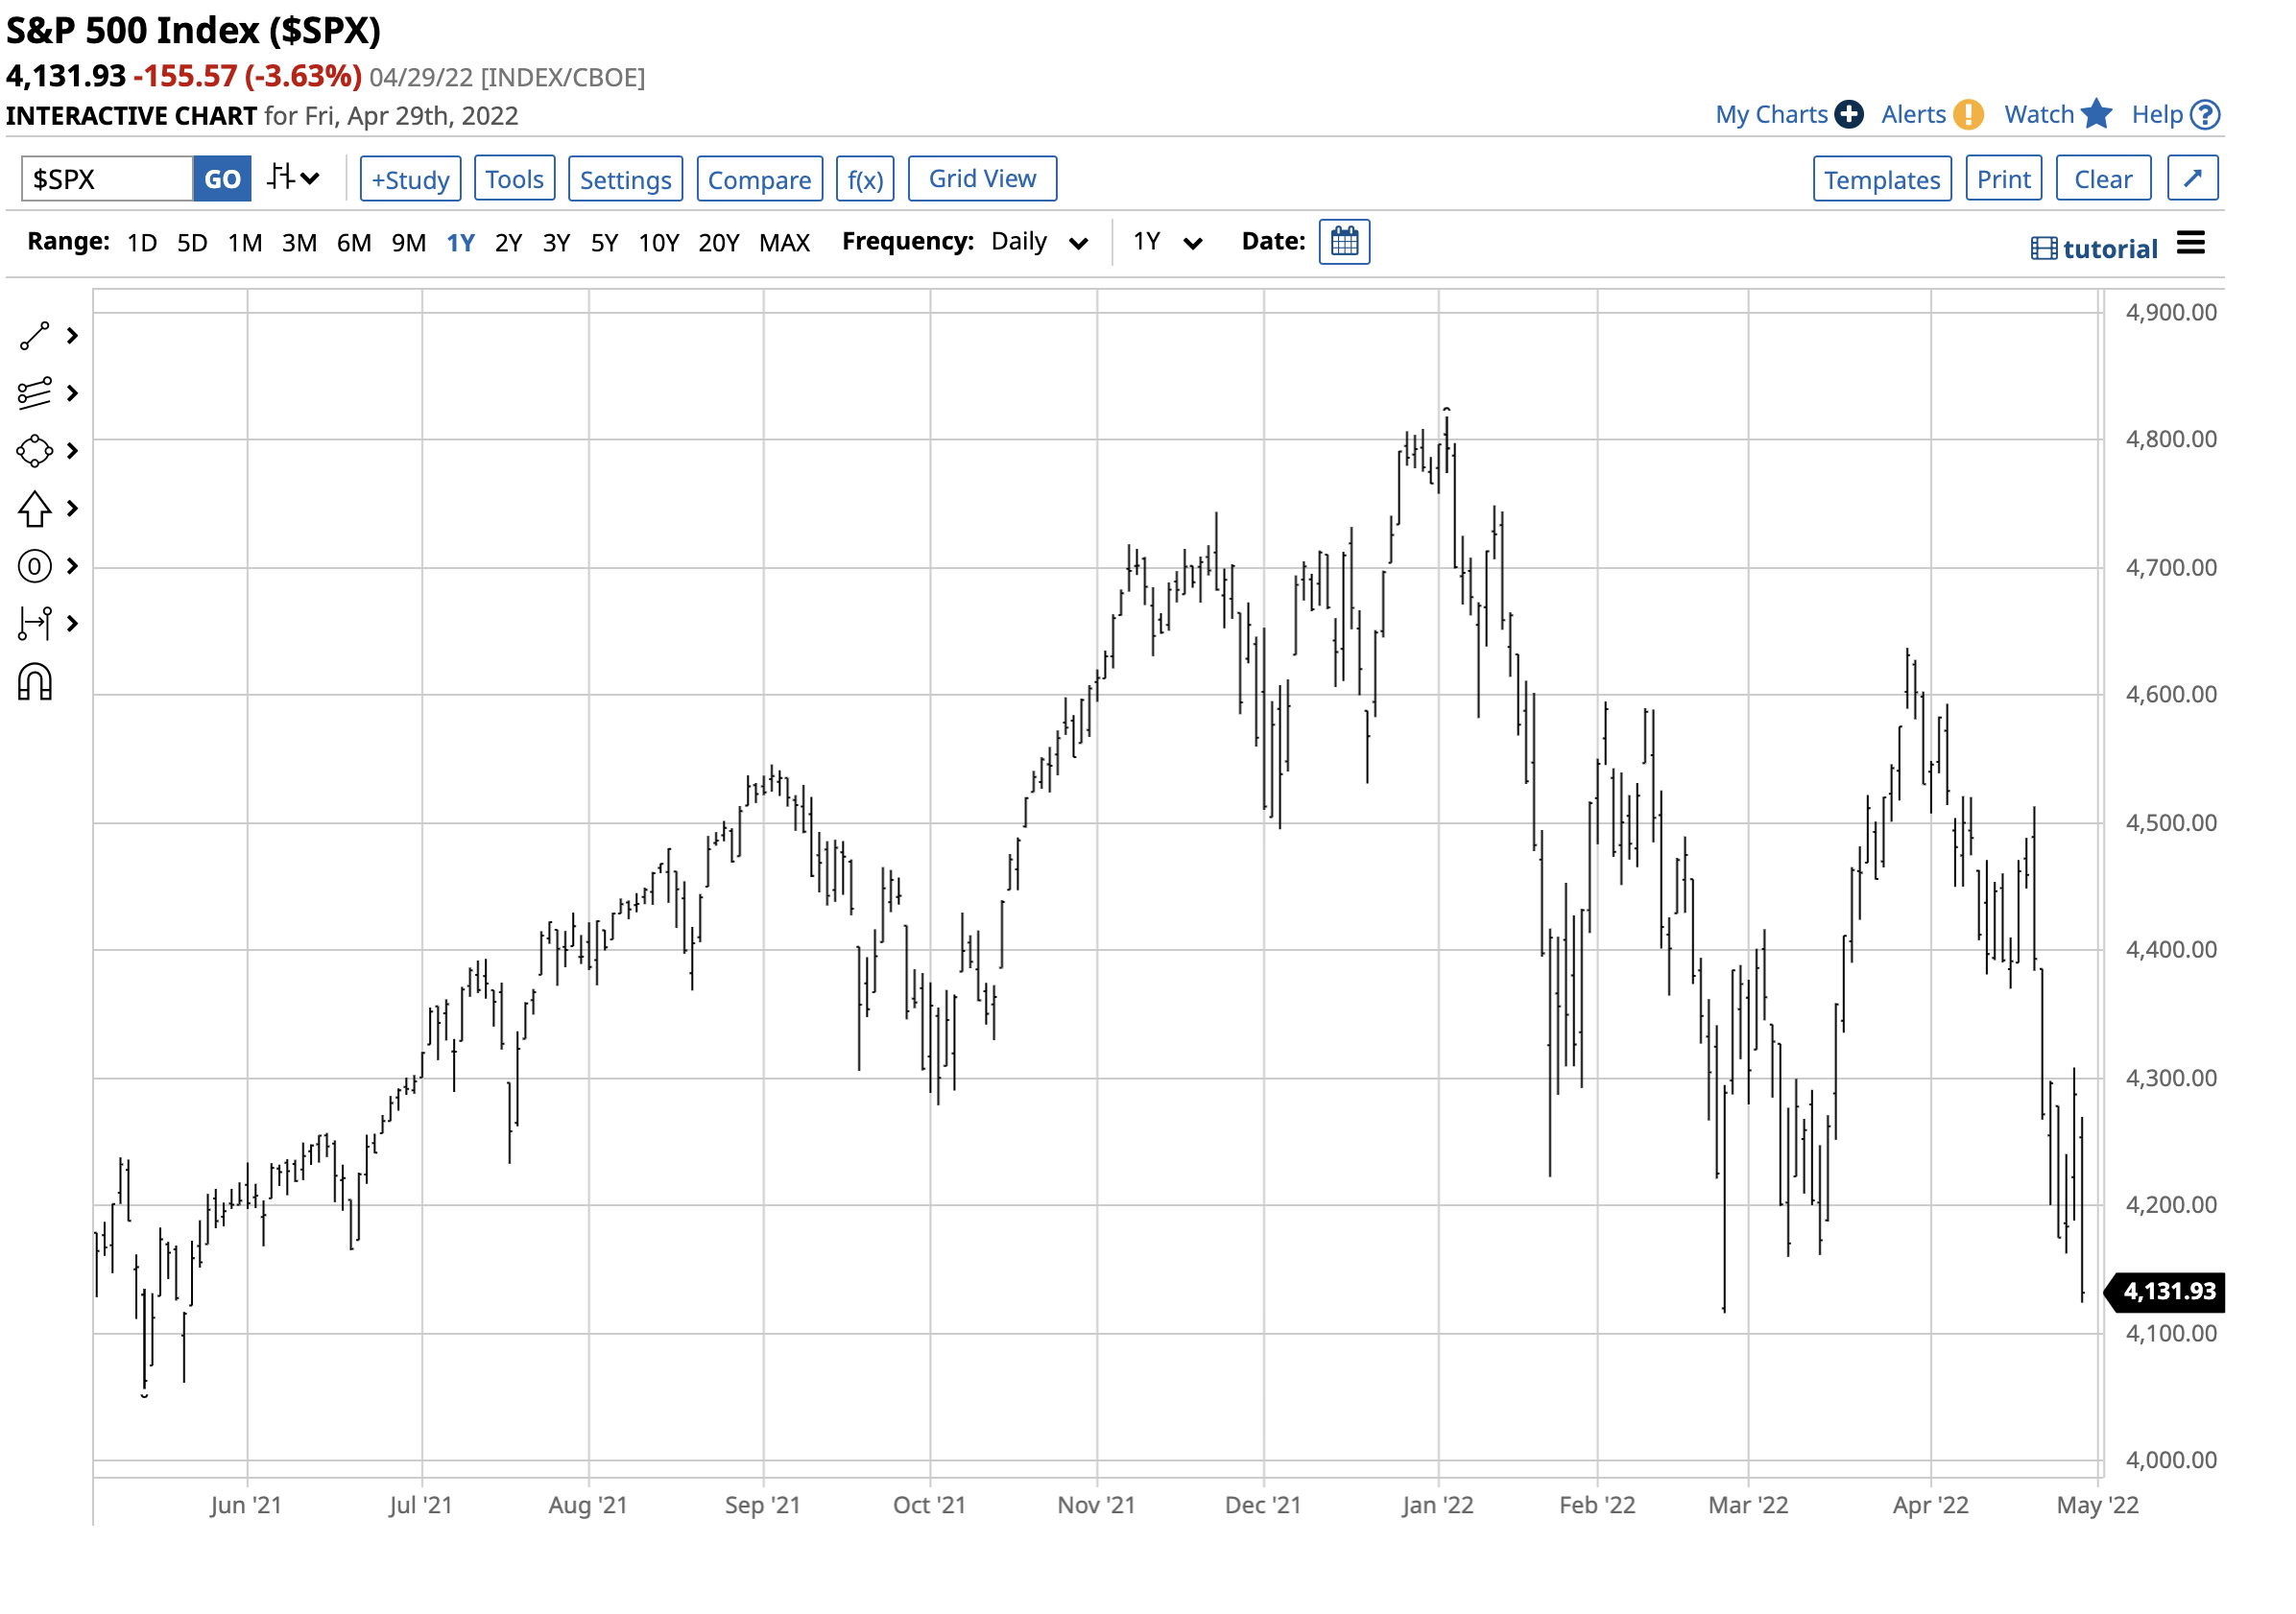
The chart shows the decline from 4,766.18 at the end of 2021 to 4,131.93 on April 29, a 13.3% decline so far in 2022. The XLE has outperformed the stock market in 2022, and the trend remains higher at the end of April.
The APS is long the XLE
As of April 29, 2022, the trend in XLE shares was higher. The APS was long XLE shares as the trend is always your best friend in all markets. APS holds ten highly-liquid and optionable stocks and ETF products. XLE is a component as it meets the strategy's requirements. At $76.25 per share, the ETF has been trending to the upside, making higher lows and higher highs.
Following trends via an algorithmic system requires strict adherence to rules. We do not attempt to pick bottoms or tops in any markets and are typically short at bottoms and long at tops. Taking the most significant percentage out of trends requires removing emotional impulses from trading and investing. We ignore fundamentals, news, and all of the daily noise. Our signals are never intraday, and they can only change at the end of a session. Our system does not get caught up in the daily frenetic trading activity. News and noise are at a frenzied level with the war in Ukraine, inflation raging, and pundits opining on the central bank's next move. We ignore the noise. The APS is always long or short its components.
The price of any asset is always the correct price because it is the level where buyers and sellers meet in a transparent environment, the marketplace. Crowd behavior that determines trends can be the optimal market approach across all asset classes. As of April 29, the crowd's wisdom points to a bullish trend in XLE. The APS will issue a sell signal for the XLE ETF product when the trend changes.
Looking to reduce the stress of making trading and investment decisions by eliminating emotions from the equation?
The Algo Portfolio System (APS) allows the markets to work for you instead of having you work for the markets. The portfolio uses only high-quality, highly liquid stocks and ETFs. It is always long or short, so it does not miss any significant price trends. We have found that the APS offers a 66%-win rate over time. Drawdowns are part of investing and trading. However, sticking with the program over the long term increases the odds of success. Sign up for today for a free trial!
This article was written by

Andy Hecht and Todd "Bubba" Horwitz are partners at Bubba Trading.
Andy has over forty-year experience as a trader and analyst. He is well-known to Seeking Alpha readers. He has been a prolific contributor for years covering markets across all asset classes.
Bubba is a trader and educator with over four decades of experience in the rough-and-tumble futures and options trading pits in Chicago. He appears on all of the major business networks as a contributor.
Together, Andy and Bubba provide an upstairs-downstairs perspective on markets that encompasses a top-down and bottom-up approach to trading and investing. The pair have created proprietary models and systems that remove ego and emotional impulses from trading and investing. An emotion-free approach with Bubba Trading's Algorithmic Portfolio System reduces stress and improves performance, over time. Todd and Andy are collaborating to bring their Algo Portfolio System to Seeking Alpha's Marketplace.
Disclosure: I/we have a beneficial long position in the shares of XLE either through stock ownership, options, or other derivatives. I wrote this article myself, and it expresses my own opinions. I am not receiving compensation for it (other than from Seeking Alpha). I have no business relationship with any company whose stock is mentioned in this article.