ARCC: Q1 Numbers Look Better Than Market's Reaction
Summary
- We discuss Q1 results from ARCC and highlight key income dynamics of the portfolio.
- The market rewarded the Q1 release with a 9% drop in the stock's price.
- The internals of the release are actually quite strong - with one of the highest NII levels over the last 2 years and a rise in the NAV.
- The company's income has just started to benefit from the rise in short-term rates and we expect Q2 numbers to reflect this dynamic.
- At a valuation of 104-107% ARCC looks an attractive hold in the BDC sector.
- I do much more than just articles at Systematic Income: Members get access to model portfolios, regular updates, a chat room, and more. Learn More »
da-kuk/E+ via Getty Images
This article was first released to Systematic Income subscribers and free trials on Apr. 27
In this article, we catch up on Q1 results from the Ares Capital Corp (NASDAQ:ARCC).
ARCC entered the earnings season priced for perfection in a challenging market environment. Its valuation of 114% was not far off its historic record. At the same time, as we have discussed in a number of previous BDC sector weekly reports, BDC income levels were facing a number of headwinds. Finally, ARCC has had a tendency to sell off even after solid quarterly results.
This combination of factors created an unattractively asymmetric profile for shareholders so it was not a surprise that ARCC fell nearly 9% on the day of the earnings release, correcting to a much more sensible valuation level.
Overall, the internals of the results are actually quite solid. Net income did move lower but it still came in above 5 of the last 7 quarters despite an unfavorable environment for prepayment activity and a drop in portfolio leverage. ARCC also managed to generate net unrealized and realized gains of 0.6% on NAV before taking into account the partially offsetting repayment of the convertible debt - a very respectable number in a period of widening credit spreads and lower stock prices.
At its current valuation of 104% and a total dividend yield of 9.09% the stock looks attractive in the broader BDC space.
Quarter Update
ARCC delivered GAAP income of $0.41 with core income of $0.42. Core income trailed the $0.47 consensus estimate and was well below the $0.58 figure in Q4.
In our previous BDC weekly reports we highlighted that one of the key dynamics of Q1 was likely to be a slowdown in income on the back of lower risk sentiment creating fewer exit opportunities (i.e., IPOs and M&A) and driving a lower level of prepayment fees as well as lower seasonality-driven origination activity.
This is exactly what happened. Fee income fell by $86m or 74% (green portions in the bars). Higher volatility makes opportunistic prepayments less likely while lower risk sentiment and market liquidity makes exits such as IPOs and M&A less frequent, both factors that have pushed fee income lower. If the current environment of heightened volatility and wider credit spreads persists over the rest of Q2 as well we don't expect fee income to come back to the levels of previous quarters.
Systematic Income BDC Tool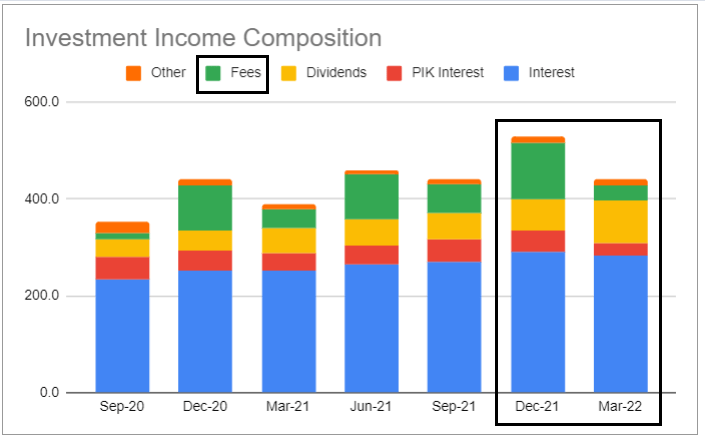
The recent rise in short-term rates has also been a negative factor for most BDCs due to the presence of Libor floors on the asset-side of the balance sheet and their absence in the floating-rate credit facilities on the liability side. The level of Libor at the end of Q1 was in what we call the NII valley - a temporary drop in BDC income levels before their eventual rise in the second half of the year as Libor moves above the weighted-average floor level.
This, along with a drop in leverage, is likely what caused an 8% drop in interest income (the sum of the red and blue areas of the bars above).
However, despite the sharp reaction by the stock, the news wasn't actually all that bad. GAAP NII per share (blue bars below) was above 5 of the last 7 quarters. The two quarters that saw higher income levels were both December quarters which benefited from the typical seasonality tailwind.
Systematic Income BDC Tool
Coverage fell from Q4 as income levels moved lower and dividends moved higher on the back of the previous increase. Although current coverage (most relevant figure is the green bar below) is below 100% it doesn't reflect the fact that short-term rates have already boosted the company's income level.
Systematic Income BDC Tool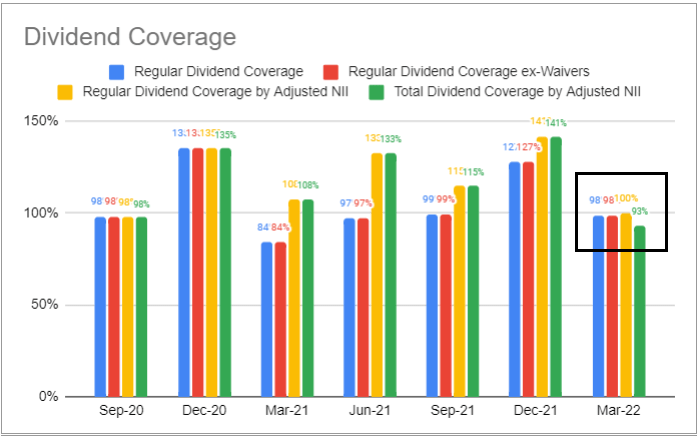
The NAV increased by 0.4% to a record high of $19.03 from $18.96 as of Q4. This was due to positive net realized and unrealized gains, partly offset by a realized loss related to a repayment of a convertible bond.
Systematic Income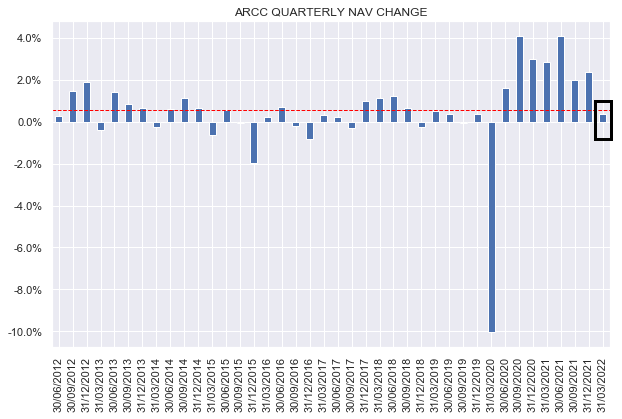
This downtrend in quarterly NAV change is an inevitability that we have highlighted over the last few months. The historic average rise in the ARCC NAV is about 0.5% so the 2-4% numbers we have seen in the post-COVID period are obviously anomalous and have made up for the sharp fall over Q1 of 2020. The fact that the company managed a 0.4% gain in the last quarter in the face of overdistribution relative to NII and lower public market valuations is a very good result for shareholders.
Income Dynamics
Arguably the biggest driver of income for ARCC and the rest of the BDC space will be rising short-term rates. At the end of Q1, Libor rose a touch above the weighted-average floor of the ARCC portfolio. The key point here is that investors have not yet benefited from the bump in short-term rates. Assuming, no credit spreads compression, the company's net income increases by 14% for a rise in Libor to around 2% and increases by 26% for a rise in Libor to around 3%. With Libor around 1.1% net income is already getting an uplift.
That said, some spread compression is inevitable, particularly given we are in a pretty healthy borrower environment with relatively few defaults so the full uplift mentioned above is unlikely to materialize. Plus, given 3-month Libor resets on a quarterly basis and then accrues for another 3-months, the full benefit will probably not be realized until some point in Q3.
The company's weighted-average yield on debt assets (blue bars) moved higher despite a drop in yield on newly acquired assets due to the rise in Libor. At the same time the rise in the weighted-average cost of debt also ticked higher for the same reason. The net result is a plus for net income, not only because the asset-side income increased by more than its cost but also because the cost of debt applies to a smaller amount of liabilities than the amount of floating-rate debt assets.
Systematic Income BDC Tool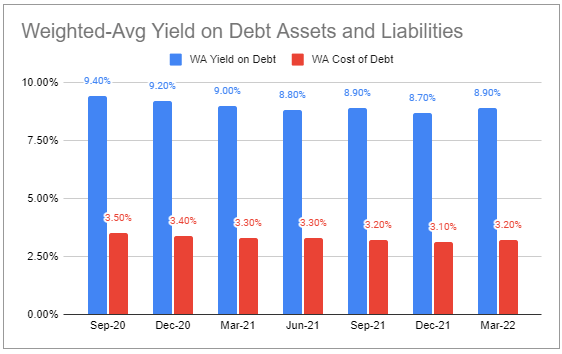
In January, ARCC issued $500 million of 2 7/8 percent 2027 unsecured notes which was apparently the lowest spread (over Treasuries) at new issuance for any BDC. It's hard to overstate what a good deal this was in retrospect since 5-year Treasuries are trading at nearly the same coupon today. This issuance also marginally lowered the company's weighted-average debt cost. At present the company has only 7% of its fixed-coupon debt maturing in the next two years.
The company's leverage stepped down to a four-quarter low as shown below. ARCC targets a leverage net of cash figure which was at 1.06x at quarter end - down from 1.21x in Q4. The target range for this metric is 0.9x to 1.25x. Management specifically commented that in a period of heightened volatility such as the one we are having now the current leverage figure is appropriate. It is also quite possible that the company moved leverage lower in anticipation of the NLY deal. If leverage remains at current levels investors should expect a somewhat lower level of income from the very strong Q4 figures though more in line with previous quarters.
Systematic Income BDC Tool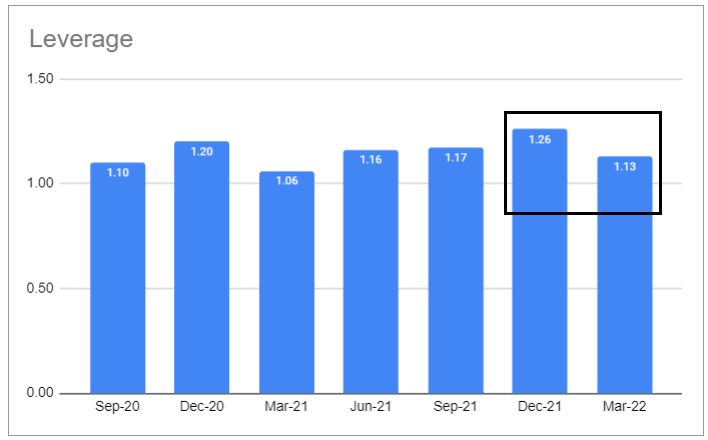
Portfolio Quality
An important question on the minds of many BDC investors is whether rising short-term rates will make it harder for portfolio companies to service their debt. Obviously, this question also depends on the broader macro outlook over the next year so it's impossible to answer with any certainty. That said, management provided some commentary on this question:
We also do not expect that a projected increase in rates will result in deteriorating credit performance, particularly given our strong starting point with portfolio weighted average interest coverage of nearly 3 times. What this means is that holding all else equal, including the leverage at the borrower level, short-term base rates would need to rise above 3% before aggregate interest coverage would dip below 2 times, which is similar to the 5-year pre-pandemic weighted average of 2.3 times.
The average portfolio quality grade was roughly unchanged with a rise in the highest grade allocation and a drop in the second-highest grade.
Systematic Income BDC Tool
Non-accruals ticked up slightly but remain well below the sector median of 2.5% on a fair-value basis.
Systematic Income BDC Tool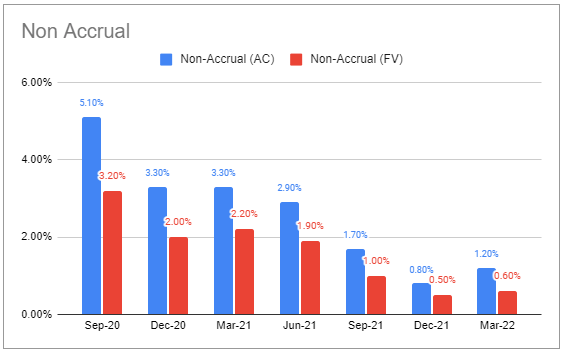
PIK income moved lower and is a bit above the sector median level of 4%.
Systematic Income BDC Tool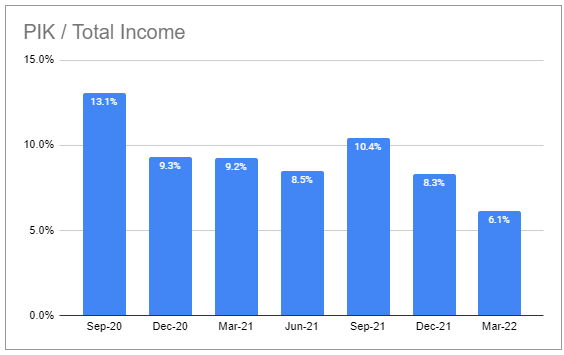
Valuation Profile
At present the company's valuation of 104% is just 1% above the sector average. The chart below shows its historic valuation relative to the broader sector average and median levels. A valuation that is roughly in line with the sector is fairly unusual for ARCC over the last 3 years or so when it has tended to trade at a significantly higher valuation. It should be said that this picture is not quite apples-to-apples since we are using the Q1 ARCC NAV and Q4 NAVs for all the other BDCs. That said, we don't expect a massive bias one way or another.
Systematic Income BDC Tool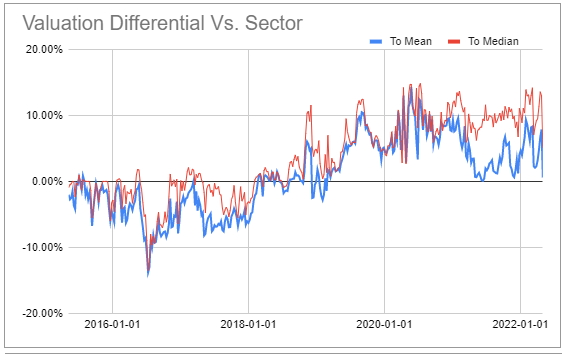
We like to look at BDC valuation in the context of historic total NAV returns. ARCC is marked with a circle and BDCs with a similar historic total NAV CAGR of around 12-16% are marked with a rectangle. What this shows is that ARCC is on the cheaper end of those BDCs that have managed to deliver this kind of return. In other words, most other BDCs with a similar track record trade at more expensive valuations.
Systematic Income BDC Tool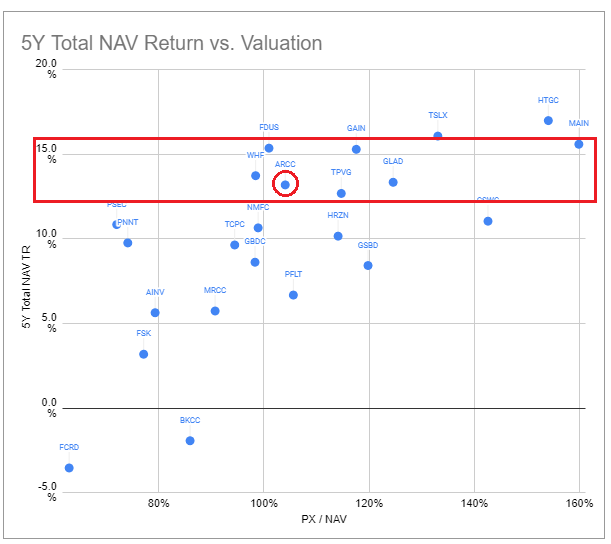
What this tells us is that the current valuation of 104% is unlikely to last unless we see further weakness in the sector and we would consider adding at current levels.
Takeaways
The sharp 9% drop in the price of ARCC post its Q1 release is very odd to say the least. First, it's not clear what exactly the market was expecting given the significant net income headwinds over Q1 that we have been talking about over the last few weeks. Despite this the stock was also trading near its record high valuation. In retrospect the stock was priced for perfection in a challenging market environment and its Q1 results didn't match the extrapolated expectations based on previous quarters.
Overall, the internals of the Q1 numbers are pretty good. Net income moved lower from an unsustainably high level but still came in at a very good level despite a number of headwinds and a drop in leverage. Going forward it will start to benefit from the aggressive rise in short-term rates which should result in a significant pick-up in net income over the coming quarters. The rise in the company's NAV, despite weakness in public market credit valuations, was another great result.
At the valuation of 104% as of this writing ARCC (i.e., at a price of $19.80) presents an attractive proposition for income investors. This valuation is unlikely to last unless the entire sector falls out of bed, however. We wouldn't chase it back above 110% (or $20.90) as the sector will likely remain volatile over the near term.
Check out Systematic Income and explore our Income Portfolios, engineered with both yield and risk management considerations.
Use our powerful Interactive Investor Tools to navigate the BDC, CEF, OEF, preferred and baby bond markets.
Read our Investor Guides: to CEFs, Preferreds and PIMCO CEFs.
Check us out on a no-risk basis - sign up for a 2-week free trial!

This article was written by

At Systematic Income our aim is to build robust Income Portfolios with mid-to-high single digit yields and provide investors with unique Interactive Tools to cut through the wealth of different investment options across BDCs, CEFs, ETFs, mutual funds, preferred stocks and more. Join us on our Marketplace service Systematic Income.
Disclosure: I/we have a beneficial long position in the shares of ARCC either through stock ownership, options, or other derivatives. I wrote this article myself, and it expresses my own opinions. I am not receiving compensation for it (other than from Seeking Alpha). I have no business relationship with any company whose stock is mentioned in this article.