Trading The Top 10 Stocks From 40 Large Hedge Funds: Trading Update 4/30/2022

Summary
- This portfolio strategy uses the quarterly 13F filings to extract 50 consensus stocks from 40 large hedge funds that have more than $3.5 billion Assets Under Management.
- After the Q4-2021 13F filings the consensus holdings were updated, 7 stocks were removed and 7 added from the universe now holds 48 stocks.
- From 1/2/2016 to date, investing in all 50 stocks, equally weighted, would have produced a total return of 99.4%, an active return of -26.8% when compared to SPY’s 126.3%.
- A strategy selecting 10 of the 50 stocks, equally weighted, would have increased the total return to 187.4%, an active return of 61.1% when compared to SPY.
- Here we report the most recent holdings and the trading signals for 5/2/2022.
designer491/iStock via Getty Images
Research from Barclays and Novus published in October 2019 found that a copycat stock selection strategy that combines conviction and consensus of fund managers that have longer-term views outperformed the S&P 500 by 3.80% on average annually from Q1 2004 to Q2 2019.
Based on that rationale, we previously presented two trading models (in Article-1 and Article-2) that use the top 50 consensus stocks of 40 Large Hedge Funds (listed in Appendix A below), that historically outperformed the S&P 500. The iM-Top50 (from 40 Hedge Funds) model holds all 50 stocks equally weighted and has a low turnover. The iM-Top10 (from 40 Hedge Funds) model holds a subset of 10 stocks, also equally weighted, but with higher turnover which is rewarded by improved returns.
The performance simulation and generation of trading signals for these strategies are done using the platform Portfolio123 and reported below. For a more comprehensive description of the 50 stock universe, please refer to here.
Model Performance:
iMarketSignals.com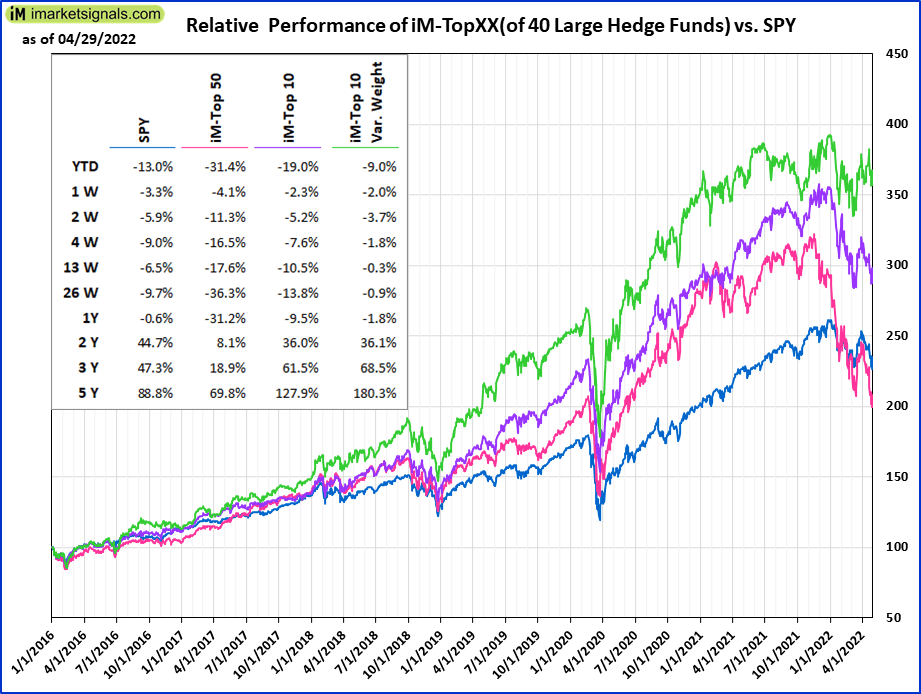
Note: iM-Top10VariableWeight (of 40 Large Hedge Fund) model will be released soon.)
Trade Signals for 5/2/2022
| iM-Top10 from 40 Large Hedge Funds | |||
| Action | Ticker | Shares | Name |
| SELL | TDG | 46 | TransDigm Group Incorporated |
| BUY | MA | 76 | Mastercard Incorporated |
| Rebalance SELL | BBWI | 71 | Bath & Body Works, Inc. |
| Rebalance BUY | CHTR | 9 | Charter Communications, Inc. |
| iM-Top50 (of 40 Large Hedge Funds) | |||
| Ticker | Action | Shares | Name |
| No Trades | |||
The models trade on the first trading day of the week. Trading signals are published on a weekly basis here on Seeking Alpha (subject to model trading and editor’s acceptance) and on iMarketSignals. Next update on Sunday 5/8/2022.
Holdings for iM-Top10 (of 40 Large Hedge Funds) as of 4/29/2022
| Current Portfolio 4/29/2022 | Cash Flow | ||||||||
| Ticker | Number of Shares | Weight | Value now | Open Date | Open Costs | Rebal Costs | Return | Dividends Received | Gain to date | |
| (BBWI) | 602 | 11.08% | $31,840 | 02/28/22 | ($30,285) | ($1,257) | — | $299 | |
| (CHTR) | 56 | 8.35% | $23,995 | 04/18/22 | ($30,231) | — | — | ($6,235) | |
| (DHR) | 110 | 9.61% | $27,624 | 04/04/22 | ($31,931) | — | — | ($4,307) | |
| (INCY) | 361 | 9.42% | $27,061 | 02/28/22 | ($30,799) | $7,377 | — | $3,639 | |
| (MCO) | 87 | 9.58% | $27,534 | 04/11/22 | ($29,208) | — | — | ($1,674) | |
| (MSFT) | 111 | 10.72% | $30,805 | 04/18/22 | ($31,162) | — | — | ($357) | |
| (MU) | 445 | 10.56% | $30,345 | 04/18/22 | ($31,676) | — | — | ($1,332) | |
| (QCOM) | 218 | 10.60% | $30,452 | 08/02/21 | ($32,635) | $2,794 | $423 | $1,035 | |
| (TDG) | 46 | 9.52% | $27,361 | 03/21/22 | ($30,118) | — | — | ($2,757) | |
| (V) | 140 | 10.38% | $29,838 | 12/07/20 | ($30,865) | $1,269 | $255 | $498 | |
Holdings for iM-Top50 (of 40 Large Hedge Funds) as of 4/29/2022
| Current Portfolio 4/29/2022 | Cash Flow | ||||||||
| Ticker | Number of Shares | Weight | Value now | Open Date | Open Costs | Rebal Costs | Return | Dividends Received | Gain to date | |
| (AAPL) | 22 | 1.74% | $3,468 | 01/04/16 | ($2,109) | $5,187 | $259 | $6,805 | |
| (ADBE) | 10 | 1.99% | $3,960 | 01/04/16 | ($2,118) | $2,765 | — | $4,607 | |
| (ALGN) | 10 | 1.45% | $2,899 | 11/22/21 | ($6,726) | — | — | ($3,827) | |
| (AMT) | 18 | 2.18% | $4,338 | 01/04/16 | ($2,033) | $731 | $461 | $3,498 | |
| (AMZN) | 2 | 2.49% | $4,971 | 01/04/16 | ($1,913) | $2,037 | — | $5,096 | |
| (ANTM) | 10 | 2.52% | $5,019 | 02/28/22 | ($4,503) | — | $13 | $529 | |
| (APP) | 91 | 1.74% | $3,472 | 08/23/21 | ($6,110) | $452 | — | ($2,186) | |
| (BBWI) | 85 | 2.25% | $4,496 | 02/28/22 | ($4,533) | — | — | ($37) | |
| (BSX) | 87 | 1.84% | $3,664 | 02/24/20 | ($3,949) | $700 | — | $415 | |
| (CHTR) | 8.1 | 1.75% | $3,487 | 01/04/16 | ($2,133) | $869 | — | $2,223 | |
| (COUP) | 37 | 1.60% | $3,193 | 08/19/19 | ($3,549) | ($1,823) | — | ($2,179) | |
| (CRM) | 21 | 1.85% | $3,695 | 05/22/17 | ($2,315) | $806 | — | $2,186 | |
| (CRWD) | 28 | 2.79% | $5,565 | 05/26/20 | ($4,210) | $4,306 | — | $5,661 | |
| (DASH) | 52 | 2.12% | $4,234 | 05/24/21 | ($5,623) | ($281) | — | ($1,669) | |
| (DHR) | 20 | 2.52% | $5,023 | 08/19/19 | ($3,547) | $1,596 | $50 | $3,123 | |
| (DIS) | 35 | 1.96% | $3,907 | 08/24/20 | ($5,102) | $902 | — | ($293) | |
| (DOCU) | 43 | 1.75% | $3,483 | 08/24/20 | ($5,118) | ($2,553) | — | ($4,188) | |
| (FATE) | 120 | 1.72% | $3,427 | 02/16/21 | ($6,499) | ($3,271) | — | ($6,343) | |
| (FB) | 20 | 2.01% | $4,009 | 01/04/16 | ($2,047) | ($191) | — | $1,772 | |
| (FIS) | 50 | 2.49% | $4,958 | 08/19/19 | ($3,476) | ($3,323) | $147 | ($1,695) | |
| (FISV) | 56 | 2.75% | $5,484 | 11/18/19 | ($3,209) | ($2,989) | — | ($715) | |
| (GOOGL) | 3 | 3.43% | $6,847 | 01/04/16 | ($2,281) | — | — | $4,566 | |
| (INCY) | 67 | 2.52% | $5,022 | 02/28/22 | ($4,566) | — | — | $456 | |
| (INTU) | 12 | 2.52% | $5,025 | 02/19/19 | ($3,523) | $1,654 | $106 | $3,261 | |
| (KMX) | 47 | 2.02% | $4,032 | 05/24/21 | ($5,377) | — | — | ($1,345) | |
| (MA) | 16 | 2.92% | $5,814 | 01/04/16 | ($2,088) | $1,075 | $139 | $4,940 | |
| (MCO) | 17 | 2.70% | $5,380 | 01/04/16 | ($2,044) | $1,364 | $239 | $4,939 | |
| (MSFT) | 20 | 2.78% | $5,550 | 01/04/16 | ($2,085) | $2,753 | $347 | $6,565 | |
| (MTCH) | 41 | 1.63% | $3,245 | 02/28/22 | ($4,589) | — | — | ($1,344) | |
| (MU) | 51 | 1.74% | $3,478 | 02/28/22 | ($4,527) | — | $5 | ($1,044) | |
| (NFLX) | 11 | 1.05% | $2,094 | 01/04/16 | ($2,092) | $1,762 | — | $1,764 | |
| (NOW) | 7 | 1.68% | $3,347 | 11/19/18 | ($2,825) | $3,684 | — | $4,206 | |
| (NVDA) | 20 | 1.86% | $3,709 | 02/24/20 | ($3,830) | $7,494 | $15 | $7,388 | |
| (PYPL) | 34 | 1.50% | $2,990 | 02/21/17 | ($2,209) | $2,142 | — | $2,922 | |
| (QCOM) | 30 | 2.10% | $4,191 | 08/24/20 | ($5,106) | $2,448 | $197 | $1,730 | |
| (RIVN) | 104 | 1.58% | $3,145 | 02/28/22 | ($4,854) | ($1,446) | — | ($3,155) | |
| (SCHW) | 54 | 1.80% | $3,582 | 02/28/22 | ($4,555) | — | — | ($974) | |
| (SGEN) | 33 | 2.17% | $4,323 | 01/04/16 | ($2,099) | $1,661 | — | $3,886 | |
| (SHOP) | 7 | 1.50% | $2,988 | 11/18/19 | ($3,233) | $2,545 | — | $2,300 | |
| (SNAP) | 130 | 1.86% | $3,700 | 11/22/21 | ($6,427) | — | — | ($2,727) | |
| (SNOW) | 17 | 1.46% | $2,914 | 02/16/21 | ($6,487) | $1,820 | — | ($1,752) | |
| (TDG) | 6 | 1.79% | $3,569 | 01/04/16 | ($2,071) | $2,710 | $912 | $5,120 | |
| (TSLA) | 6 | 2.62% | $5,225 | 05/26/20 | ($4,098) | $10,984 | — | $12,110 | |
| (TSM) | 36 | 1.68% | $3,345 | 11/22/21 | ($6,768) | $2,419 | $44 | ($960) | |
| (UNH) | 9 | 2.30% | $4,577 | 05/22/17 | ($2,274) | $2,953 | $303 | $5,559 | |
| (V) | 26 | 2.78% | $5,541 | 01/04/16 | ($2,046) | $25 | $156 | $3,676 | |
| (W) | 43 | 1.66% | $3,308 | 11/23/20 | ($5,390) | ($2,894) | — | ($4,975) | |
| (WDAY) | 20 | 2.07% | $4,134 | 05/26/20 | ($4,213) | $1,141 | — | $1,062 | |
Appendix A
Hedge Fund Filers:
- Akre Capital Management LLC
- Alkeon Capital Management LLC
- Altimeter Capital Management, LP
- Aristotle Capital Management, LLC
- Baker Bros. Advisors LP
- Barings LLC
- Calamos Advisors LLC
- Capital International Ltd
- Citadel Advisors LLC
- Coatue Management LLC
- D. E. Shaw & Company, Inc.
- Disciplined Growth Investors Inc
- DSM Capital Partners LLC
- Echo Street Capital Management LLC
- FMR LLC
- Fort Washington Investment Advisors Inc
- GW&K Investment Management, LLC
- Hitchwood Capital Management LP
- Jennison Associates LLC
- King Luther Capital Management Corp
- Kohlberg Kravis Roberts & Company LP
- Lone Pine Capital LLC
- Loomis Sayles & Company LP
- Matrix Capital Management Company, LP
- Meritage Group LP
- Panagora Asset Management Inc
- Perceptive Advisors LLC
- Pinebridge Investments, LP
- Redmile Group, LLC
- Renaissance Technologies LLC
- Riverbridge Partners LLC
- Ruane, Cunniff & Goldfarb LP
- Steadfast Capital Management LP
- TCI Fund Management Ltd
- Tiger Global Management LLC
- Verition Fund Management LLC
- Viking Global Investors LP
- Westfield Capital Management Company LP
- Whale Rock Capital Management LLC
- Winslow Capital Management, LLC
This article was written by
Disclosure: I/we have no stock, option or similar derivative position in any of the companies mentioned, and no plans to initiate any such positions within the next 72 hours. I wrote this article myself, and it expresses my own opinions. I am not receiving compensation for it. I have no business relationship with any company whose stock is mentioned in this article.