BCAT: Deep Discount And Attractive 7.83% Distribution Yield
Summary
- BCAT's discount continues to widen, this time coming in around 16%.
- The fund is tilted towards fixed income and hasn't escaped the downward pressures with losses for the year.
- The NAV itself is still holding up relatively well, thanks to its more diversified approach.
- This idea was discussed in more depth with members of my private investing community, CEF/ETF Income Laboratory. Learn More »
PM Images/DigitalVision via Getty Images
Written by Nick Ackerman, co-produced by Stanford Chemist. This article was originally published to members of the CEF/ETF Income Laboratory on April 16th, 2022.
BlackRock Capital Allocation Trust (NYSE:BCAT) continues to be avoided by investors. The discount has widened out significantly, more than doubling since the last time we've covered the fund. The NAV has been holding up relatively well as the share price slides deeper.
The fund launched towards the end of 2020. It captured the rebound of the overall market that most investments were experiencing. For that reason, the fund started off fairly strong. Now that most investments have been under pressure - especially bonds and growth stocks - BCAT has struggled over the last six months.
If one believes this overall market struggle will continue, then BCAT might not be a great fit for them. However, for a longer-term investor, the discount is quite compelling at this time. It is a bit hard to believe that at one time, this fund was trading at a premium.
The Basics
- 1-Year Z-score: -2.07
- Discount: -16.01%
- Distribution Yield: 7.83%
- Expense Ratio: 1.54%
- Leverage: 17.99%
- Managed Assets: $2.12 billion
- Structure: Term (anticipated liquidation date of September 25th, 2032)
BCAT's investment objective is "to provide total return and income through a combination of current income, current gains and long-term capital appreciation."
To meet their objective, they simply "invest in a portfolio of equity and debt securities." They add a bit more color with, "the Trust may emphasize either debt securities or equity securities." Along with this, they will "utilize an option writing strategy in an effort to generate gains from options premiums and to enhance the Trust's risk-adjusted returns."
BCAT is a genuine multi-asset approach offering from BLK. Currently, the percentage of the portfolio overwritten is 10.59%. This is only up marginally from our previous update at the end of November.
The fund is quite large, and some of that is thanks to the around 18% leverage that the fund utilizes. Generally, BlackRock doesn't utilize leverage on its equity funds. It is primarily an options writing strategy only. Since fixed-income is the largest allocation, they must feel better about doing so in this fund.
The fund's expense ratio comes to 1.54%. That includes an "acquired fund fees and expenses" of 0.02%. This comes from ETFs the fund carries in the fund, which is a rather small allocation at this time. The expense ratio comes to 1.63% when factoring in the interest expense.
BCAT Fee Breakdown (BlackRock)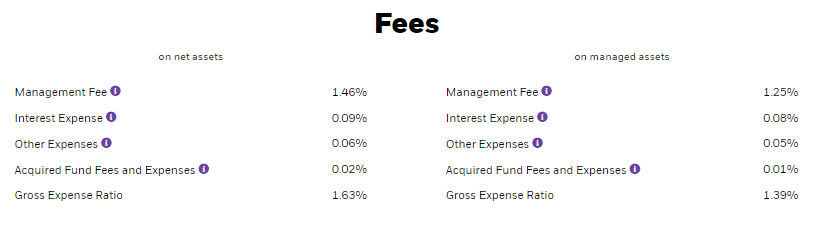
Performance - Struggling In 2022
I think that BCAT has several things working against it through 2022, and really it has been most of the last six months as well. The first is the significant allocation to fixed income assets. The breakdown at the end of March 2022 had fixed income at 57.57% and equity positions at 44.91%.
As interest rates are rising, this puts direct pressure on these interest-rate-sensitive investments. This is especially true for the portion of their fixed income that is allocated to investment-grade quality. These tend to be even more sensitive to interest rate changes as long-duration assets.
The other issue is the tilt towards technology stocks in the fund's equity sleeve. These have also been labeled as longer-duration assets. Even though long duration generally refers to fixed-income investments. The idea is that investors want to invest in things with cash flow now, not what could come in the future.
That's resulted in what we see on a YTD basis for 2022's performance. For some further context, I've added several different ETFs that are relevant for BCAT.
Ycharts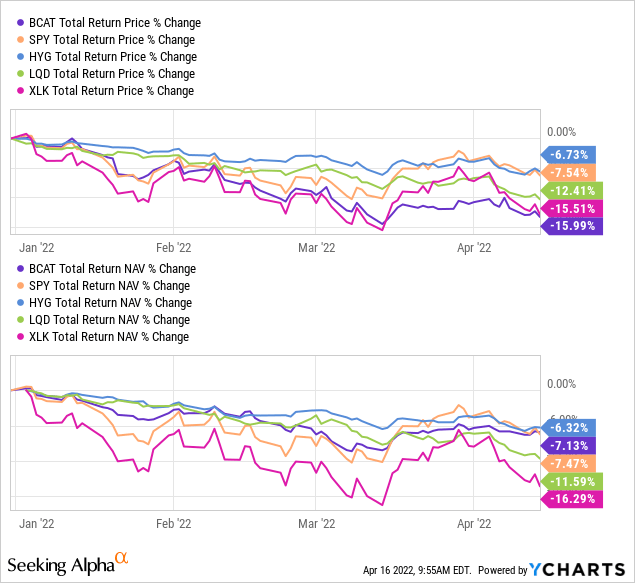
I have included the SPDR S&P 500 (SPY) as a general gauge of where the market performance is for the year. I have also included the iShares iBoxx High Yield Corporate Bond ETF (HYG) - which came out as the top performer so far. After that, I have included the iShares iBoxx Investment Grade Corporate Bond ETF (LQD). LQD represents bonds that are of higher quality, as mentioned above, are getting hit particularly hard. Finally, we have the SPDR Technology Sector (XLK) to represent how tech has been doing. As we can see, XLK has come in at the bottom as the worst performer.
Especially noteworthy is that on a total share price basis, BCAT has been the worst. On a total NAV return basis, BCAT is coming in barely worse than HYG.
If we go back to since the fund's inception, we see that the NAV is still positive on a total return basis. That would be including the distributions the fund has been paying out. It has really been the share price that has been getting hammered for the most part.
Ycharts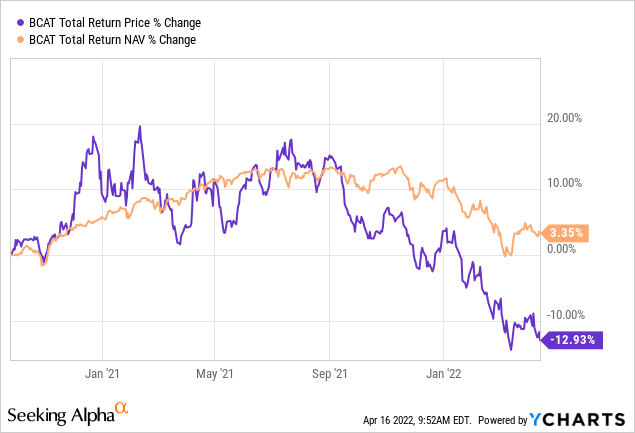
That is exactly what has led to the ~16% discount we are seeing today. It is also why we have seen the discount widen significantly on a YTD basis, as we highlighted above.
Ychart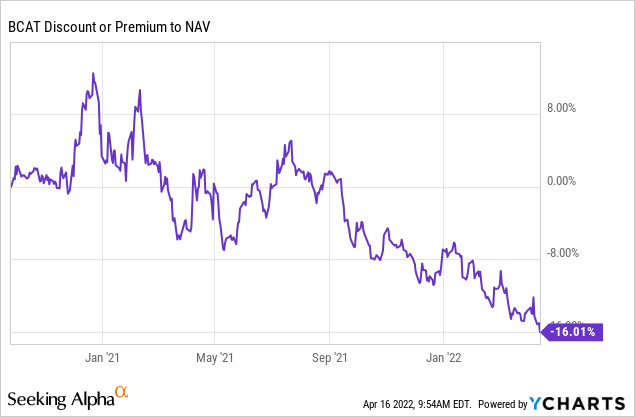
Distribution - Solid 7.83% Yield
At this time, the fund has continued to maintain the same distribution that tit has been paying investors. This could turn into an incredibly poor call on my end, but I don't see the distribution being cut. I think that when they launch these CEFs, they put it at a payout where there is some downside protection. If we go back to BCAT's NAV once again, it comes in at $18.55. So around a dollar and a half since the fund's launch
I believe that is a more important factor for determining if a CEF management is going to continue paying out the same distribution or not - and not what the actual share price is doing. I think it is also noteworthy to include that historically, BlackRock has been a fund sponsor that has held on to paying the same distribution for longer. Meaning that they aren't as quick to cut the payouts to investors.
So, for now, at a NAV yield of 6.65%, I don't see a need to cut.
BCAT Distribution History (CEFConnect)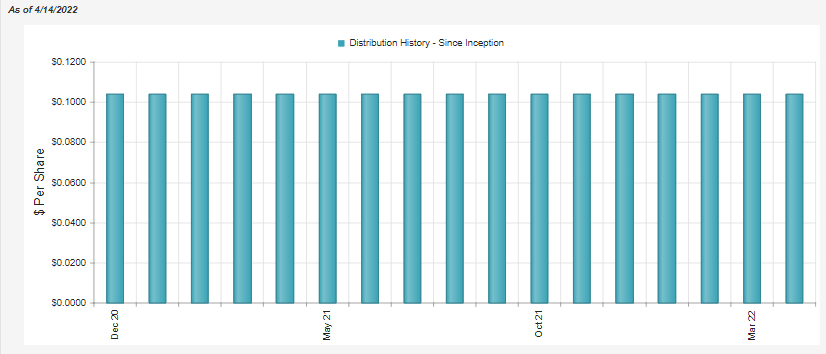
To cover the distribution to shareholders will require some sizeable capital gains to come to fruition eventually. Either that, or there will be destructive return of capital. The reason for this is that the net investment income coverage comes in at ~43%. Unfortunately, that's not even a level indicating that the fixed-income sleeve is covering itself.
BCAT Annual Report (BlackRock)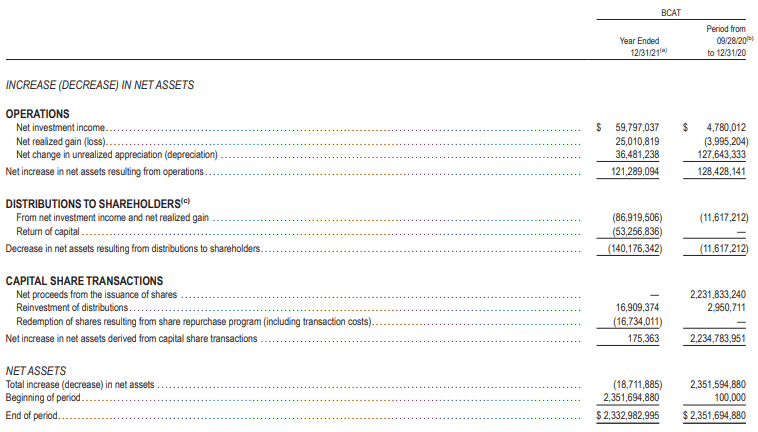
With this report, we can also see that even if we add up the NII, realized gains and unrealized gains; it still came in short for fiscal 2021. This makes sense because towards the end of the year is when bonds and tech stocks really began to get hit.
That has translated into some destructive return of capital being utilized to pay out shareholders. I believe that's probably at least one of the reasons for the deep discount. At a certain point, though, a discount still becomes quite tempting.
BCAT Annual Report (BlackRock)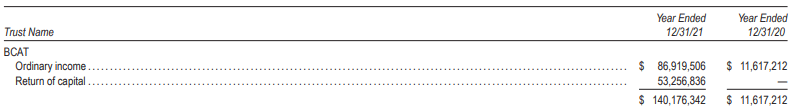
BCAT's Portfolio
Looking at the portfolio, we can see that as of March 31st, 2022, fixed-income was still the largest allocation of the fund.
BCAT Asset Allocation (BlackRock)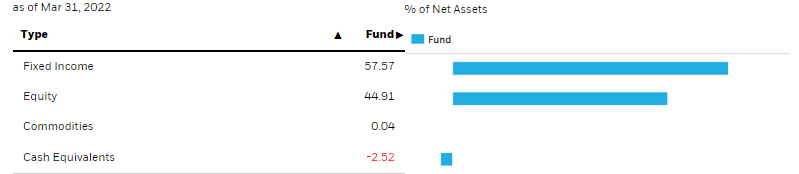
This was the case at the end of October 2021, when fixed income was the largest allocation too. In looking at the credit quality, it hasn't changed up materially since our previous update either. However, note that the below was reported at the end of January 31st, 2022. That's two months prior to the update they provided for their asset allocation.
BCAT Credit Quality (BlackRock)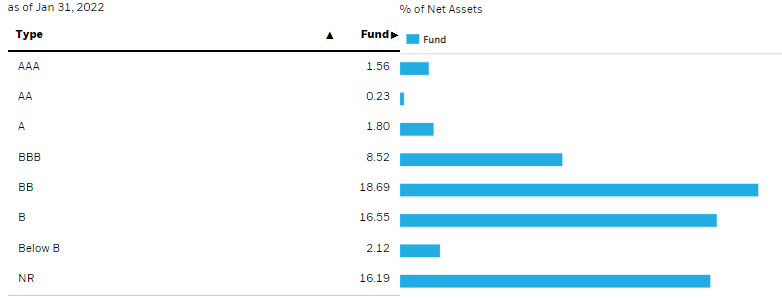
Investment-grade weightings come in at 12.11% of the fund. That was similar to the 12.31% weighting previously. The largest allocation still comes in at the BB rating, which is the first notch into below-investment-grade quality.
One weighting that had a fairly notable increase was those that are "not rated."
Taking a look at the top ten credit holdings, we see quite the mixture. We have foreign government holdings, U.S. Treasury holdings and private debt holdings as well.
BCAT Top Ten Fixed Income (BlackRock)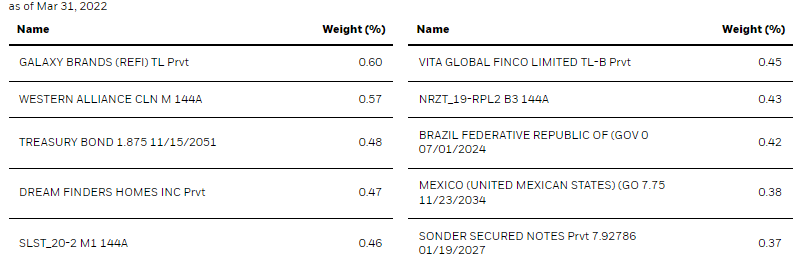
All this being said, the effective duration they have provided is 0.53 years. That would suggest the sensitivity of their fixed-income sleeve is fairly low. However, we haven't seen that play out as the NAV has been sliding this year.
Moving on to the equity side of the equation, we see that tech still remains the top sector weighting. However, the fund is still fairly diversified overall. There isn't a significant overweighting in any one sector.
BCAT Sector Weighting (BlackRock)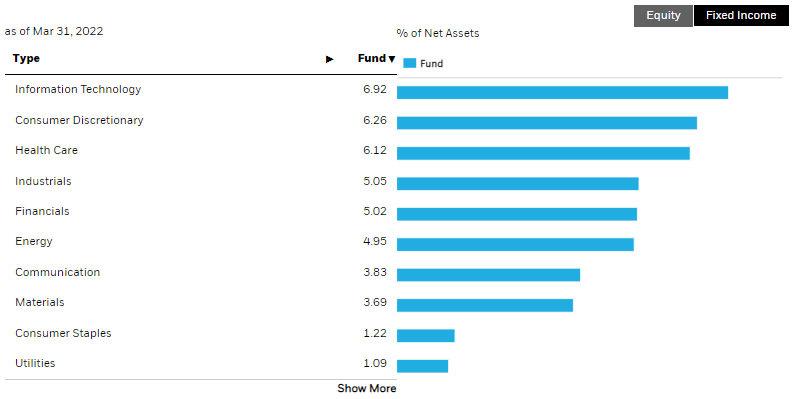
For the top ten equity positions, we see several familiar names. These are the mega-cap tech names that dominate most CEFs.
BCAT Top Ten (BlackRock)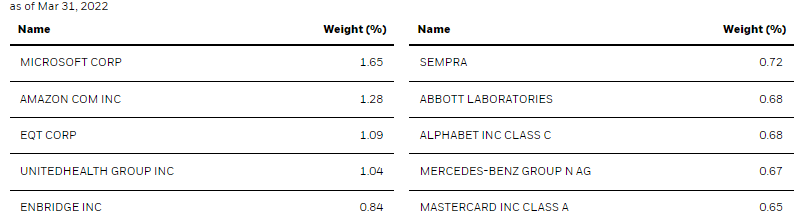
These are Microsoft (MSFT), Amazon (AMZN) and Alphabet (GOOG),(GOOGL). These three stocks haven't escaped the downward pressure. Below is the YTD price performance of each of these three.
Ycharts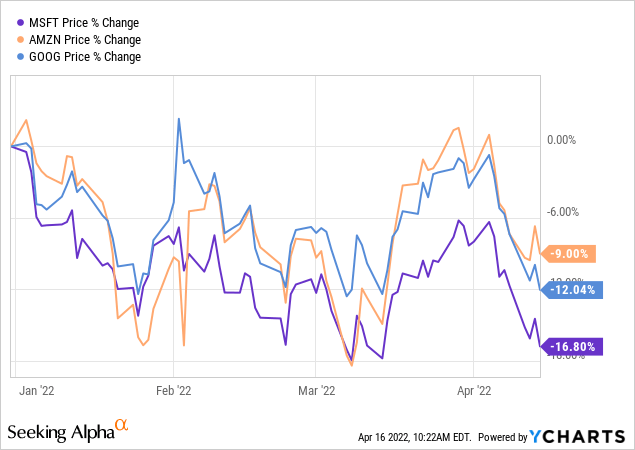
That being said, these aren't the only holdings in the top ten that have contributed negatively to the performance. Below is the performance of the other seven top ten holdings on a YTD basis, price-performance only. We can see that Mastercard (MA) and Mercedes-Benz (OTCPK:DDAIF) have been having fairly meaningful struggles through 2022 so far. DDAIF trades on the pink sheets, and that can add some additional risks for investors to be conscious of.
Ycharts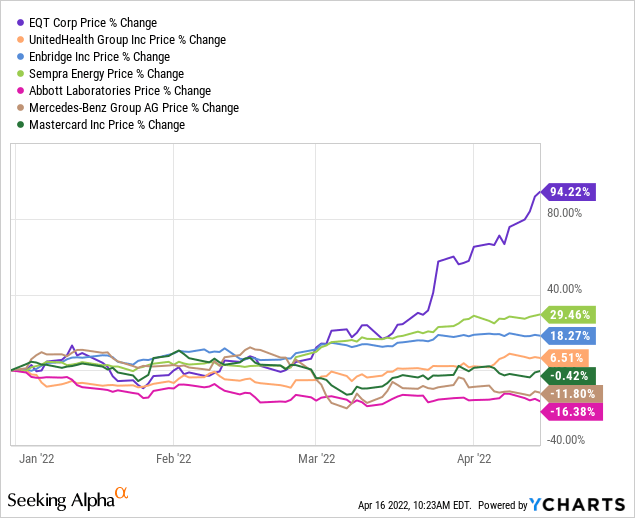
We then have EQT Corp (EQT), Sempra (SRE) and Enbridge (ENB) leading the way higher. EQT is on a substantial rally. Unsurprisingly, EQT is an energy play as a natural gas production company. As prices for natural gas and crude oil have been rushing higher, EQT has benefitted significantly. For BCAT, energy is a fairly small contributor. So that hasn't had a significant impact, but it certainly doesn't hurt either.
Conclusion
BCAT continues its slide into discount territory. While I'm not one to invest in fixed-income too significantly, the valuation of BCAT is definitely grabbing my attention. The fund is highly diversified, so it could make it a great fit for an investor if they only hold a few funds. It can make it a great fit even if you are diversified already, as it shouldn't disrupt one's portfolio in terms of weightings.
I could even see an investor making a case if they wanted to hold only BCAT in their portfolio. After all, they list 827 holdings, and we have taken a look at all the weightings and know that it is spread out amongst assets and sectors. On the downside of this, we shouldn't expect spectacular performance either. This is a total stock market and total bond market fund combined. There are too many holdings for the fund to outperform. At the same time, the chance is still presented to outperform other hybrid funds here is the fund's current discount.
Profitable CEF and ETF income and arbitrage ideas
 At the CEF/ETF Income Laboratory, we manage ~8%-yielding closed-end fund ((CEF)) and exchange-traded fund ((ETF)) portfolios to make income investing easy for you. Check out what our members have to say about our service.
To see all that our exclusive membership has to offer, sign up for a free trial by clicking on the button below!

This article was written by

---------------------------------------------------------------------------------------------------------------
I provide my work regularly to CEF/ETF Income Laboratory with articles that have an exclusivity period, this is noted in such articles. CEF/ETF Income Laboratory is a Marketplace Service provided by Stanford Chemist, right here on Seeking Alpha.
Feel free to follow me on StockTwits as well, if you are over there too!
Disclosure: I/we have a beneficial long position in the shares of MSFT, MA either through stock ownership, options, or other derivatives. I wrote this article myself, and it expresses my own opinions. I am not receiving compensation for it (other than from Seeking Alpha). I have no business relationship with any company whose stock is mentioned in this article.