XLE And VDE: Energy Is Still The Most Attractive Sector
Summary
- This is an updated coverage of an article we published on March 2nd, 2022.
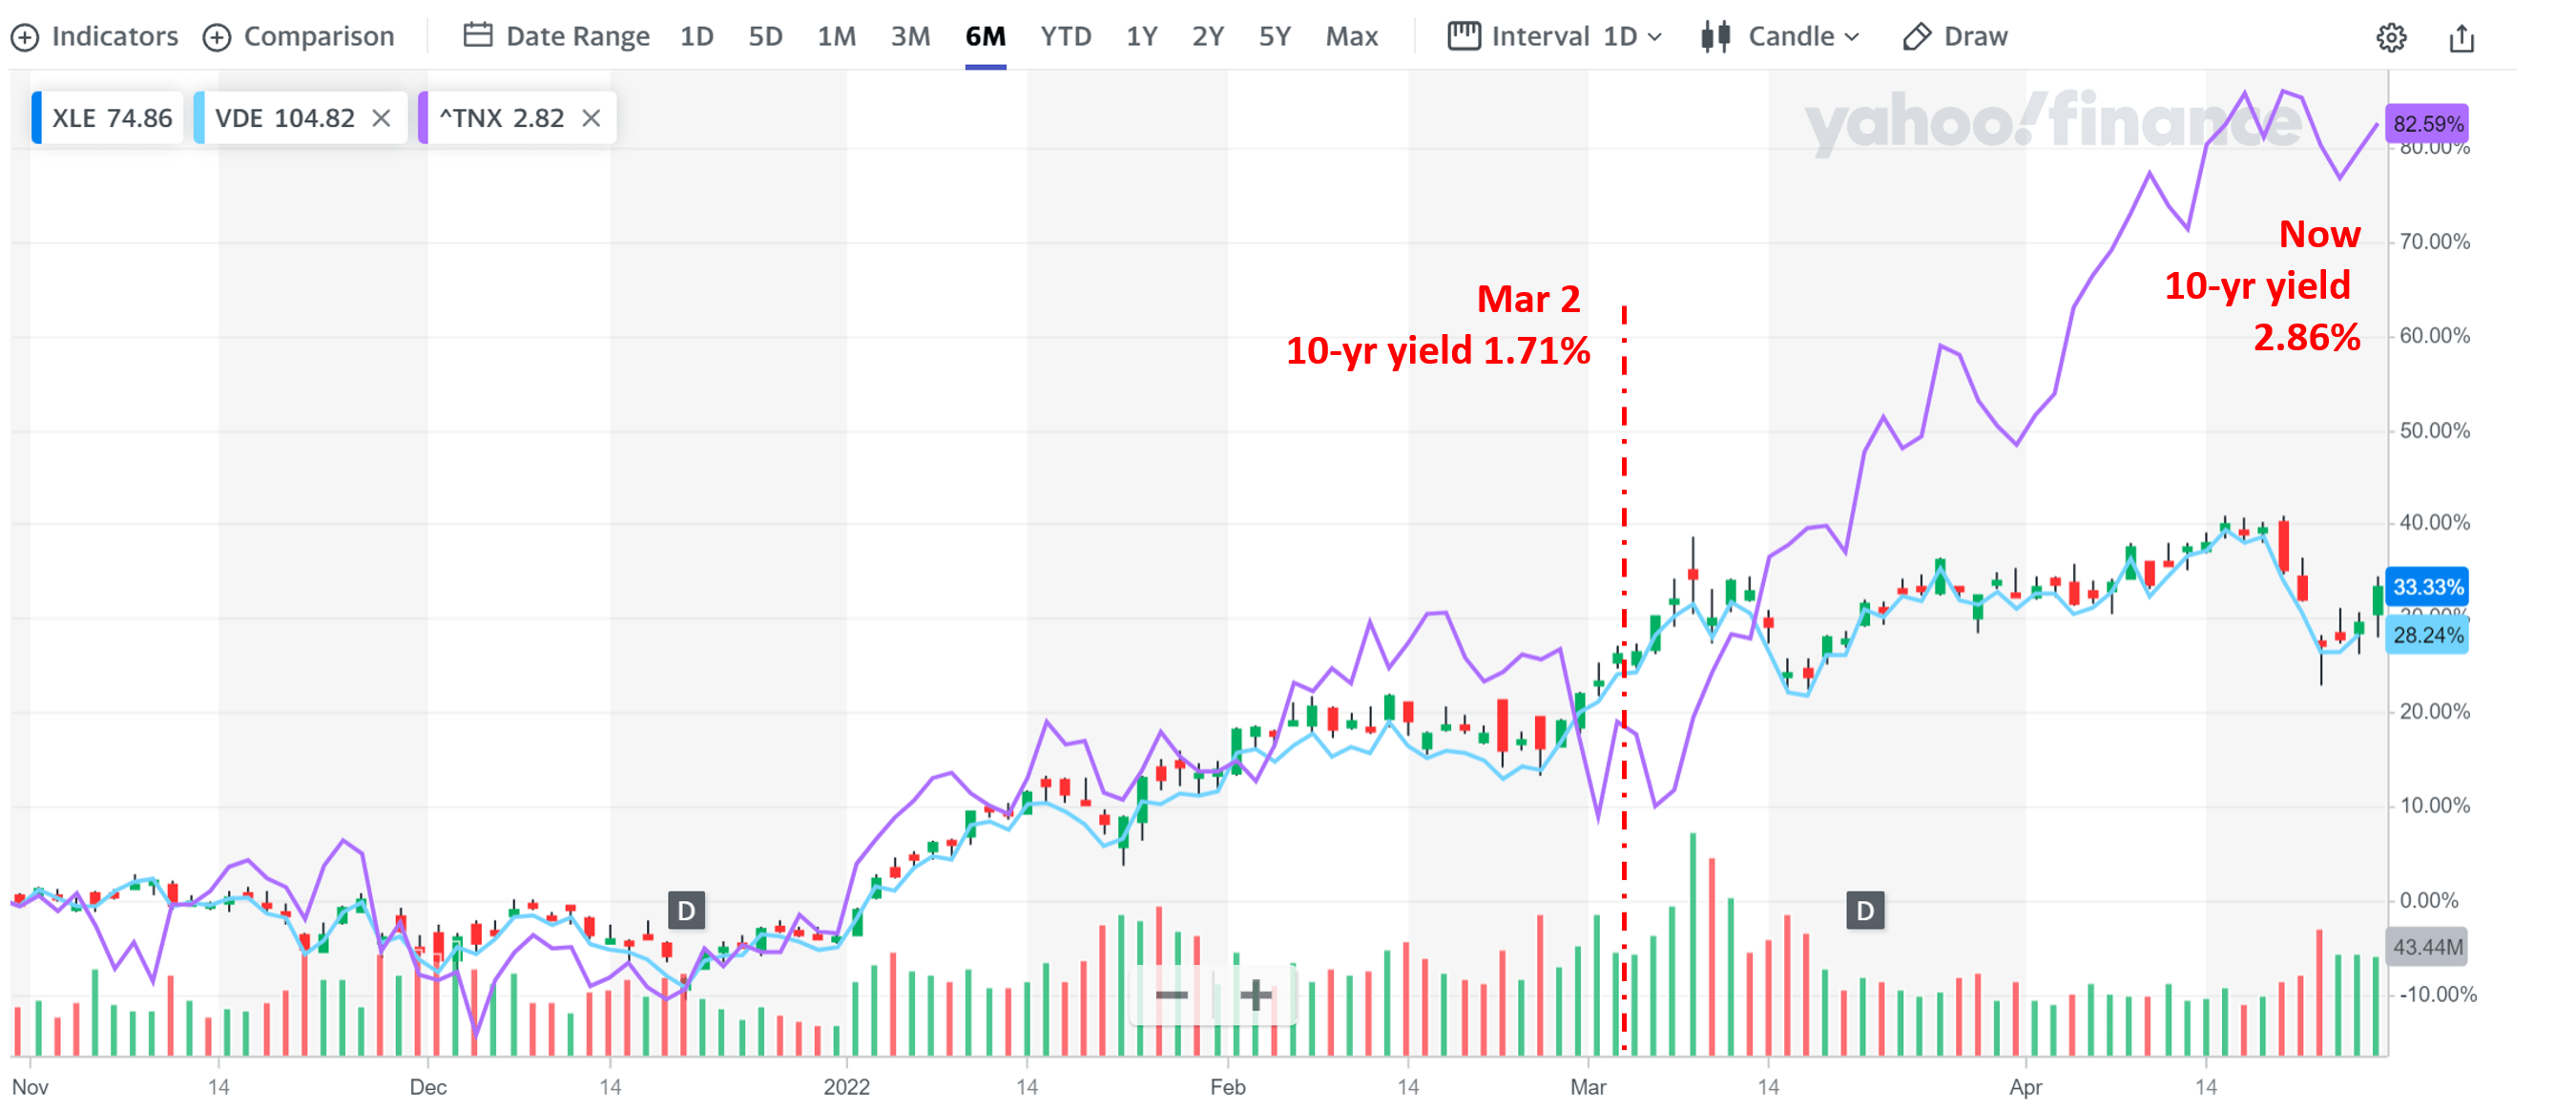
- The major update is to assess the risks caused by the surges in the 10-year treasury rates, which was only about 1.7% then and is now pushing toward 3%.
- The energy sector (represented by XLE and VDE) is currently the only sector that provides a positive yield spread Z-score relative to the risk-free rates, making it the most attractively valued sector.
- Also, our sector dashboard shows that the "safe" sectors such as utility and consumer staples are no longer "safe". The utility sector actually has the most negative YS Z-score currently.
- I do much more than just articles at Envision Early Retirement: Members get access to model portfolios, regular updates, a chat room, and more. Learn More »
Igor Borisenko/iStock via Getty Images
Thesis and Background
We first wrote about the energy sector represented by funds such as the Energy Select Sector SPDR (NYSEARCA:XLE) and the Vanguard Energy ETF (NYSEARCA:VDE) on Mar 2, 2022. The thesis then was that the yield spread between the energy sector and risk-free rates was at the most attractive level compared to other sectors. Indeed, since then, the energy sector has delivered about 7% of total return while the S&P 500 has lost more than 2%, creating an outperformance of nearly 9% as you can see from the chart below.
Some readers asked if the thesis needs to be updated or not given such a price movement and the surges in risk-free rates. This article will show that the energy sector is still the most attractively valued sector. Actually, it is currently the only sector that provides a positive yield spread Z-score as you will see next from our sector dashboard. At the same time, we think treasury yields are close to their long-term targets already. As such, our view is that the risks in the energy sector are quite moderate at this point.
Seeking Alpha Yahoo Finance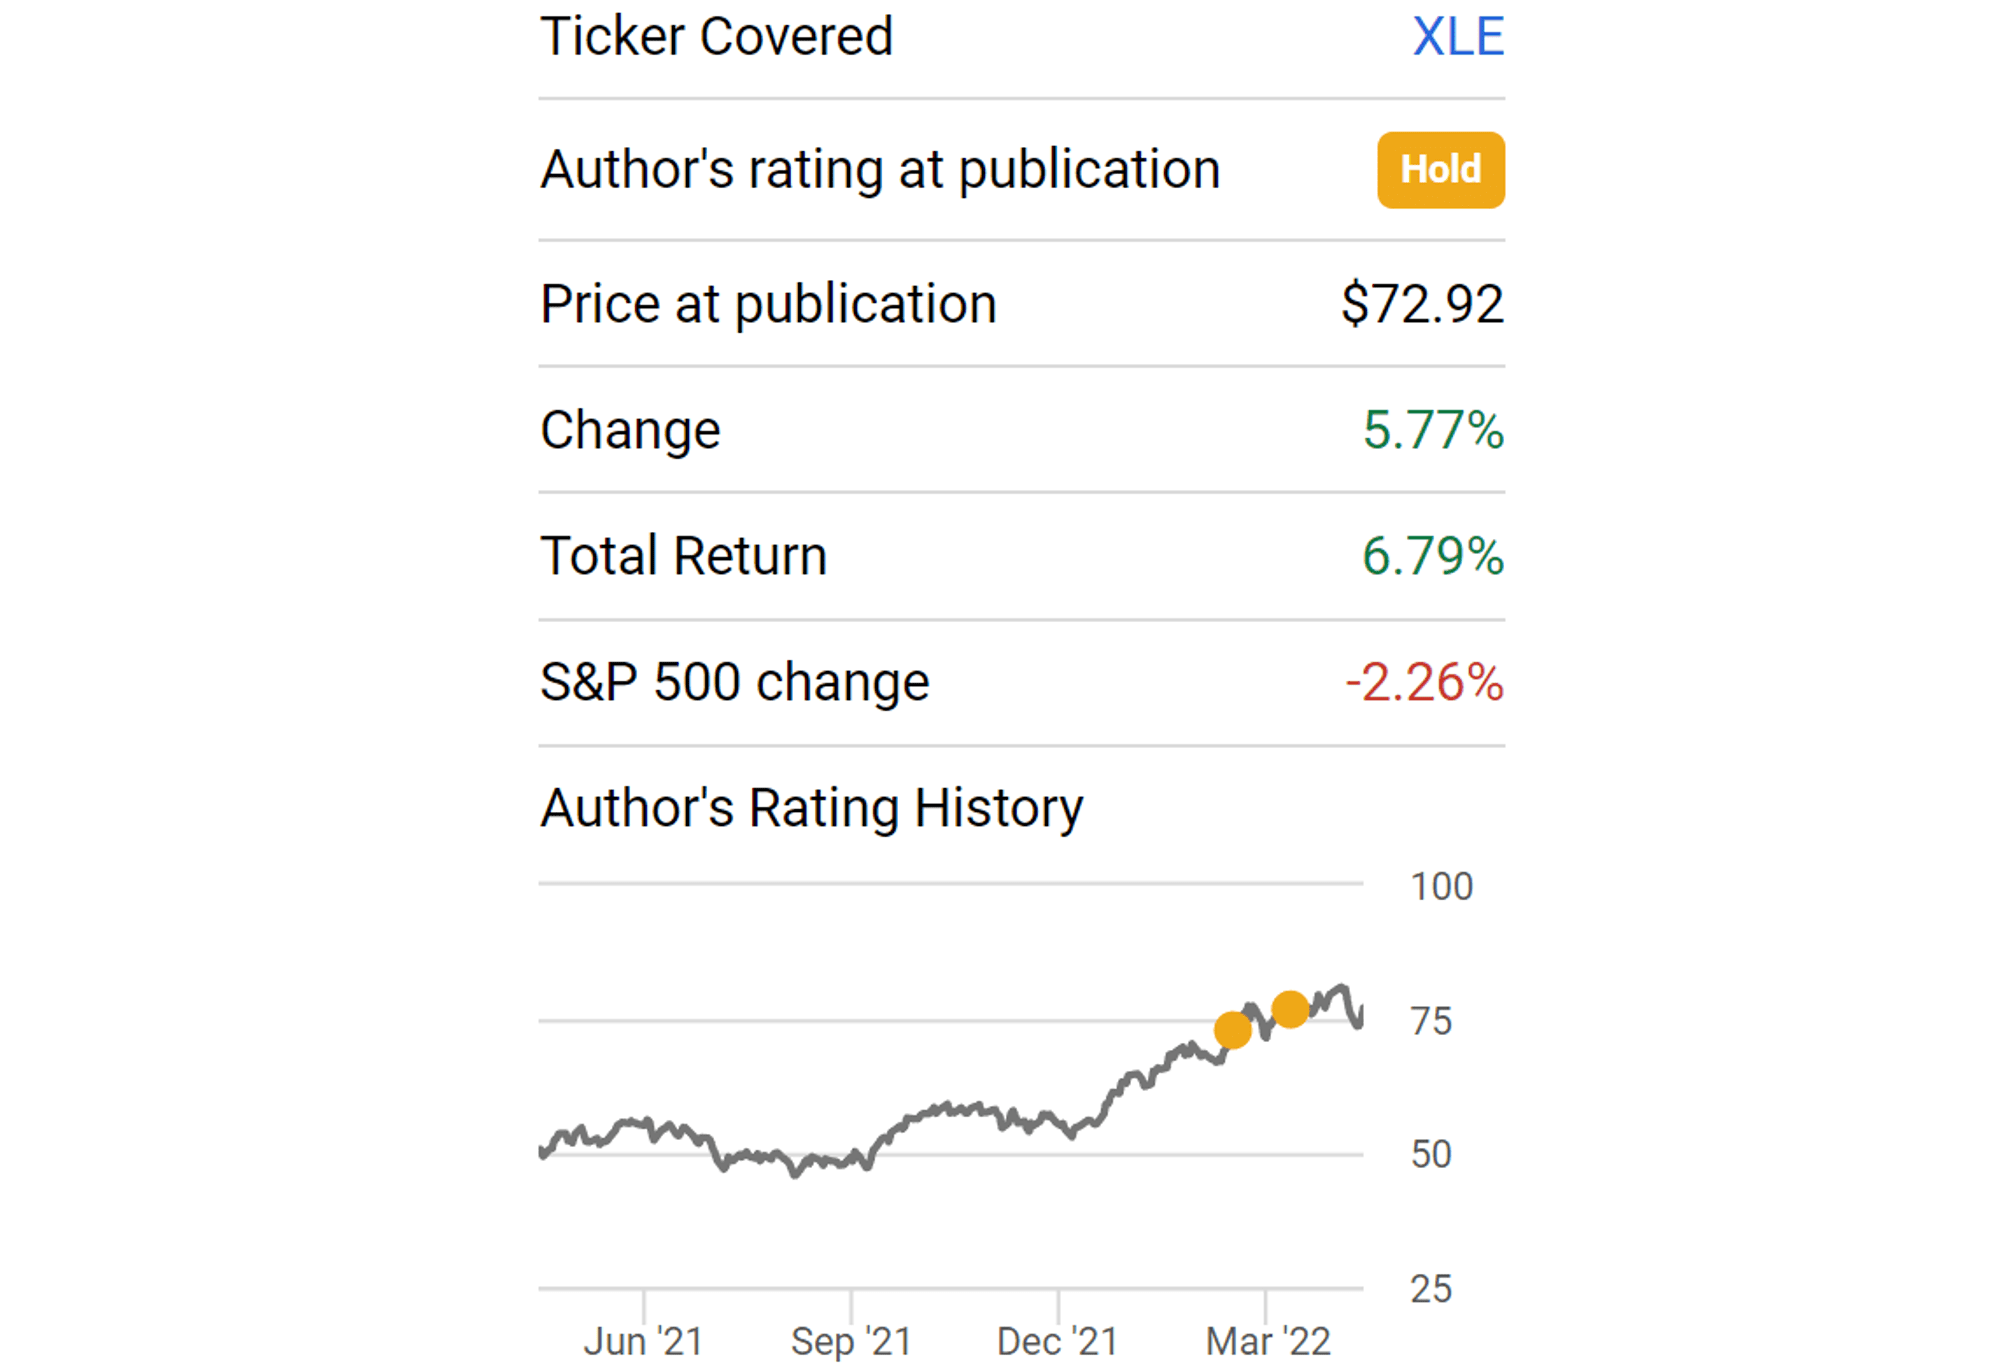
We use the following market sector dashboard to put our finger on the pulse of the market and its major sectors. Especially, the simple YS (yield spread, defined as the TTM dividend yield minus the 10-year treasury rates) is the first thing we look at. They give us a 30,000 feet view of where to look further - which sector, growth stocks, value stocks, bonds, or precious metals, et al. Feel free to download or export the google-sheet via the following link too: Market Sector Dashboard. Details of the mechanics of the dashboard are provided in our earlier article here.
A few highlights of the overall market and the Energy sector this month:
- Firstly, the results and dashboard apply to several of the popular Energy sectors ETFs, such as the Energy Select Sector SPDR, the Vanguard Energy ETF, and also the iShares U.S. Energy ETF (IYE). The reason is that these funds are quite similar and their valuation is closely correlated. As such, this article will present the results for XLE and VDE, but the results should be applicable for all similar funds.
- The yield spread between these Energy ETFs and the risk-free rates is currently above their historical level by a small margin, as reflected by a positive YS Z-score of 0.08. The rapid rise of treasury rates has made the yield from almost all market sectors funds unattractive with the exception of the energy sector and small caps as you can see.
- Finally, the conflict between Russia and Ukraine and also the persisting inflation both provide near-term support to XLE and VDE (and other energy sector funds too).
With the above overall discussion, we now move on to the specifics of the dashboard, XLE, and VDE.
Source: author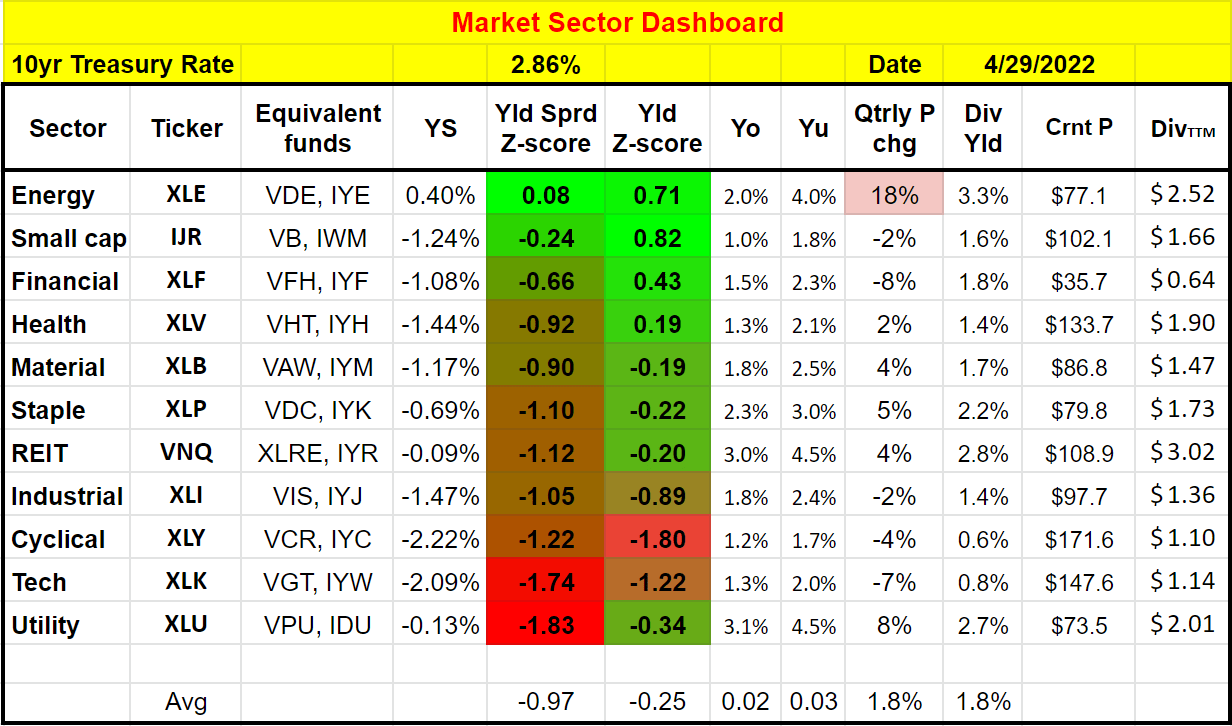
XLE and VDE: basic information
We assume most readers are familiar with XLE and VDE already. They are two of the most popular and largest energy sector ETF funds. Both charge a low expense ratio of 0.1%.
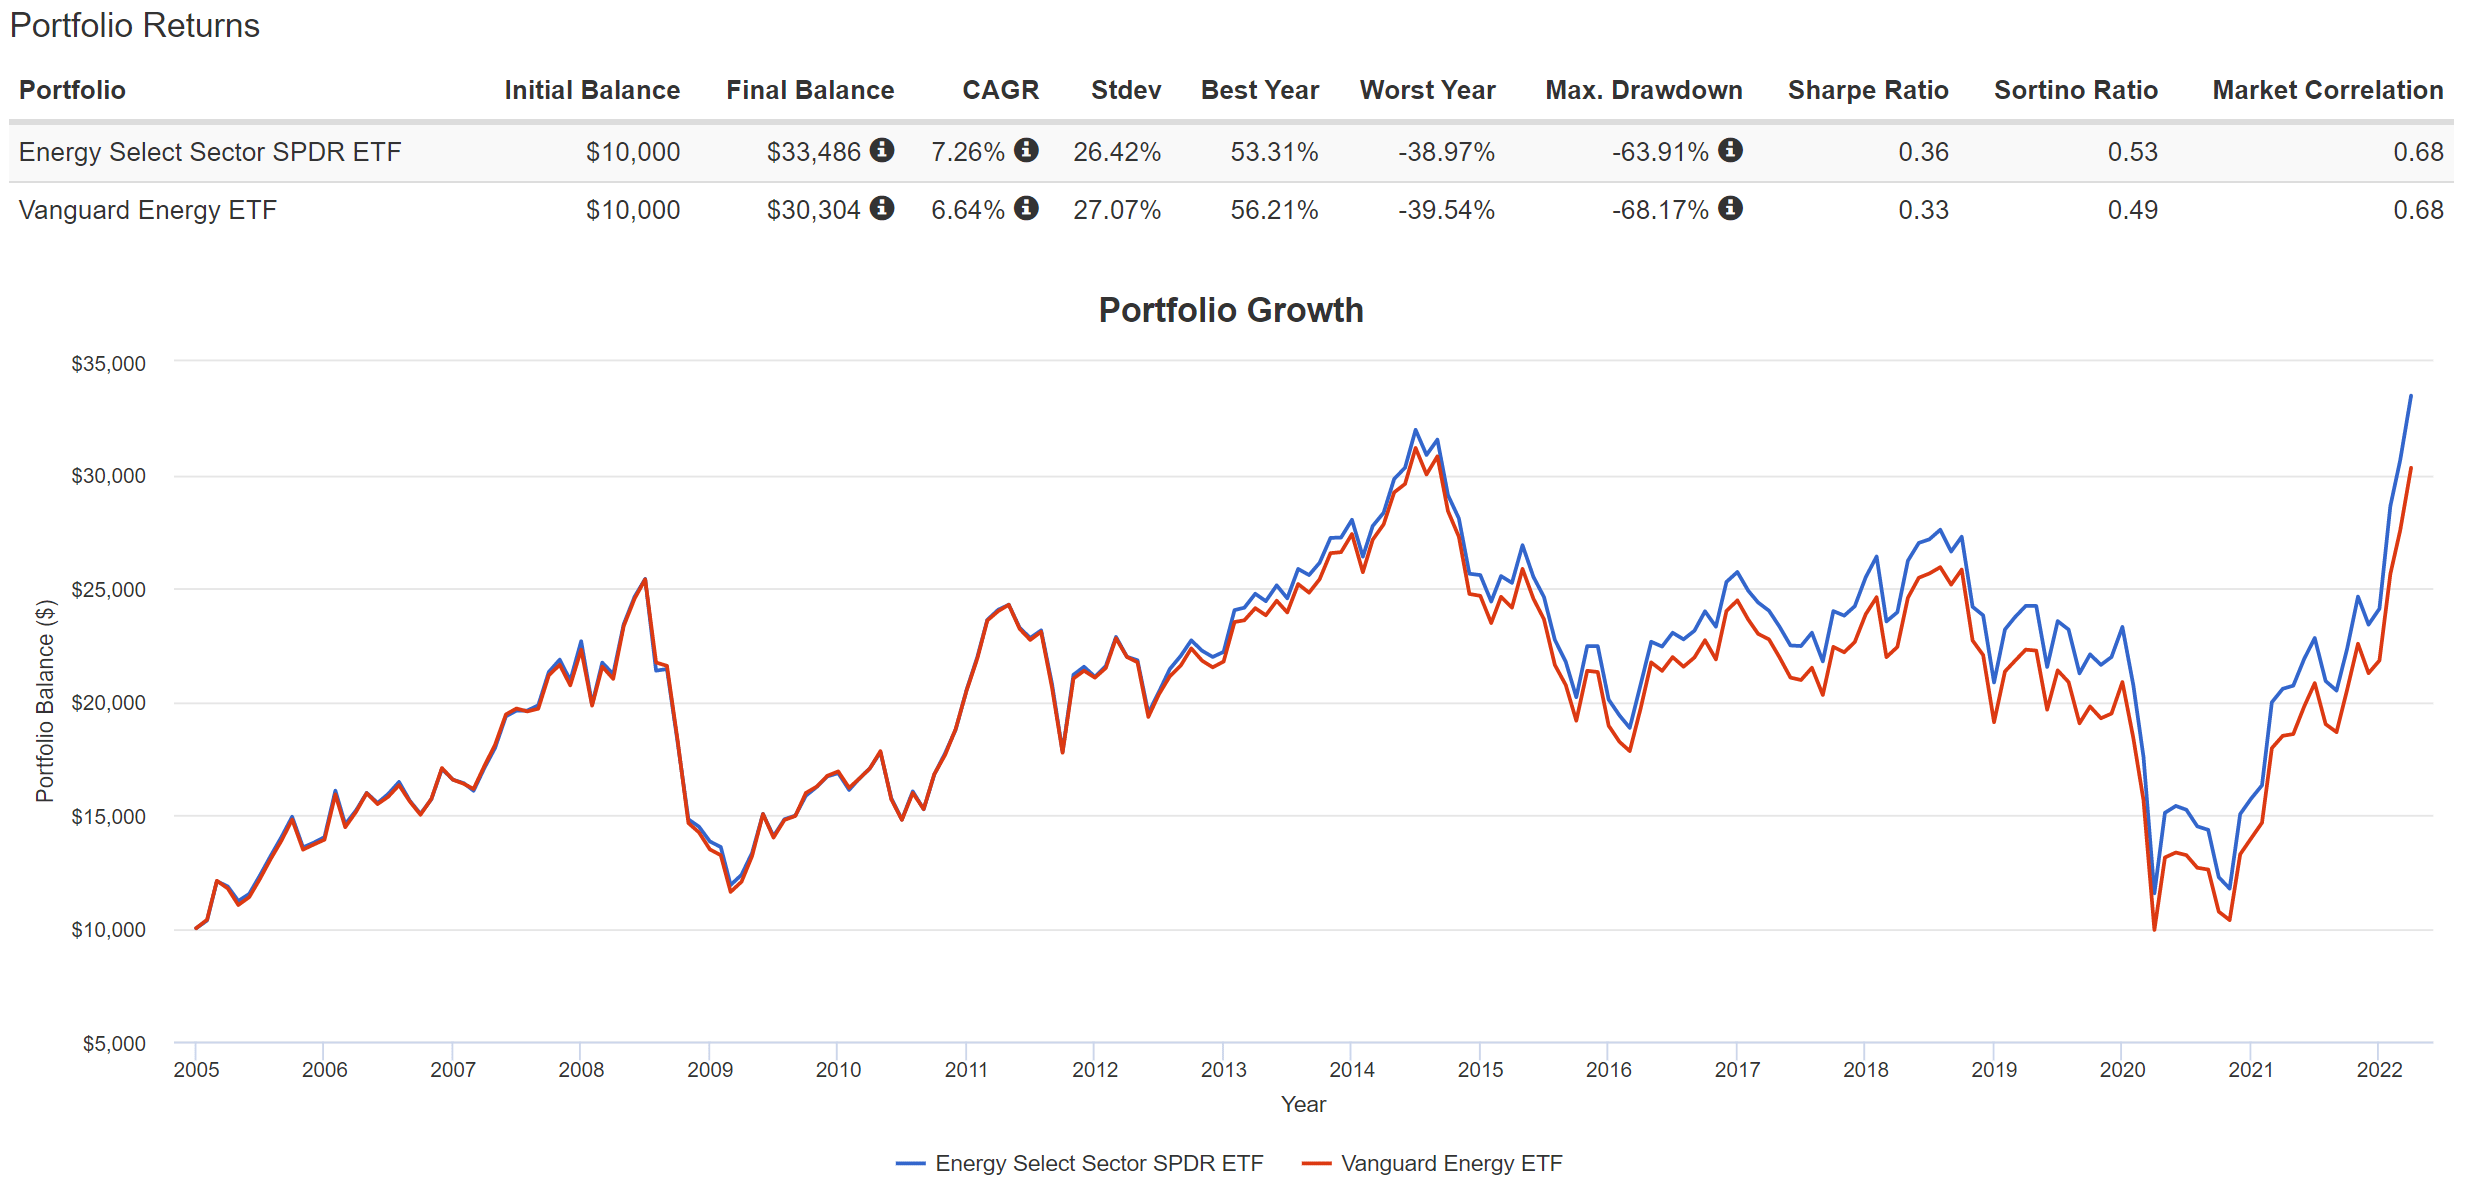
XLE holds a portfolio of 23 energy stocks (it follows the S&P Energy Select Sector Index) and VDE 103 stocks (it follows the MSCI US Investable Market Energy 25/50 Index). But don't be misled by the number of stocks. Both funds are quite concentrated and top-heavy. The top ten holdings represent almost 76% of XLE and almost 65% of VDE, and many of their large holdings are identical as to be elaborated on later. As a result, as you can see from the second chart below, both have delivered almost identical returns in the past with almost identical price volatilities and risks (in terms of standard deviation, worst year performance, maximum drawdowns, and correlation to the overall market).
Source: ETF.com Source: Portfoliovisualizer.com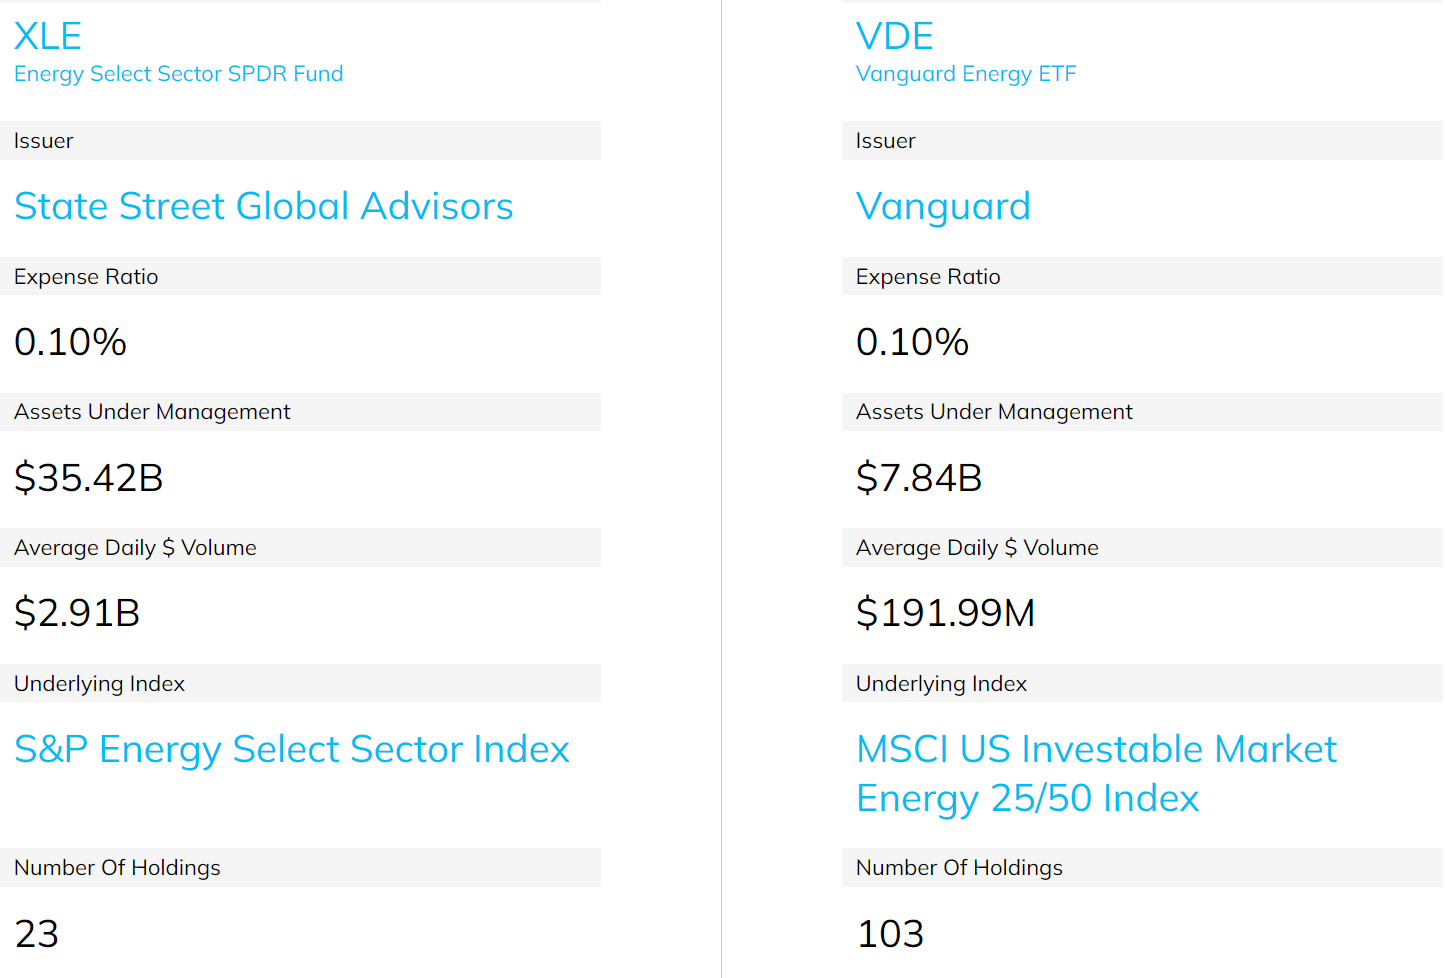
Yield spread and yield spread Z-score
For bond-like equities fund XLE and VDE, an effective way to evaluate their valuation with interest rates adjusted is to calculate the yield spread. Details of the calculation and application of the yield spread have been provided in our earlier article. The yield spread is an indicator we first check before we make investment decisions.
You will see below that when adjusted for interest rates, the current valuations are at a fair level (which makes it attractive relative to other sectors).
Take XLE as an example. The following chart shows the yield spread between XLE and the 10-year treasury. The dividend yield is calculated based on the TTM dividends. As can be seen, the spread is bounded and tractable most of the time. The spread has been in the range between about 1.75% and negative 1.0% the majority of the time during the past decade. Such a tractable YS suggests that when the spread is near or above 1.75%, XLE is significantly undervalued relative to the 10-year Treasury bond (i.e., I would sell treasury bonds and buy XLE). In another word, sellers of XLE are willing to sell it (essentially an equity bond with growth built-in) to me at a yield that is 1.75% above the risk-free yield. So it is a good bargain for me. And vice versa.
You can see the screaming signal in 2020 when the yield spread surged to ~8%+ level - and this is why this dashboard is the first thing we look at when we make our investment decisions.
As of this writing, the yield spread is about 0.4% as you can see. It is a level that is close to the historical average (actually slightly above it as reflected by a small positive YS Z-score of 0.08), signaling a moderate valuation risk relative to risk-free rates.
Author based on Seeking Alpha data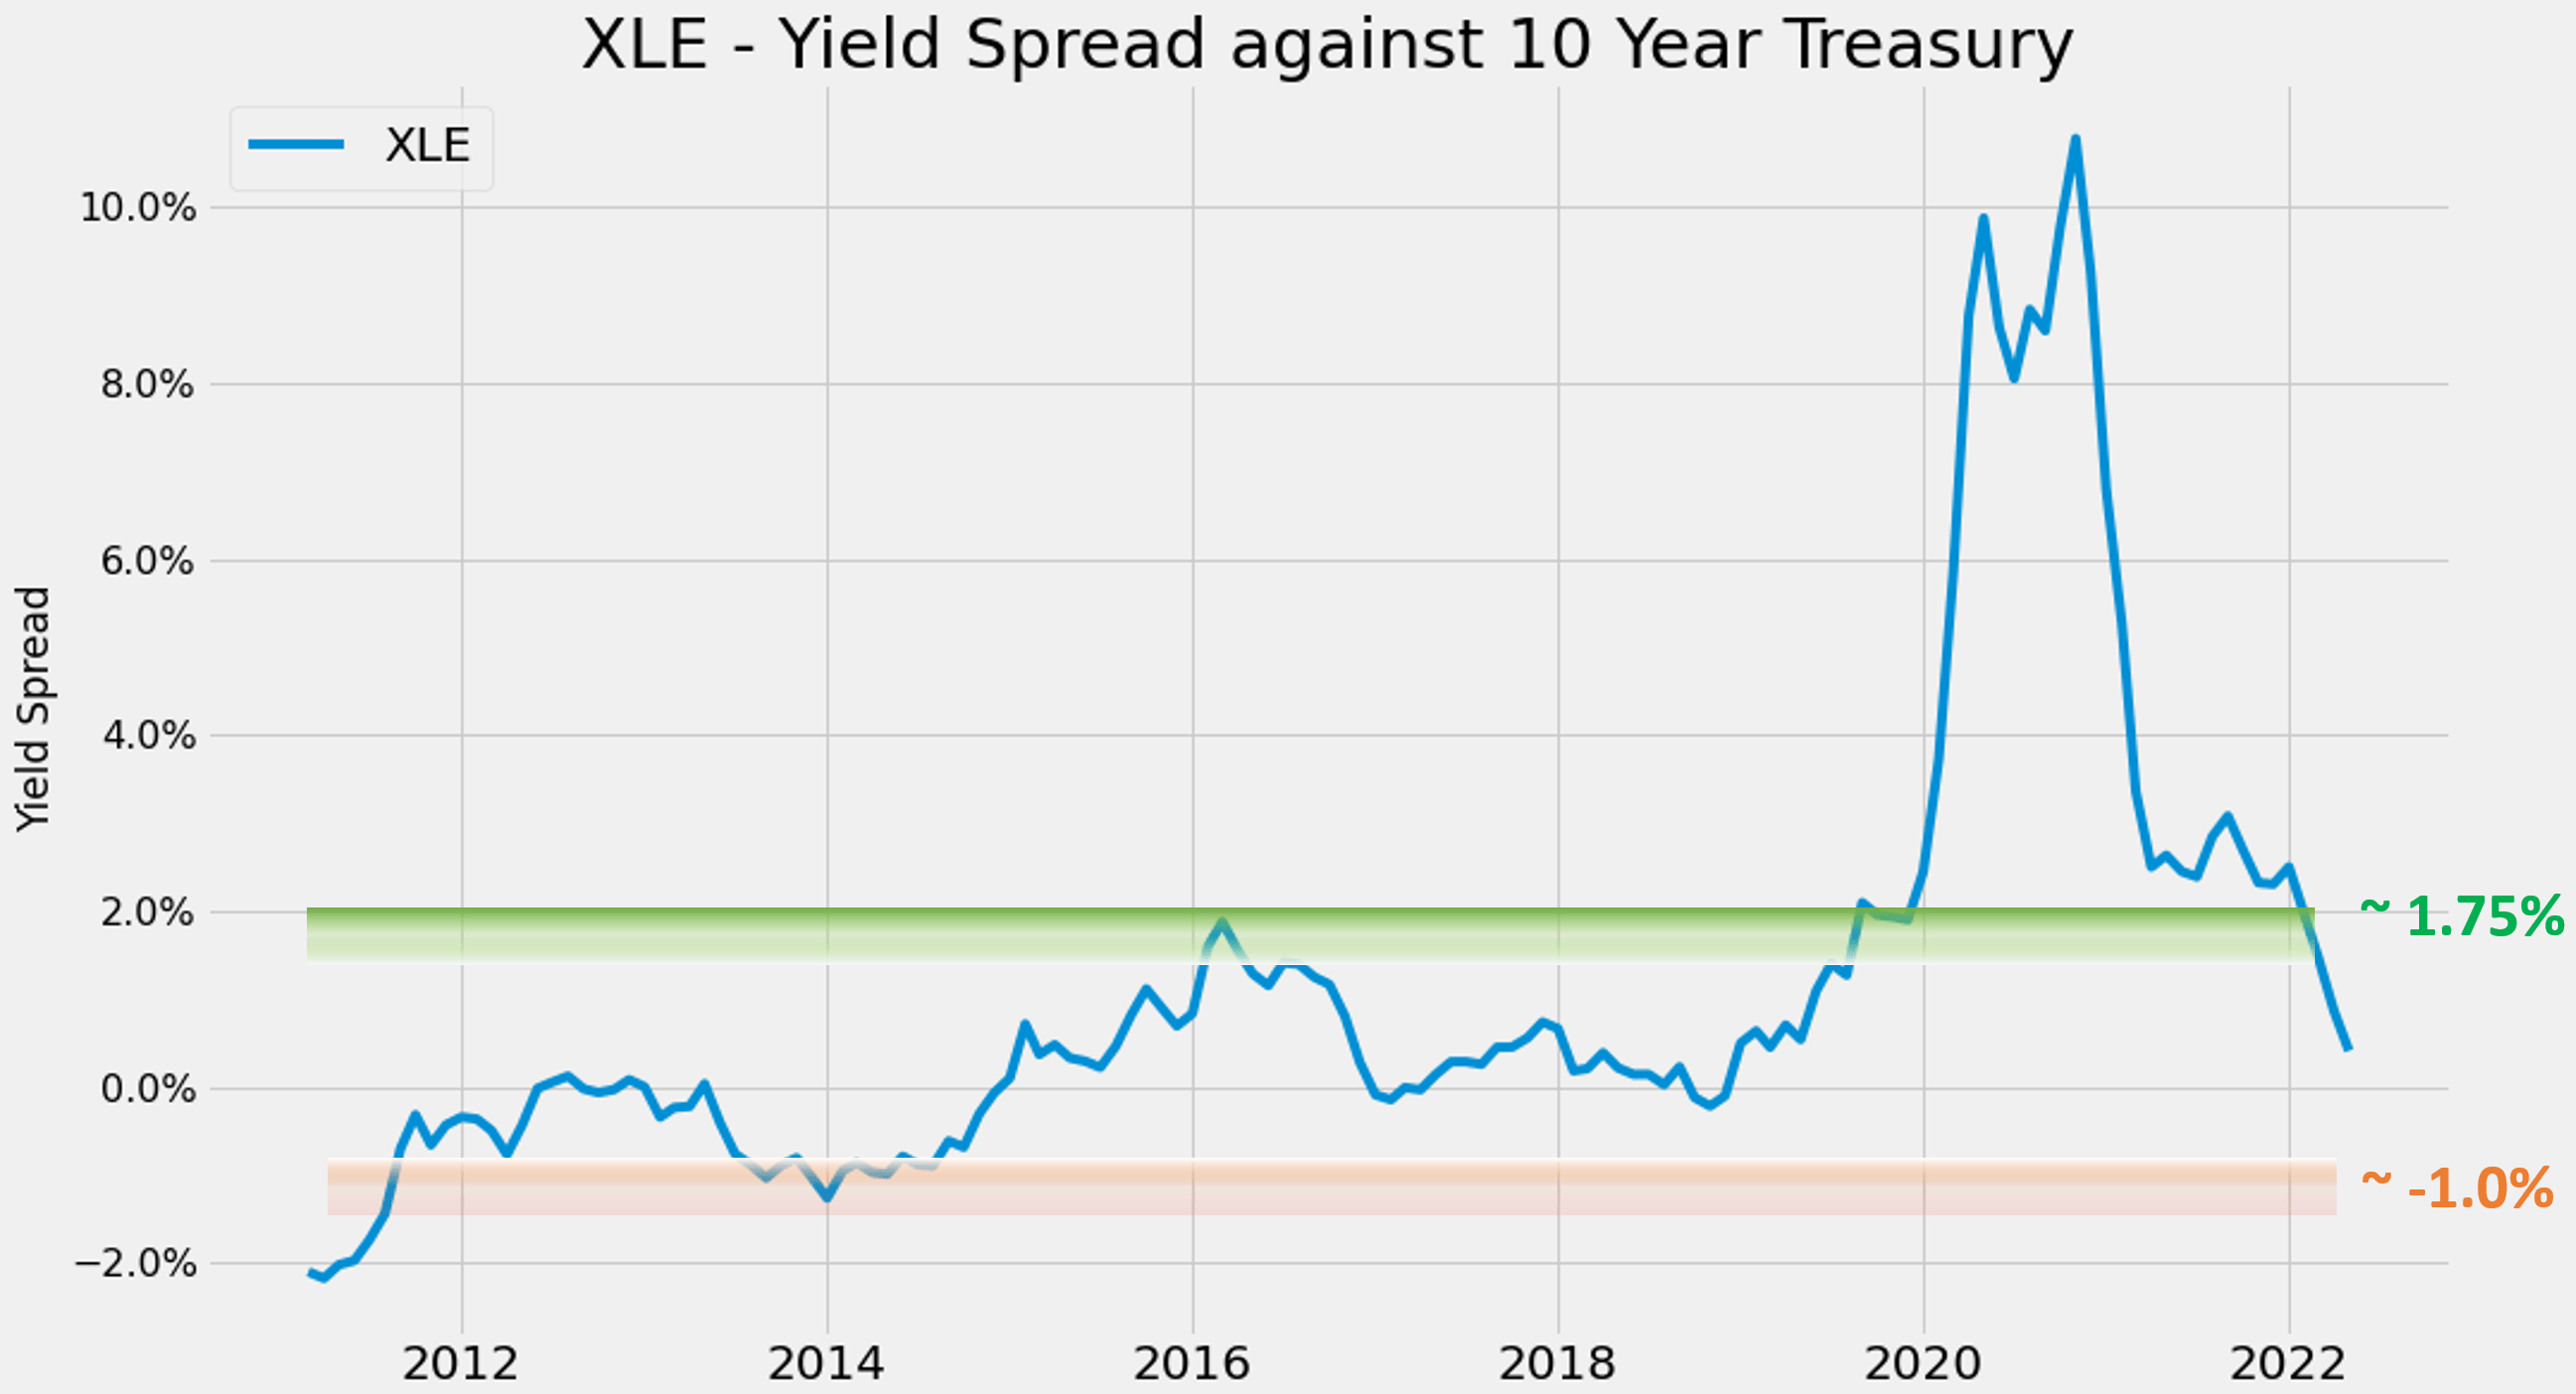
For readers familiar with our analyses, you know that the short-term returns are closely correlated with the yield spread for many of the funds and stocks. And as you can see from the chart below, it is also true for XLE. This chart shows the 2-year total return on XLE (including price appreciation and dividend) when the purchase was made under different yield spreads. There is a clear positive trend and a Pearson correlation coefficient of 0.6. Again, the screaming buying opportunities in 2020 are highlighted in the orange box. And you see the outsized return in the next 2 years.
As of my last writing on Mar 2, the yield spread was 1.32%, above the historical average by a good margin. And as of this writing, the yield spread has narrowed to 0.4%%. Historically, the 2-year total ROI has been almost neutral as this narrower level of YS, mostly because of the price volatility caused by commodities. At the same time, our view is that the conflict between Russia and Ukraine and also the persisting inflation both provide near-term support to XLE and VDE, resulting in a manageable risk profile.
The results for VDE are very similar and we won't repeat the plots here again. For VDE, the positive trend is slighter weaker and the Pearson correlation coefficient of 0.51 because of the small differences in their underlying indexing approach, as discussed next.
Author based on Seeking Alpha data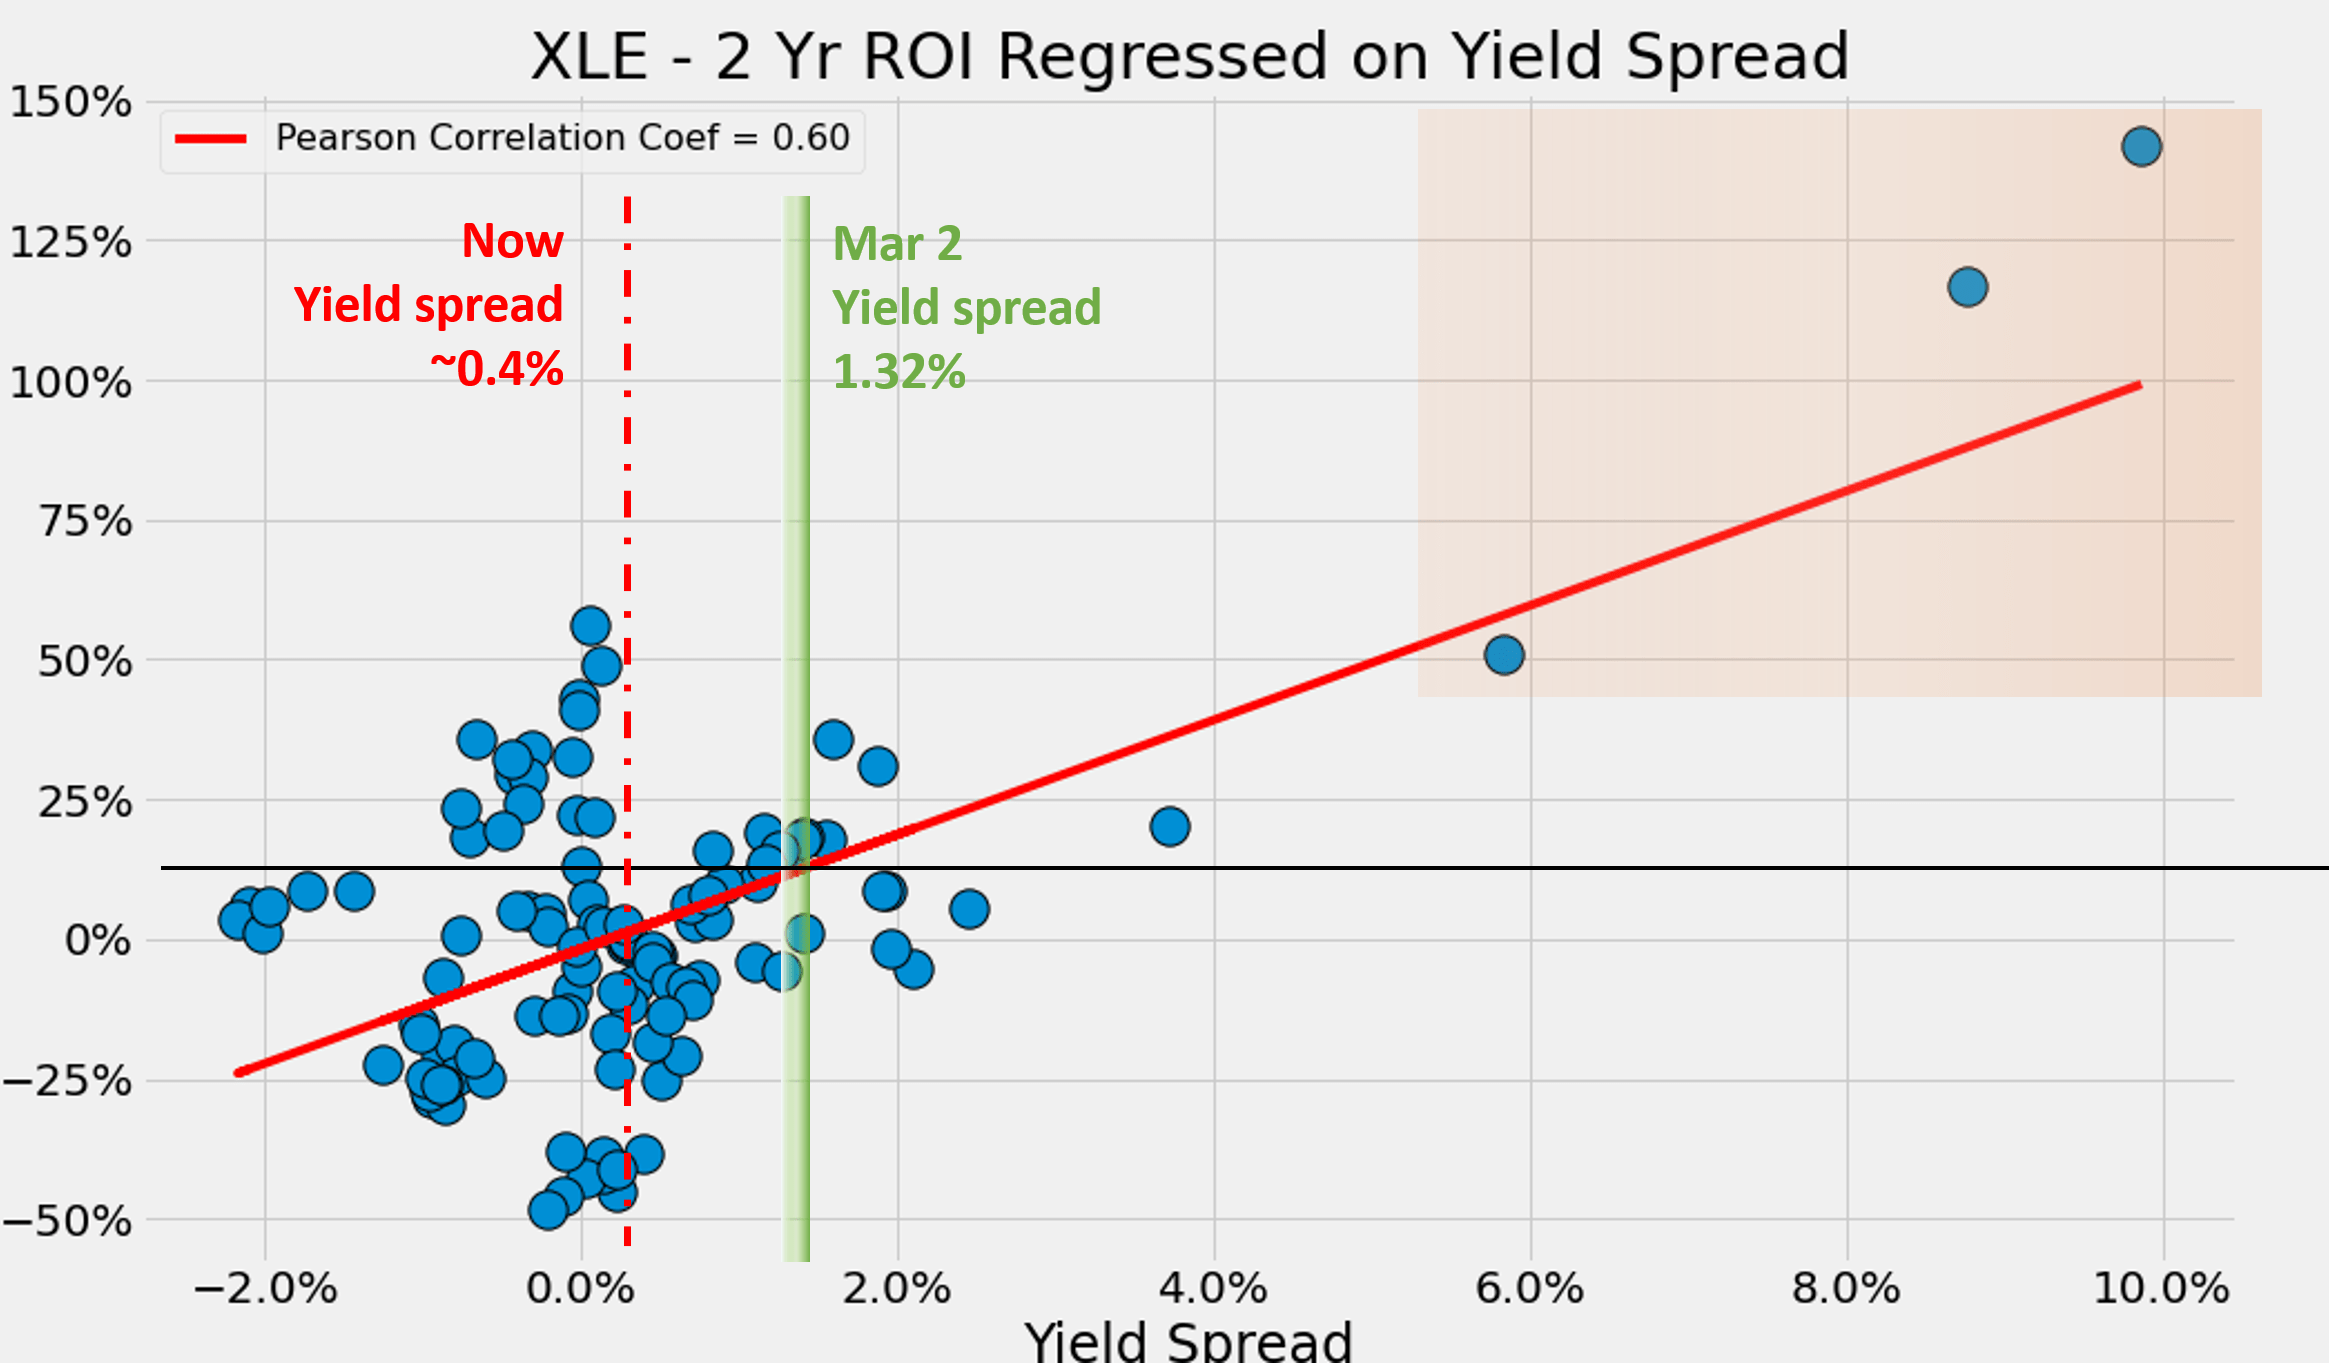
Risks and uncertainties
Before closing this article, we want to point out a few risks and uncertainties associated with the approach described in this article.
First, despite their similarities, XLE and VDE are not exactly the same, as you can see from the following chart. Although you can also see that A) their top 10 holdings both represent a dominant portion of the fund, and B) some of the top 10 holdings are identical but some are different. As a result, both funds are exposed to concentration risk, especially the risks caused by oil prices.
Second, as detailed in our earlier article, dividend yields do not always reflect business fundamentals due to the following factors:
- Tax law - dividend can change depending on whether the tax codes favor it or not.
- Political climate - dividend can also change based on how politically popular it is.
- Composition of the market index - dividend yield of "the market" can also be biased if the index is dominated by a few mega-caps who do not pay dividends - like what we are experiencing now.
- As a result, we do not directly use the yield spread in our asset allocation decisions. In practice, we first adjust for the above corrections and then use the adjusted yield spread. But the data and approach illustrated here is the first place we check.
Source: ETF.com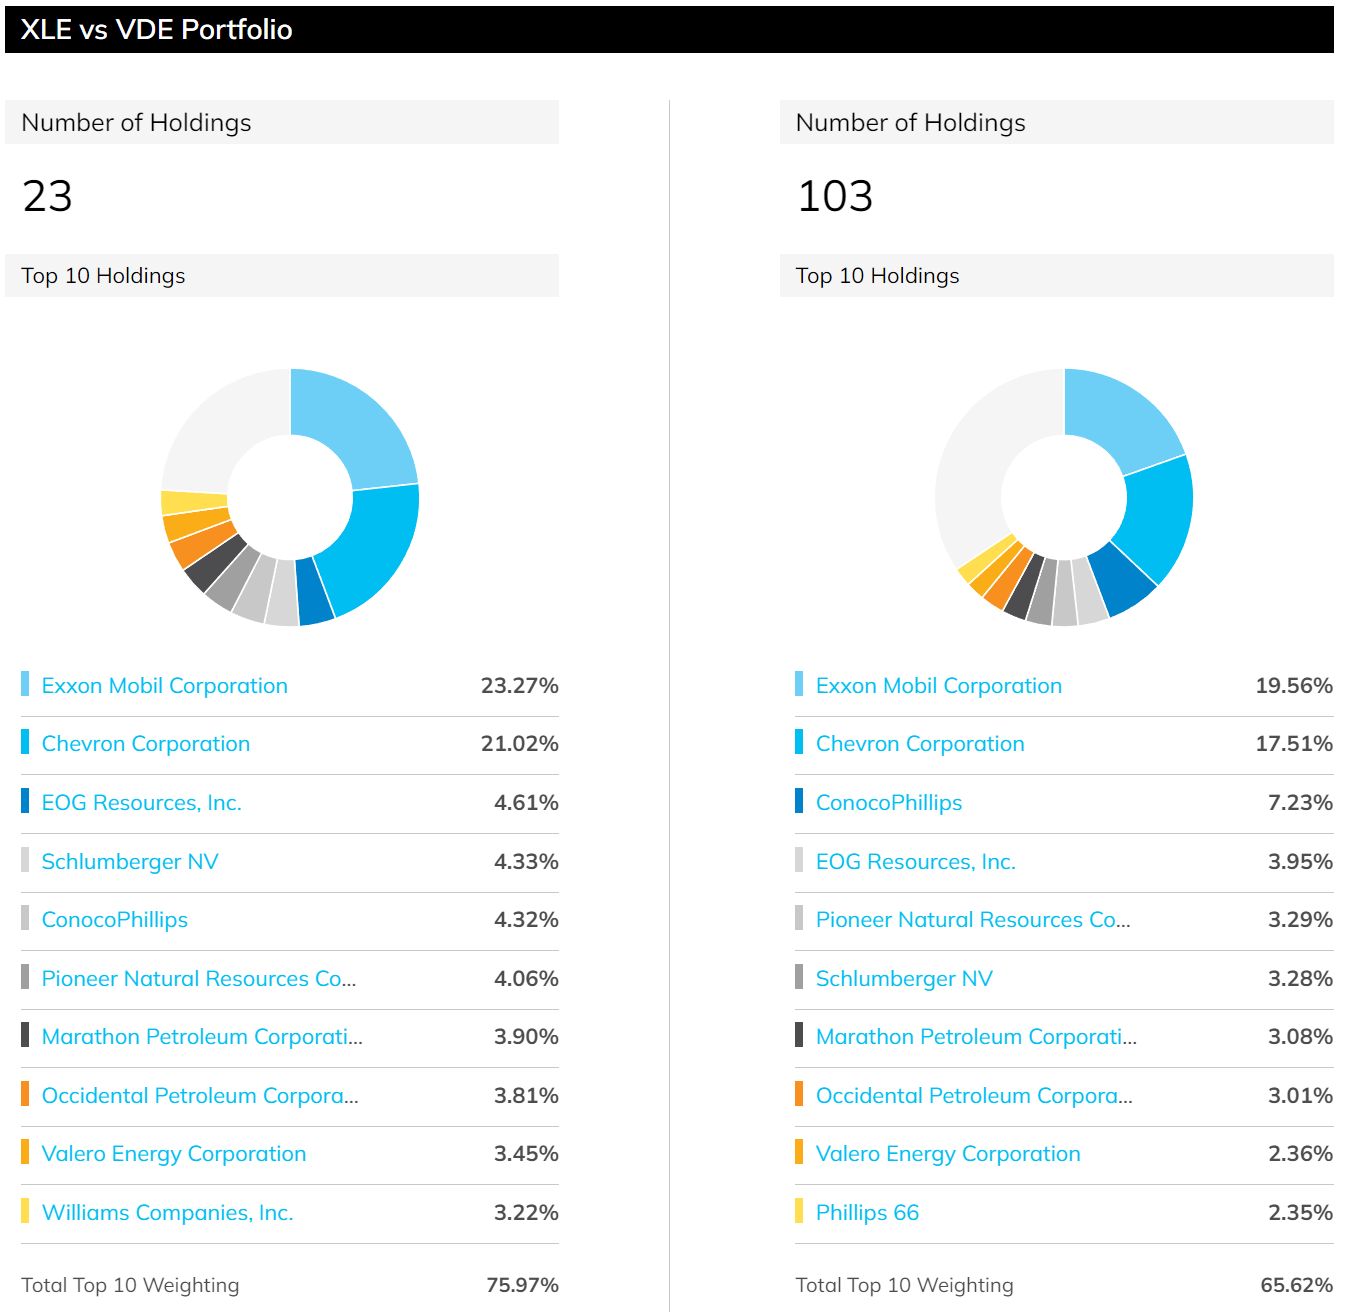
Conclusions and final thoughts
We use a Market Sector Dashboard to put a finger on the pulse of the market and its major sectors. For the energy sector (represented by XLE and VDE) at this moment, our key observations are:
- Since our last writing, their price appreciation and the surges in the treasury rates have narrowed the YS substantially. Now their YS Z-score is only slightly positive (about 0.08), and XLE and VDE are neutrally valued compared to their historical spectrum.
- Although, compared to other sectors, energy is the only sector that features a positive YS Z-score now. At the same time, we see the conflict between Russia and Ukraine and also the persisting inflation both providing near-term support to XLE and VDE (and other energy sector funds too).
- Finally, the overall market now features a substantially negative yield spread relative to the treasury rates (Z-score about -1). For us, this signals a fundamental change between bond valuation and equity valuation. We think treasury yields are close to their long-term targets already. At a very fundamental level, in the long term, treasury bond rates cannot rise above long-term inflation or GDP growth. Our government has been relying on inflation and GDP expansion to inflate away and outgrow its debt obligations for decades in the past. And it will (it will have to) continue doing so. As such, besides equity sectors with attractive yield spreads, we ourselves have also started increasing our exposure to treasury bonds, and we also recommend investors consider doing the same.
Check out our marketplace service
As you can tell, our core style is to provide actionable and unambiguous ideas from our independent research. If your share this investment style, check out Envision Early Retirement. It provides at least 2x in-depth articles per week on such ideas.
We have vetted and perfected our methods with our own money and efforts for the past 15 years. For example, our aggressive growth portfolio has helped ourselves and many around us to consistently maximize return with minimal drawdowns.
Lastly, do not hesitate to take advantage of the free-trials - they are absolutely 100% Risk-Free.
This article was written by

** Disclosure: I am associated with Sensor Unlimited.
** Master of Science, 2004, Stanford University, Stanford, CA
Department of Management Science and Engineering, with concentration in quantitative investment
** PhD, 2006, Stanford University, Stanford, CA
Department of Mechanical Engineering, with concentration in advanced and renewable energy solutions
** 15 years of investment management experiences
Since 2006, have been actively analyzing stocks and the overall market, managing various portfolios and accounts and providing investment counseling to many relatives and friends.
** Diverse background and holistic approach
Combined with Sensor Unlimited, we provide more than 3 decades of hands-on experience in high-tech R&D and consulting, housing market, credit market, and actual portfolio management. We monitor several asset classes for tactical opportunities. Examples include less-covered stocks ideas (such as our past holdings like CRUS and FL), the credit and REIT market, short-term and long-term bond trade opportunities, and gold-silver trade opportunities.
I also take a holistic view and watch out on aspects (both dangers and opportunities) often neglected – such as tax considerations (always a large chunk of return), fitness with the rest of holdings (no holding is good or bad until it is examined under the context of what we already hold), and allocation across asset classes.
Above all, like many SA readers and writers, I am a curious investor – I look forward to constantly learn, re-learn, and de-learn with this wonderful community.
Disclosure: I/we have no stock, option or similar derivative position in any of the companies mentioned, and no plans to initiate any such positions within the next 72 hours. I wrote this article myself, and it expresses my own opinions. I am not receiving compensation for it (other than from Seeking Alpha). I have no business relationship with any company whose stock is mentioned in this article.