0 Comment(s) *
* The moderation of comments is automated and not cleared manually by indianexpress.com.
 The MPI seeks to measure poverty across its multiple dimensions and in effect complements existing poverty statistics based on per capita consumption expenditure.
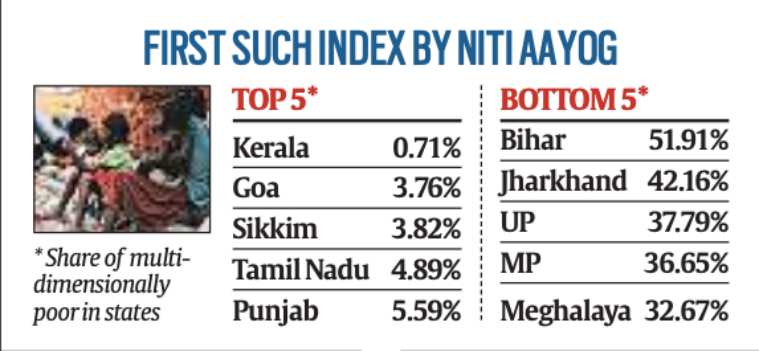
 THE FIRST-EVER Multi-dimensional Poverty Index (MPI) prepared by government think tank Niti Aayog has said that Bihar has the highest proportion of people, at 51.91 per cent of the state’s population, who are multidimensionally poor, followed by Jharkhand at 42.16 per cent and Uttar Pradesh at 37.79 per cent.
The MPI seeks to measure poverty across its multiple dimensions and in effect complements existing poverty statistics based on per capita consumption expenditure. It has three equally weighted dimensions – health, education, and standard of living – which in turn are represented by 12 indicators such as nutrition, school attendance, years of schooling, drinking water, sanitation, housing, bank accounts among others, according to the report.
Bihar also has the highest number of malnourished people followed by Jharkhand, Madhya Pradesh, Uttar Pradesh, and Chhattisgarh. Kerala, Goa, and Sikkim have the lowest percentage of population being multidimensionally poor at 0.71 per cent, 3.76 per cent and 3.82 per cent, respectively. This baseline report of the national MPI measure is based on the reference period of 2015-16 of the National Family Health Survey (NFHS).
Measuring poverty has evolved globally over the years. The conventional method has been to specify a minimum income (or expenditure) required to purchase a basket of goods and services to meet basic needs. It required defining a poverty line first, which the C Rangarajan committee had estimated in 2014 to be Rs 972 a month per person in rural areas and Rs 1,407 a month per person in urban areas, at 2011-12 prices.
 Bihar also has the highest number of malnourished people.
 “The development of the National Multidimensional Poverty Index of India is an important contribution towards instituting a public policy tool which monitors multidimensional poverty, informs evidence-based and focused interventions, thereby ensuring that no one is left behind. This report presents an in-depth analysis of the headcount ratio and intensity of multidimensional poverty at the national, State/UT, and district levels,” NITI Aayog Vice Chairman Rajiv Kumar said in a foreword to the report.
Among the Union Territories (UTs), Dadra and Nagar Haveli (27.36 per cent), Jammu & Kashmir, and Ladakh (12.58), Daman & Diu (6.82 per cent) and Chandigarh (5.97 per cent), have emerged as the poorest UTs in India. The proportion of poor in Puducherry at 1.72 per cent is the lowest among the Union Territories, followed by Lakshadweep at 1.82 per cent, Andaman & Nicobar Islands at 4.30 per cent and Delhi at 4.79 per cent.
The MPI uses the globally accepted methodology developed by the Oxford Poverty and Human Development Initiative (OPHI) and the United Nations Development Programme (UNDP). The dimensions of the index have proven to help identify and achieve targeted policy interventions.
“The ability to provide a better depiction of poverty and inform more precise policy actions has been an incentive in every country that has developed a national MPI so far. Evidence has shown that people who are experiencing multiple deprivations in crucial areas of their lives, such as education, health, safety, or employment, may not be income poor and policies to reduce income poverty may not affect other deprivations,” the report noted.
Public action in areas like education, infrastructure, and housing, which might only impact income in the next generation, are not well captured by traditional monetary metrics of poverty estimation, whereas a national MPI can show rapid improvements in these areas, making visible the impact of social policies and interventions more directly, it said.
The MPI will enable estimation of poverty not only at the level of the states but also for all the 700-plus districts across the 12 indicators, capturing simultaneous deprivations and indicator-wise contribution to poverty. It will facilitate formulation of sectoral policies and targeted interventions which contribute towards ensuring that “no one is left behind”, as per the report.
The district-wise estimation of the national MPI will also ensure reaching out to the furthest behind first through focused efforts on specific indicators and dimensions, it said.
The index is calculated by first setting the deprivation cut-offs for each indicator, i.e., the level of achievement considered normatively sufficient for an individual to be considered not deprived in an indicator. For example, the individual has completed at least six years of schooling. Such a cut off would be applied to determine whether the individual is deprived in each indicator. Weights are added to each indicator and a composite metric is then used to calculate the index.
