Covid-19 in the UK: How many coronavirus cases are there in my area?
By The Visual and Data Journalism Team
BBC News
- Published
 Image source, Getty Images
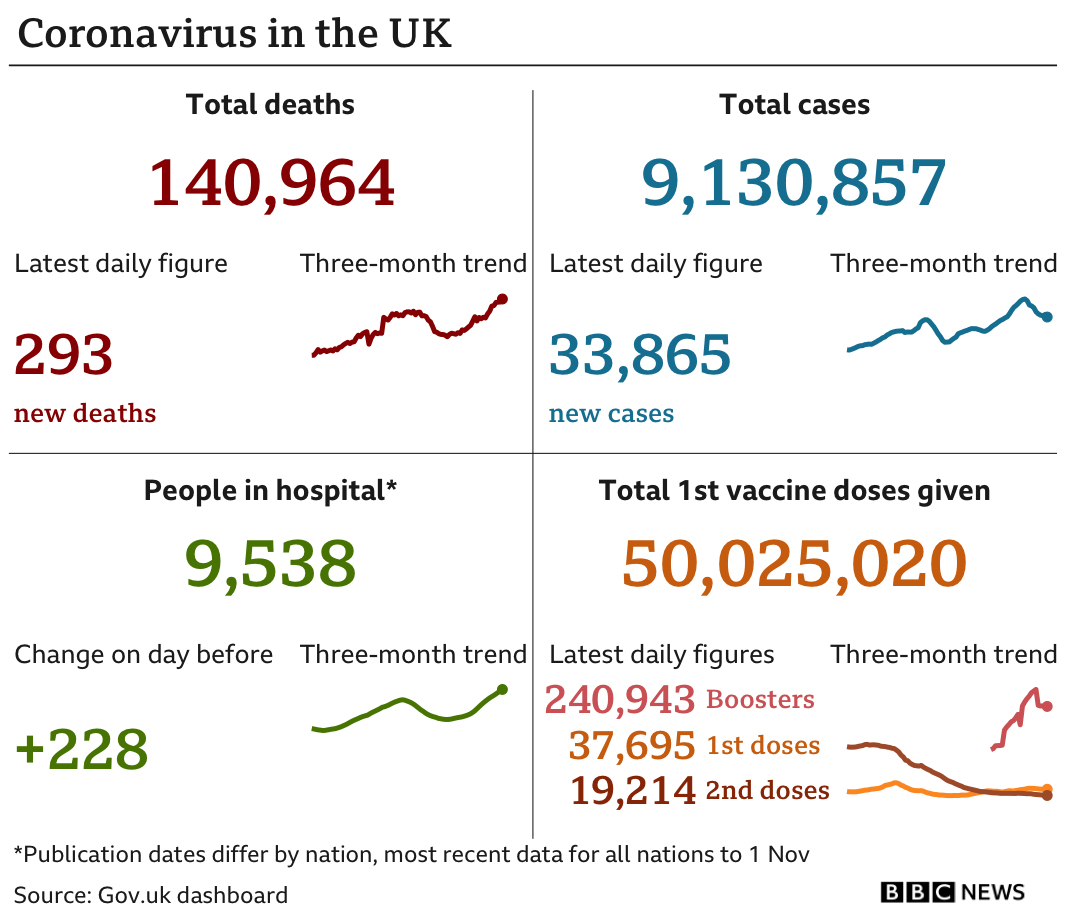
There have been more than nine million confirmed cases of coronavirus in the UK and 140,000 people have died, government figures show.
However, these figures include only people who have died within 28 days of testing positive for coronavirus.
So far, 87% of people aged 12 and over in the UK have had their first vaccine dose, while 79% have had their second and more than 14% have had a booster dose.


Find out how the pandemic has affected your area and how it compares with the national average:
A modern browser with JavaScript and a stable internet connection are required to view this interactive.
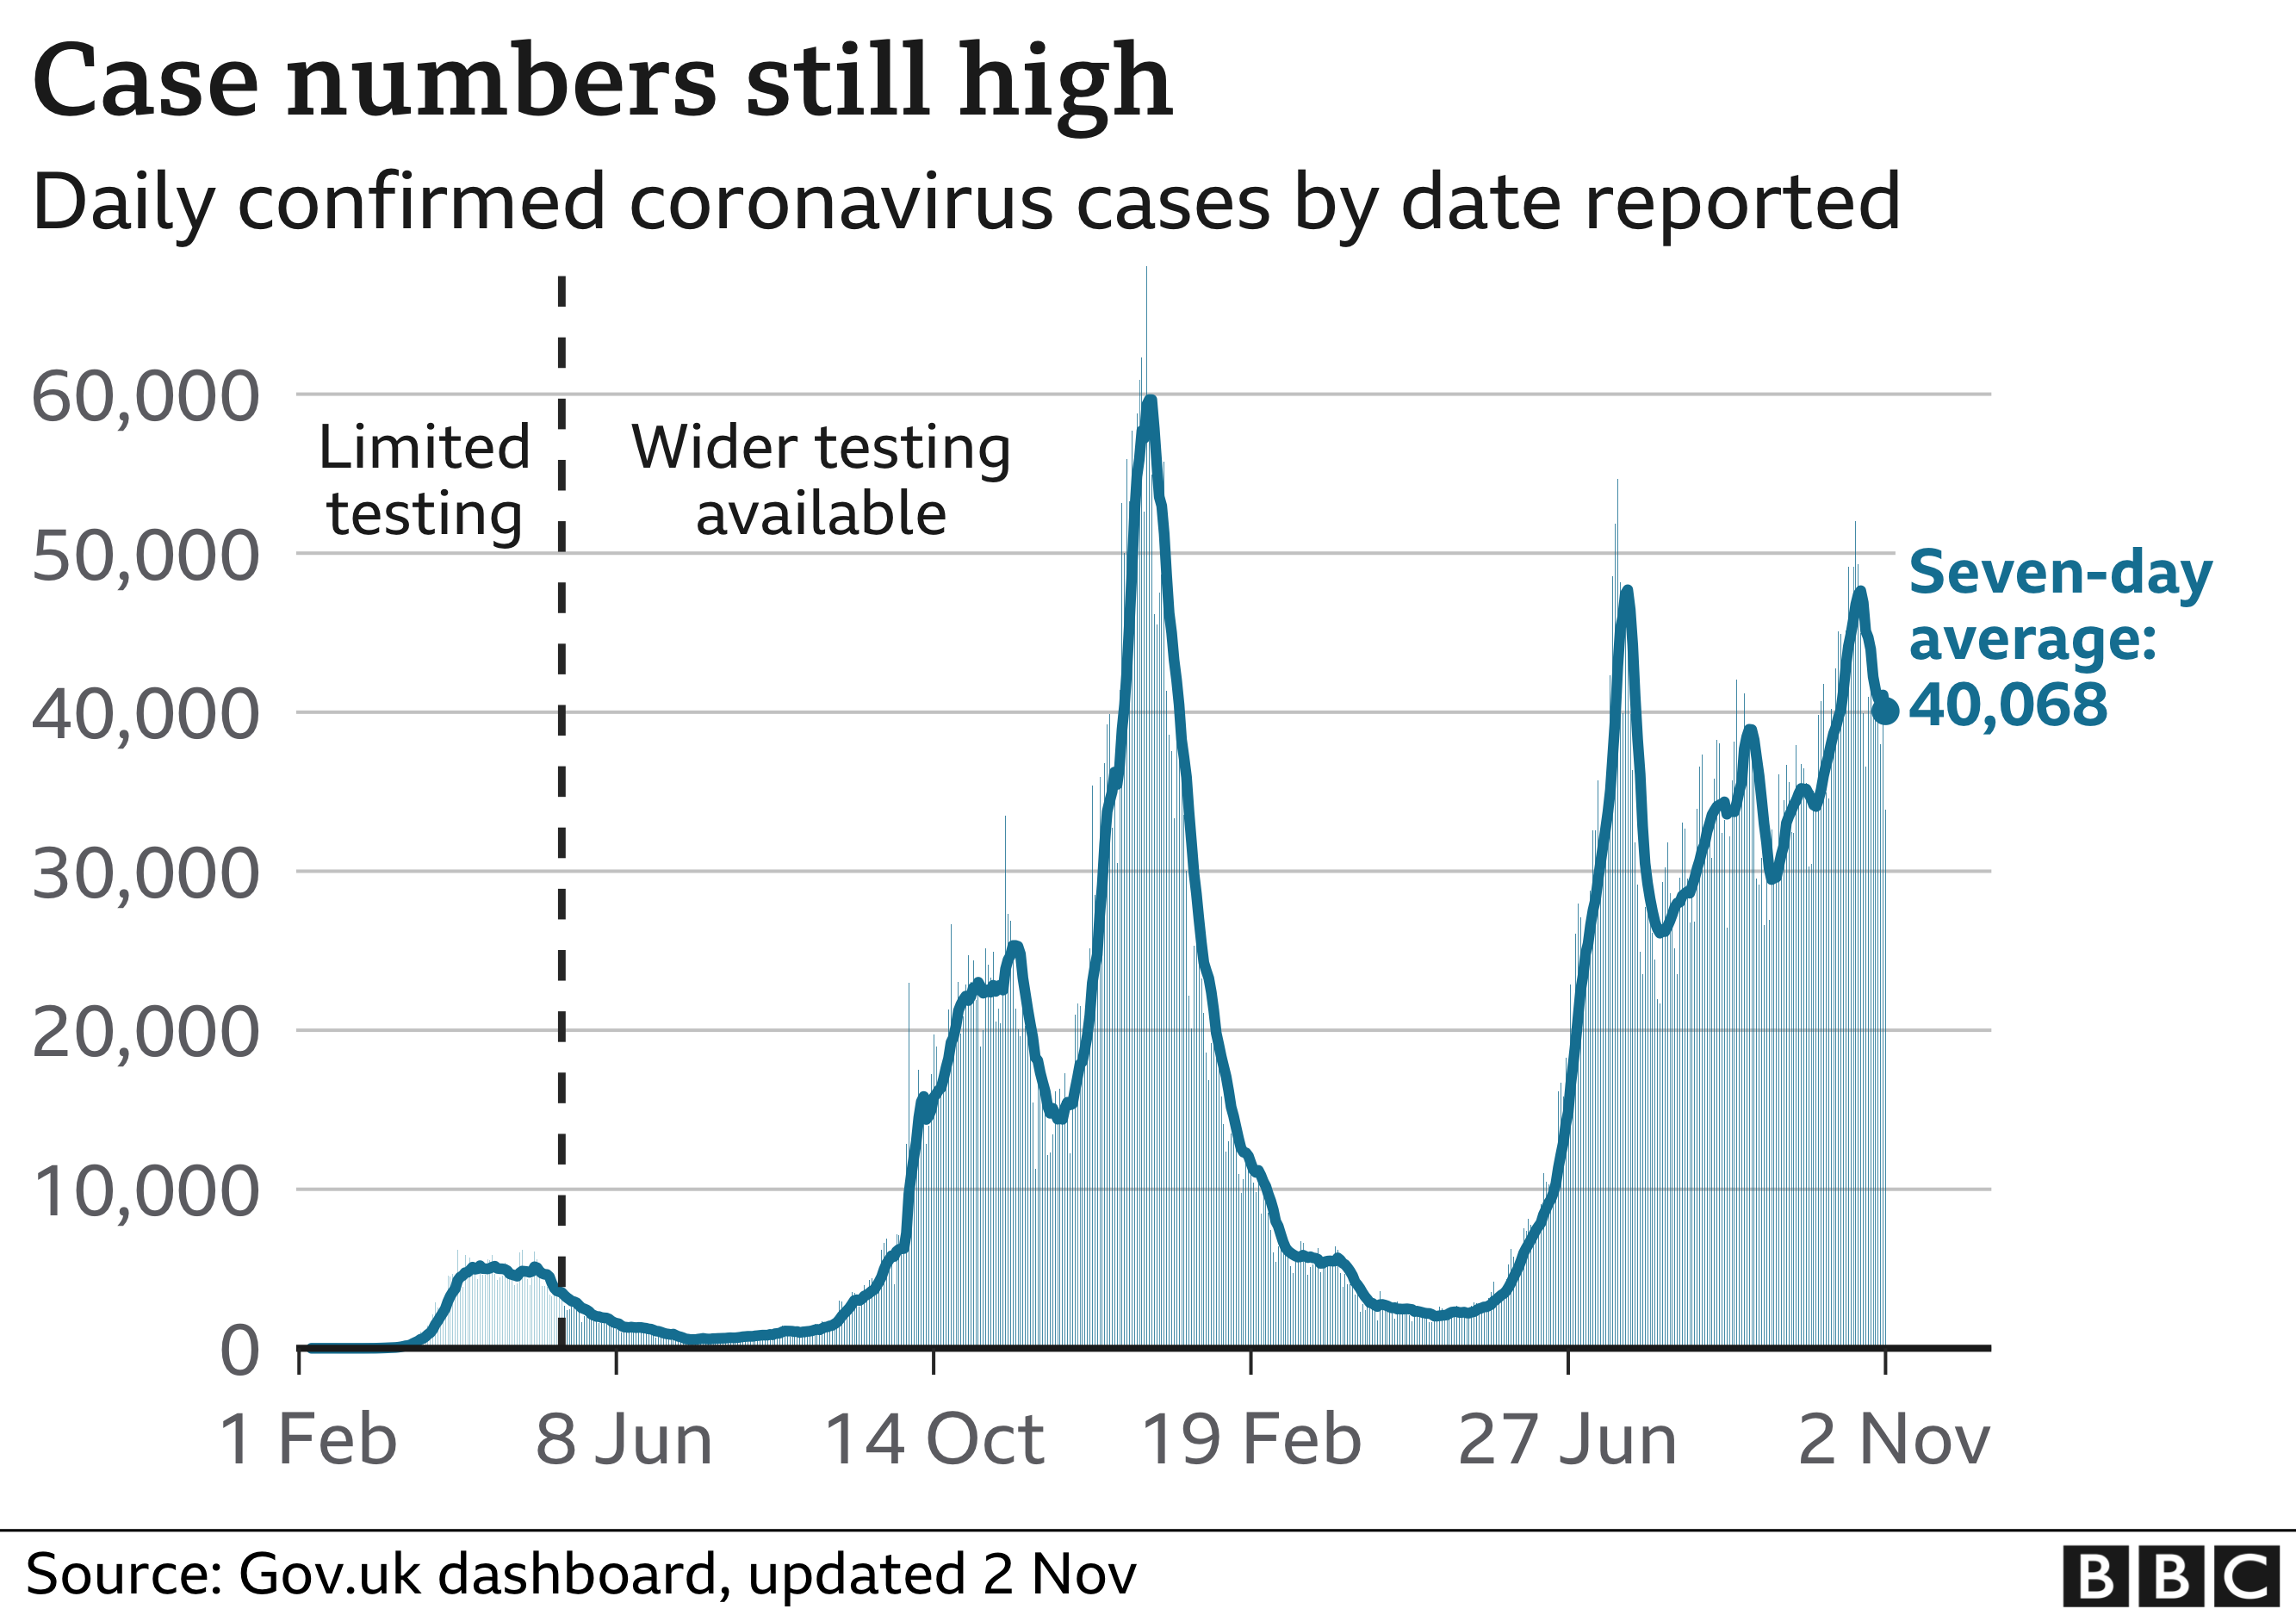
Daily cases remain high
After falling sharply at the end of July, the average number of daily confirmed cases has been climbing since the end of September. However, there has been a small fall in recent days.
A further 33,865 confirmed cases were announced on Tuesday.
The recent spikes have been driven by the Delta variant, which spreads faster than the previously most common Kent variant (now named Alpha).
NHS leaders have called for the reintroduction of some Covid restrictions, such as mandatory face coverings in crowded and enclosed spaces, to avoid a winter crisis.
However, the government has said there are currently no plans to activate the so-called Plan B for winter.
It is thought the infection rate in the first peak of the virus in spring last year was much higher than was evident from the reported number of cases. Testing capacity was then too limited to detect the true number of daily cases.
The red areas on the map below show the places currently seeing the highest number of cases per 100,000 people.
You can use our postcode look-up to check what the rules are where you live.
Vaccine rollout continuing
More than 50 million people, or 87% of those aged 12 and over in the UK, have now received a first dose of a vaccine.
The number of people who have received a second vaccine dose is now more than 45 million, or more than 79% of people aged 12 and over.
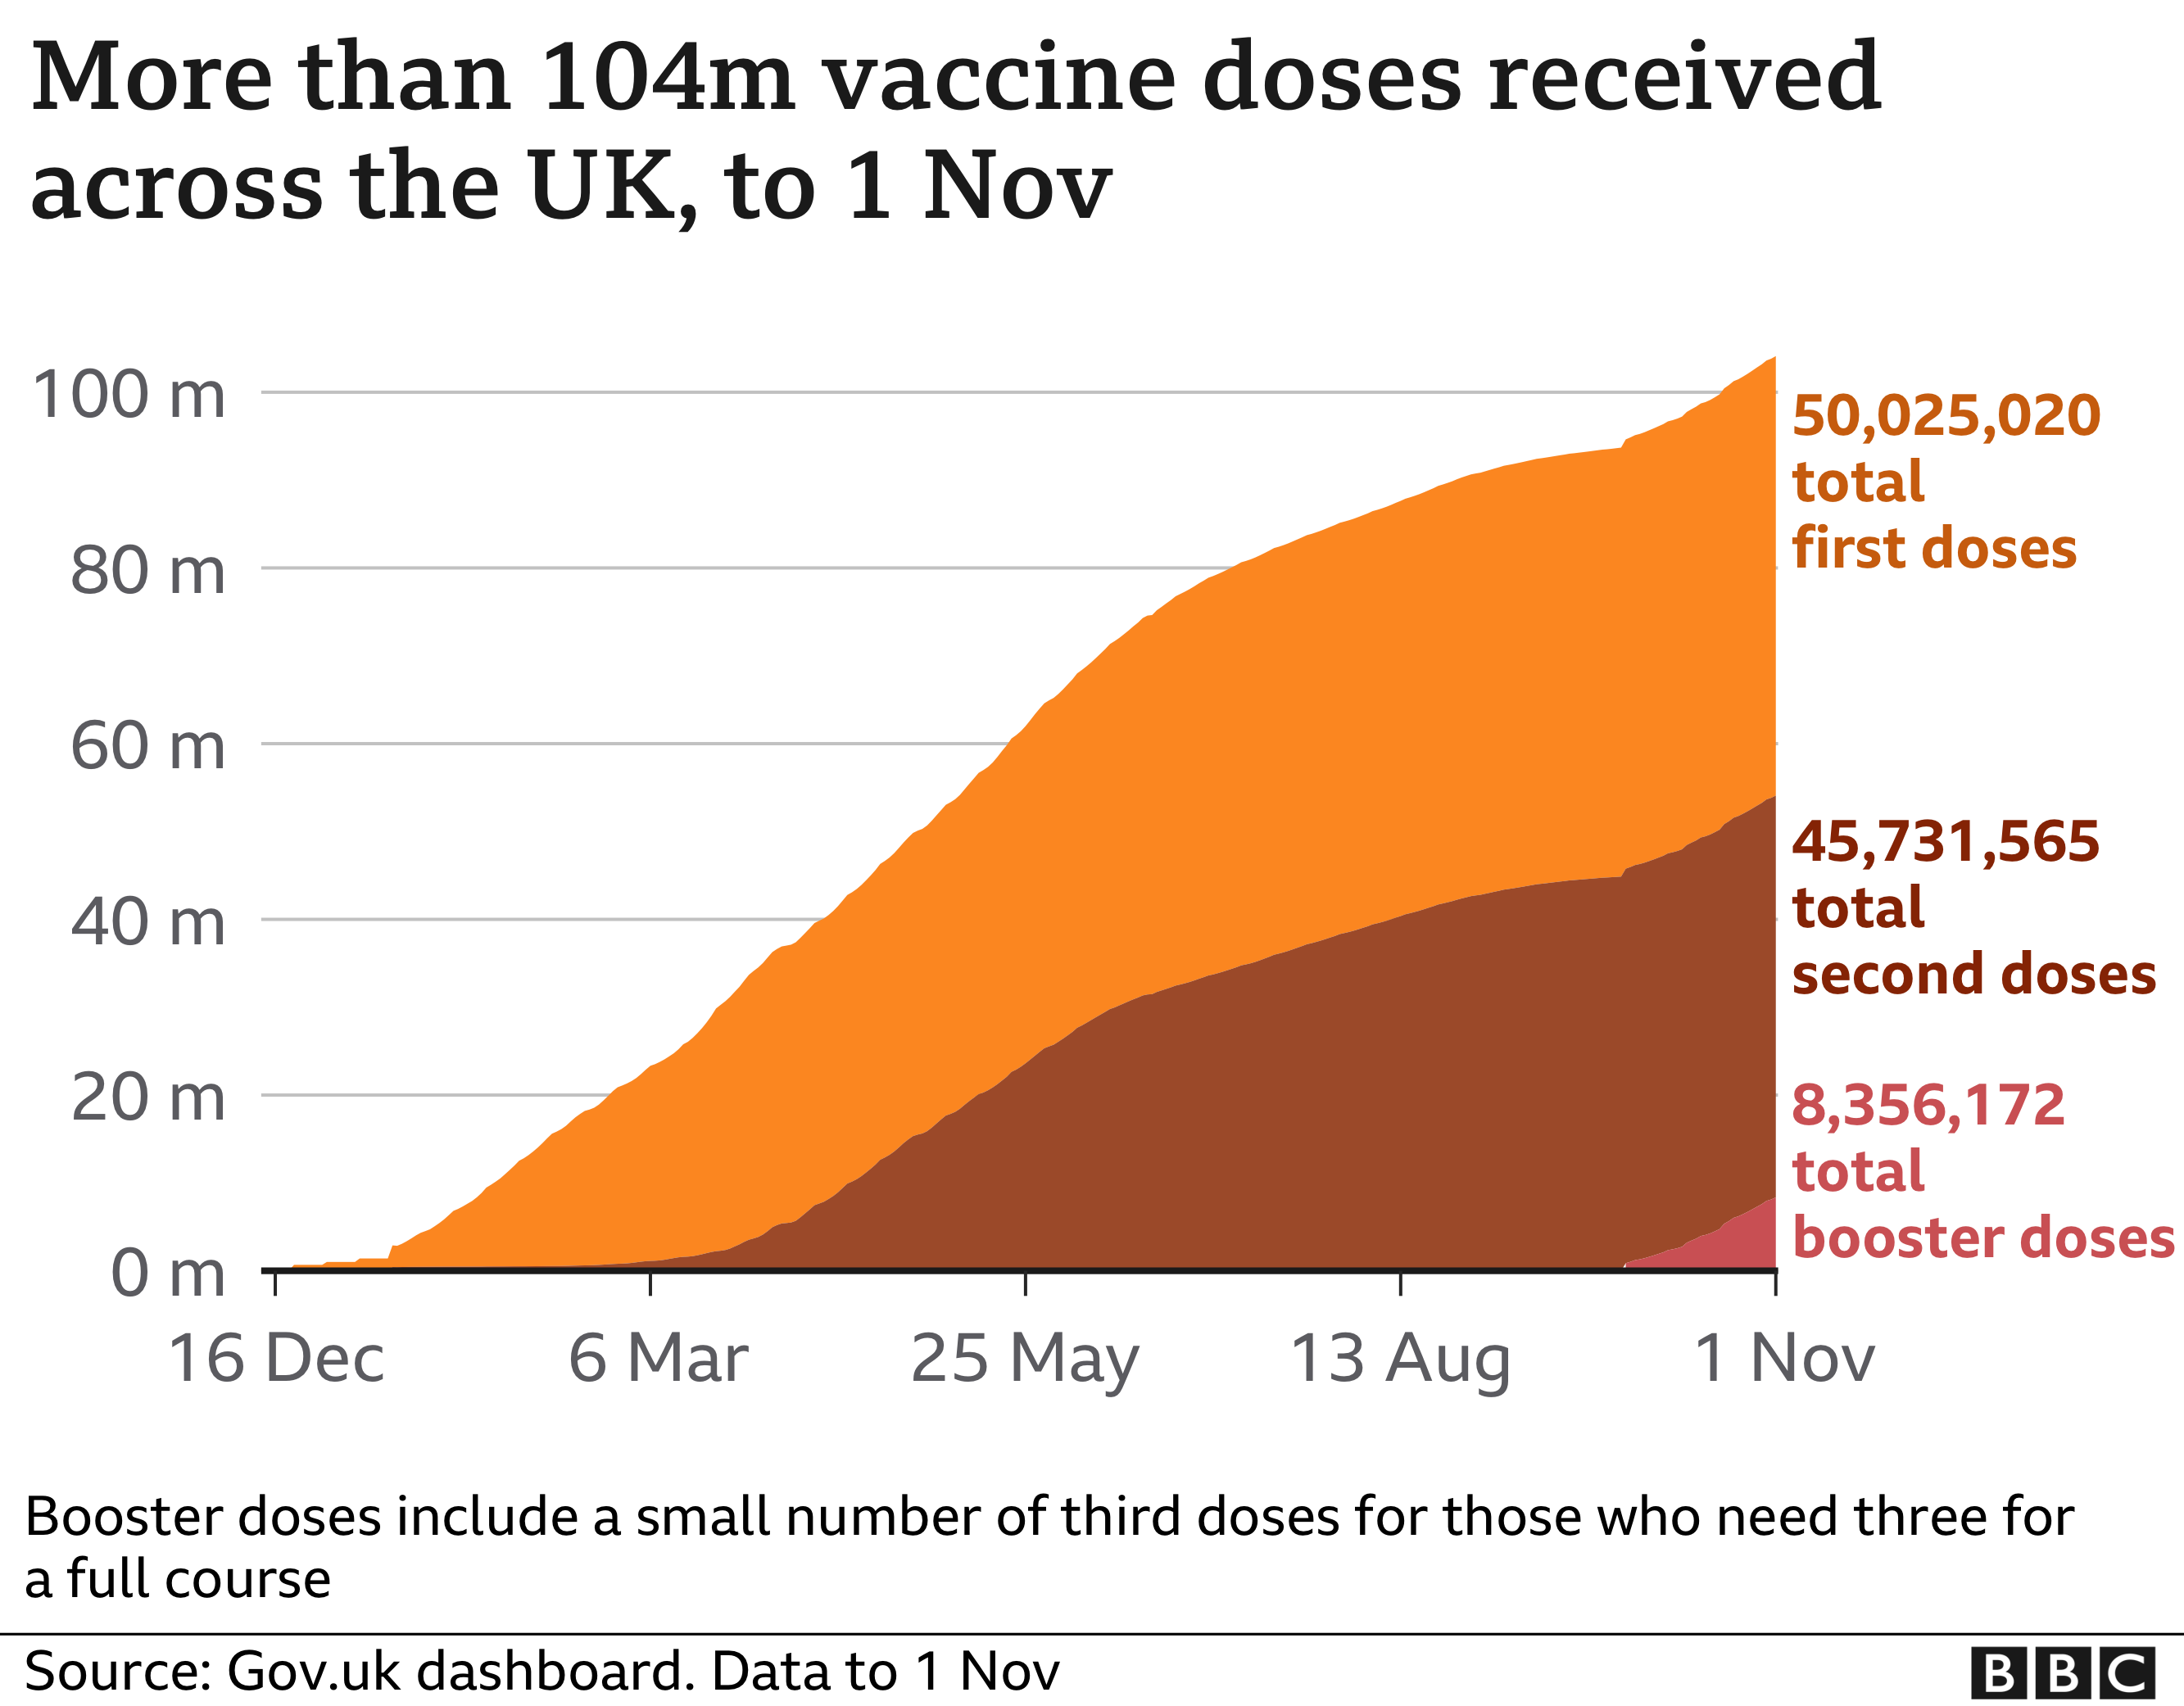
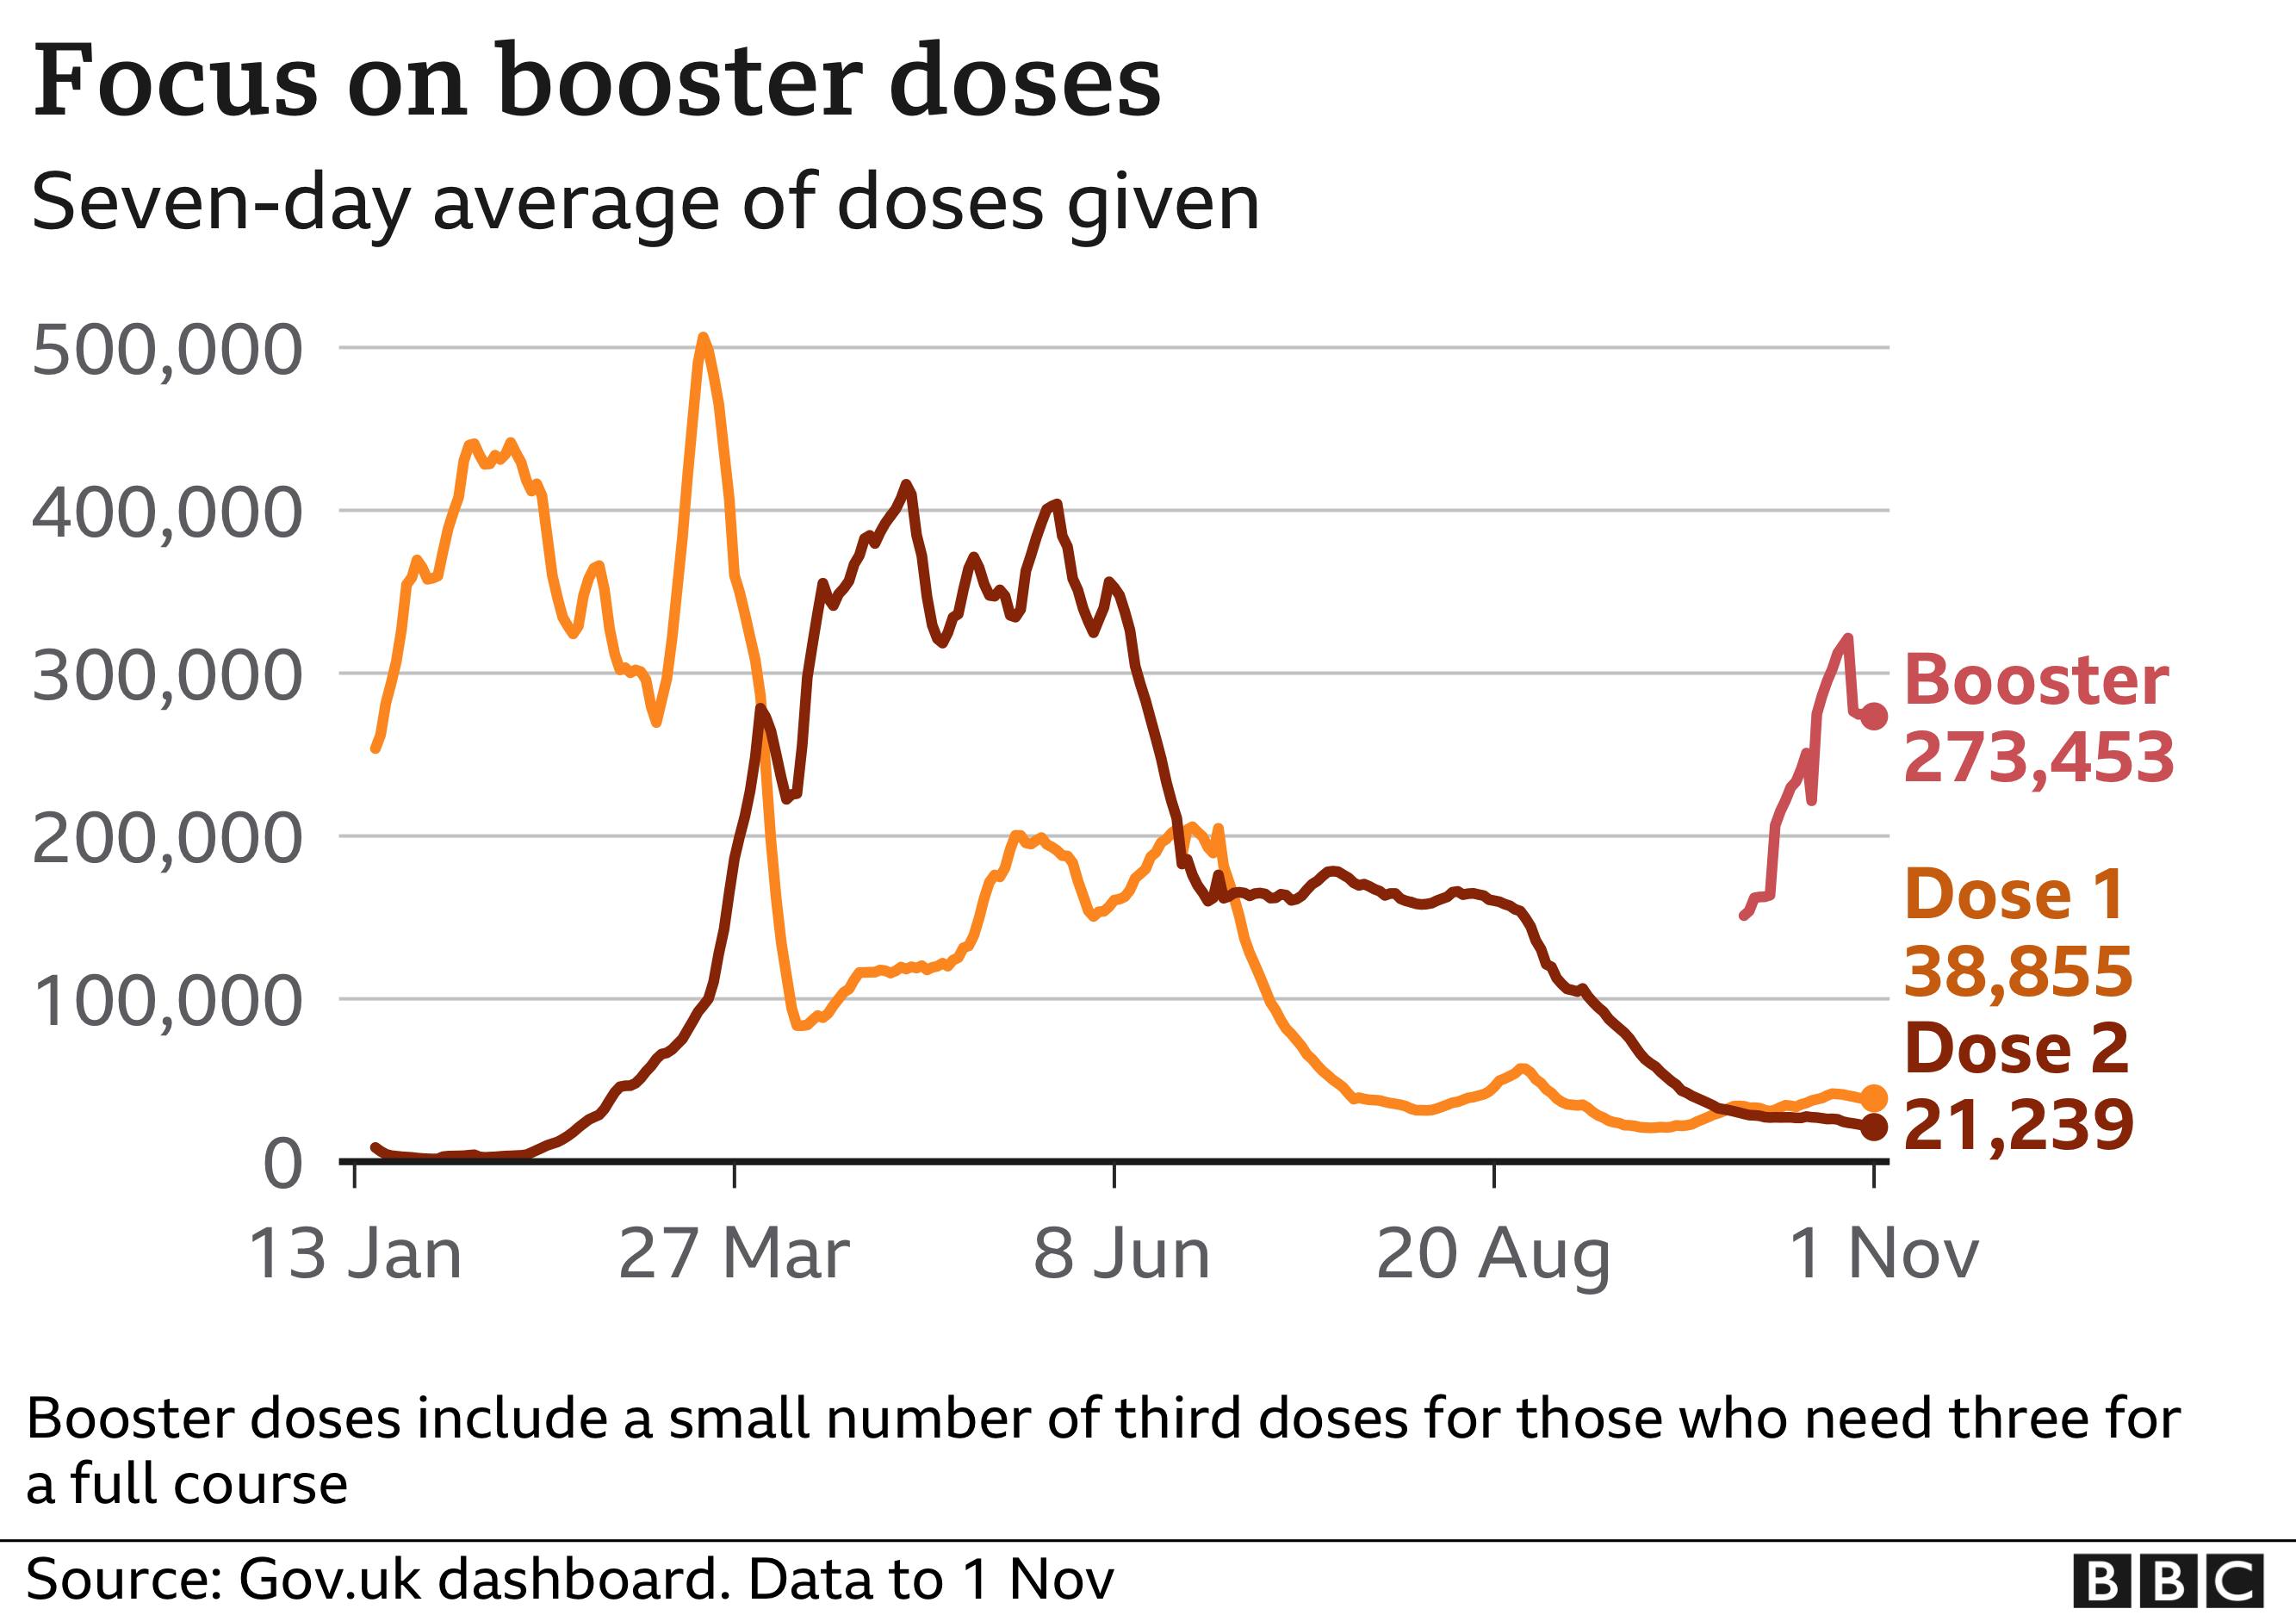
A booster campaign is also now under way, with 30 million people in nine priority groups qualifying for a third dose.
While the uptake of first and second doses has dropped off there has been a steep rise in people having booster doses. More than seven million of these doses have been administered in England so far.
In Scotland, nearly 770,000 people have had their booster shot, while that figure is nearly 470,000 in Wales and it is approaching 100,000 in Northern Ireland.
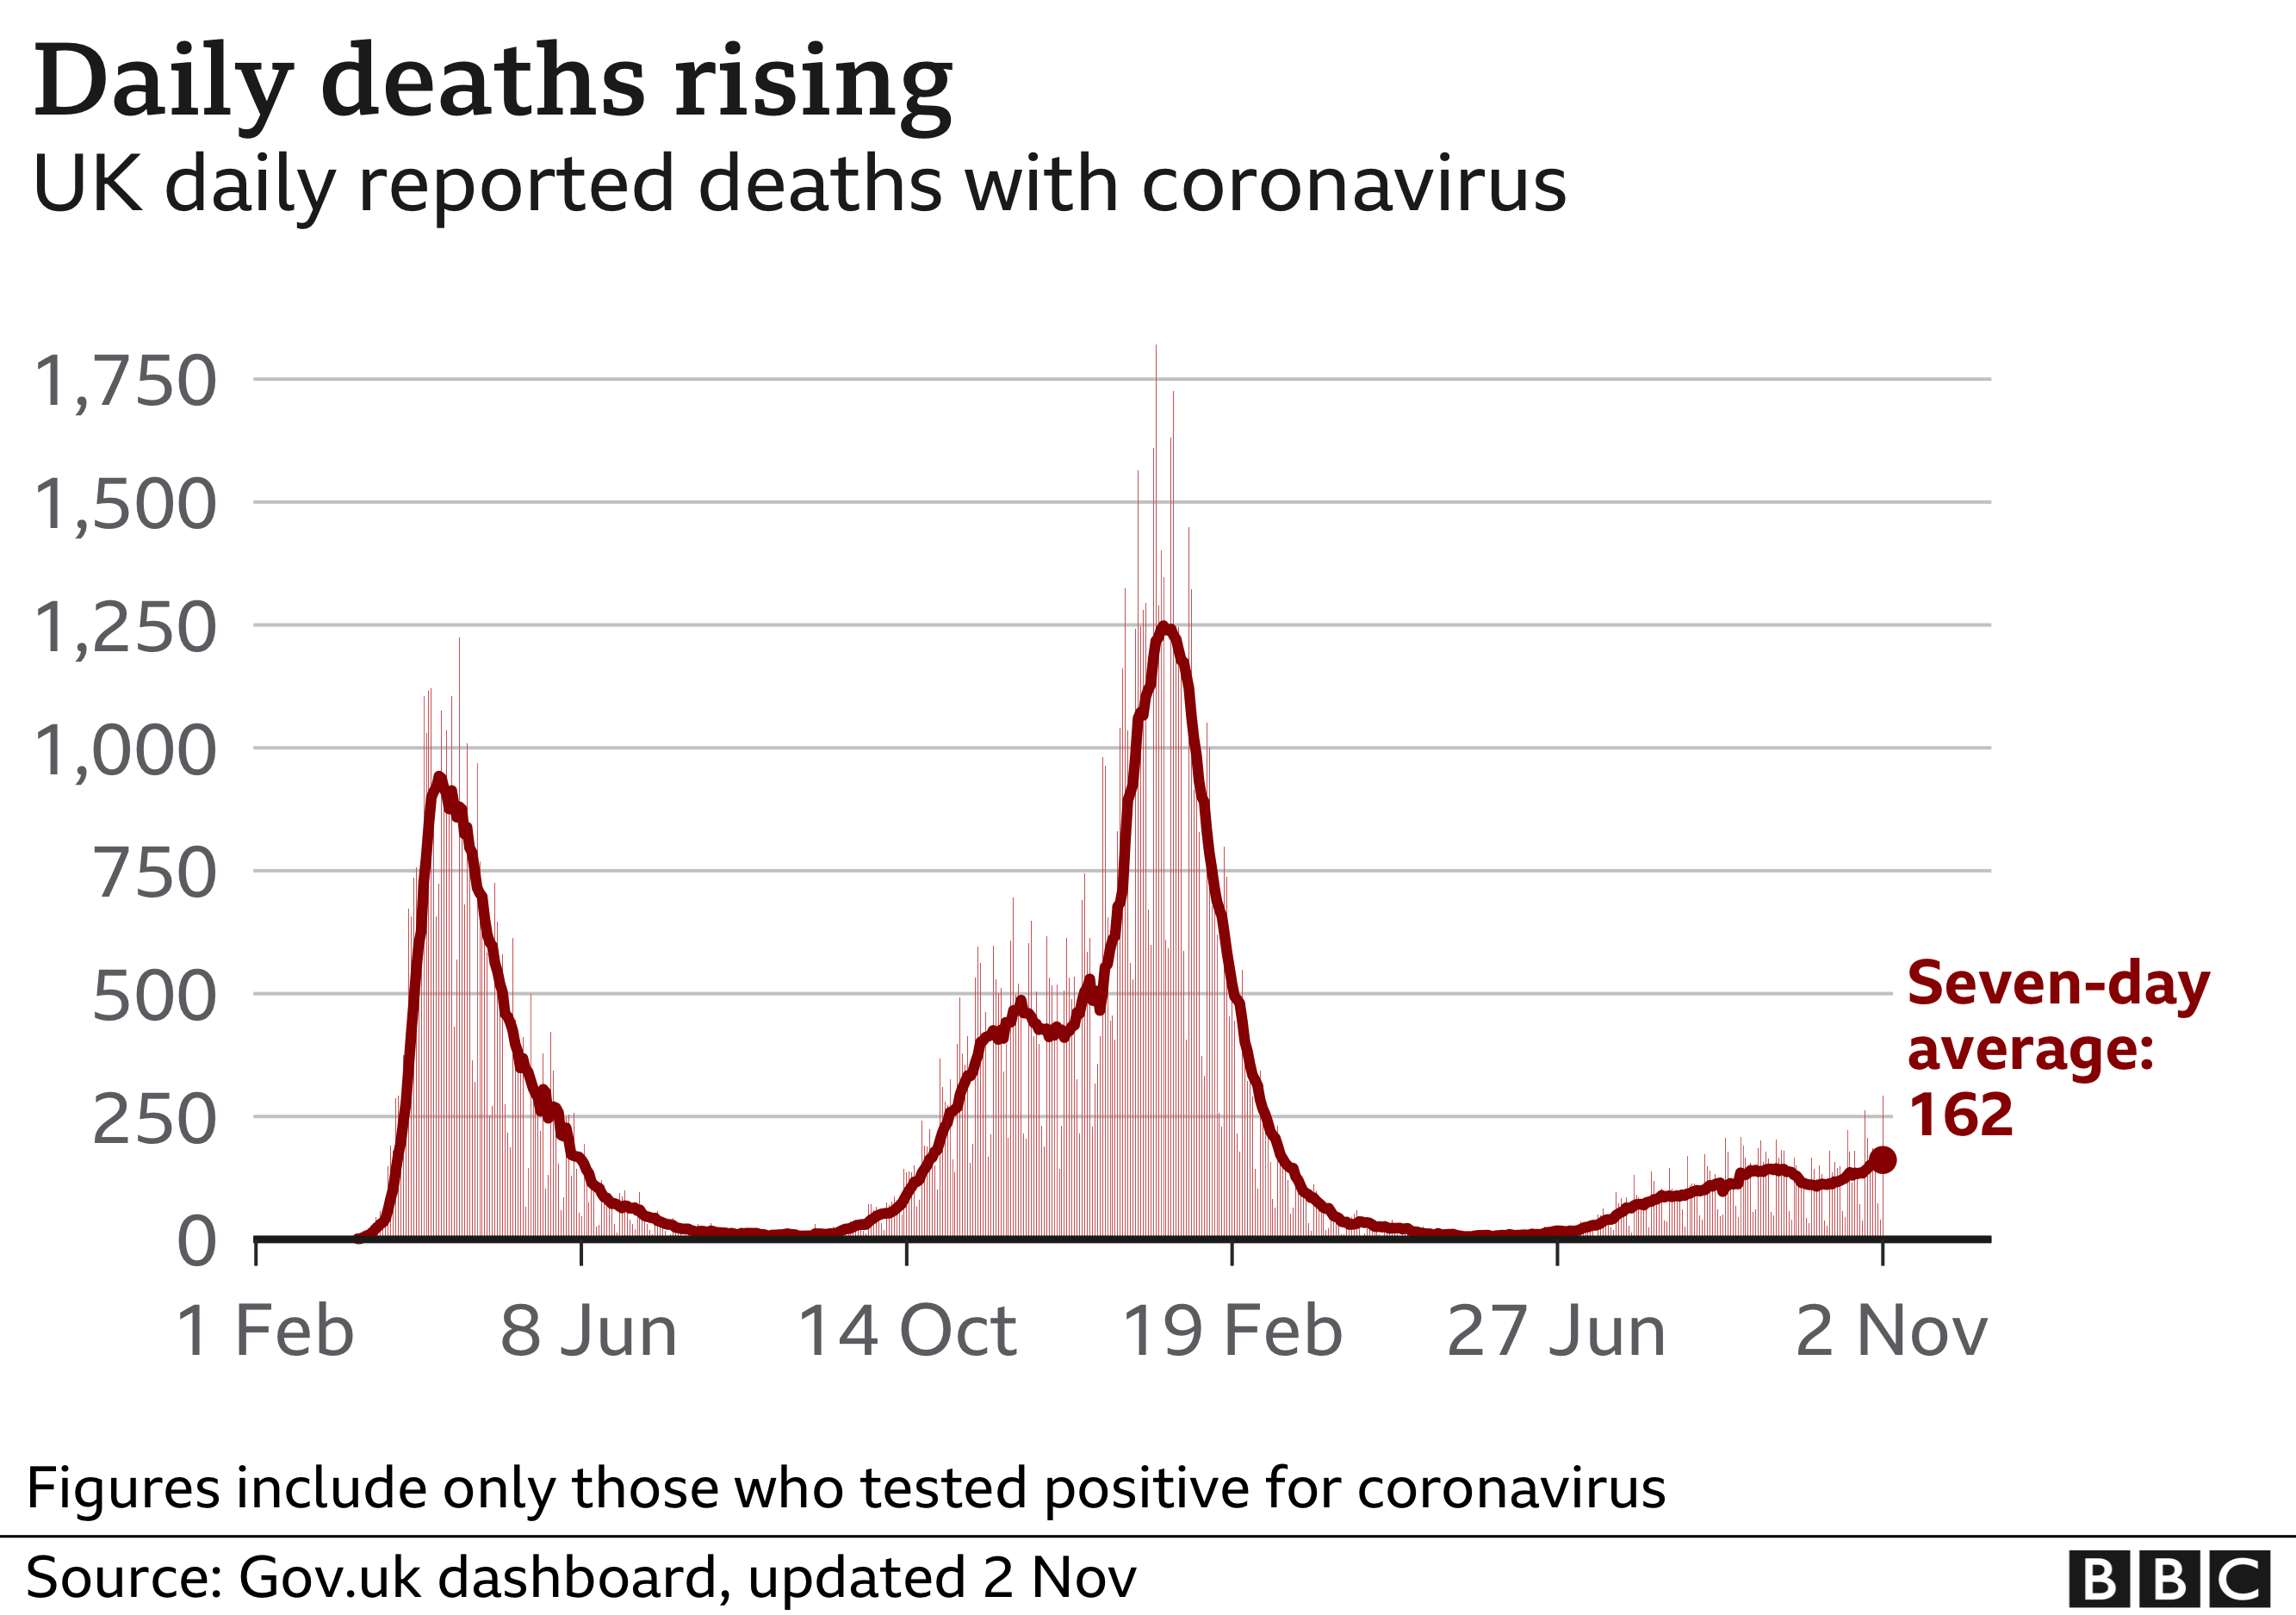
Recent rise in daily deaths
There were 293 deaths within 28 days of a positive test reported on Tuesday - but data issues mean some deaths that should have been reported on Monday have been included in the latest figure.
Of those deaths, 255 were in England, 26 were in Scotland, 10 were in Wales and two were in Northern Ireland.
England has seen the majority of UK deaths since the pandemic began, with more than 122,000 so far.
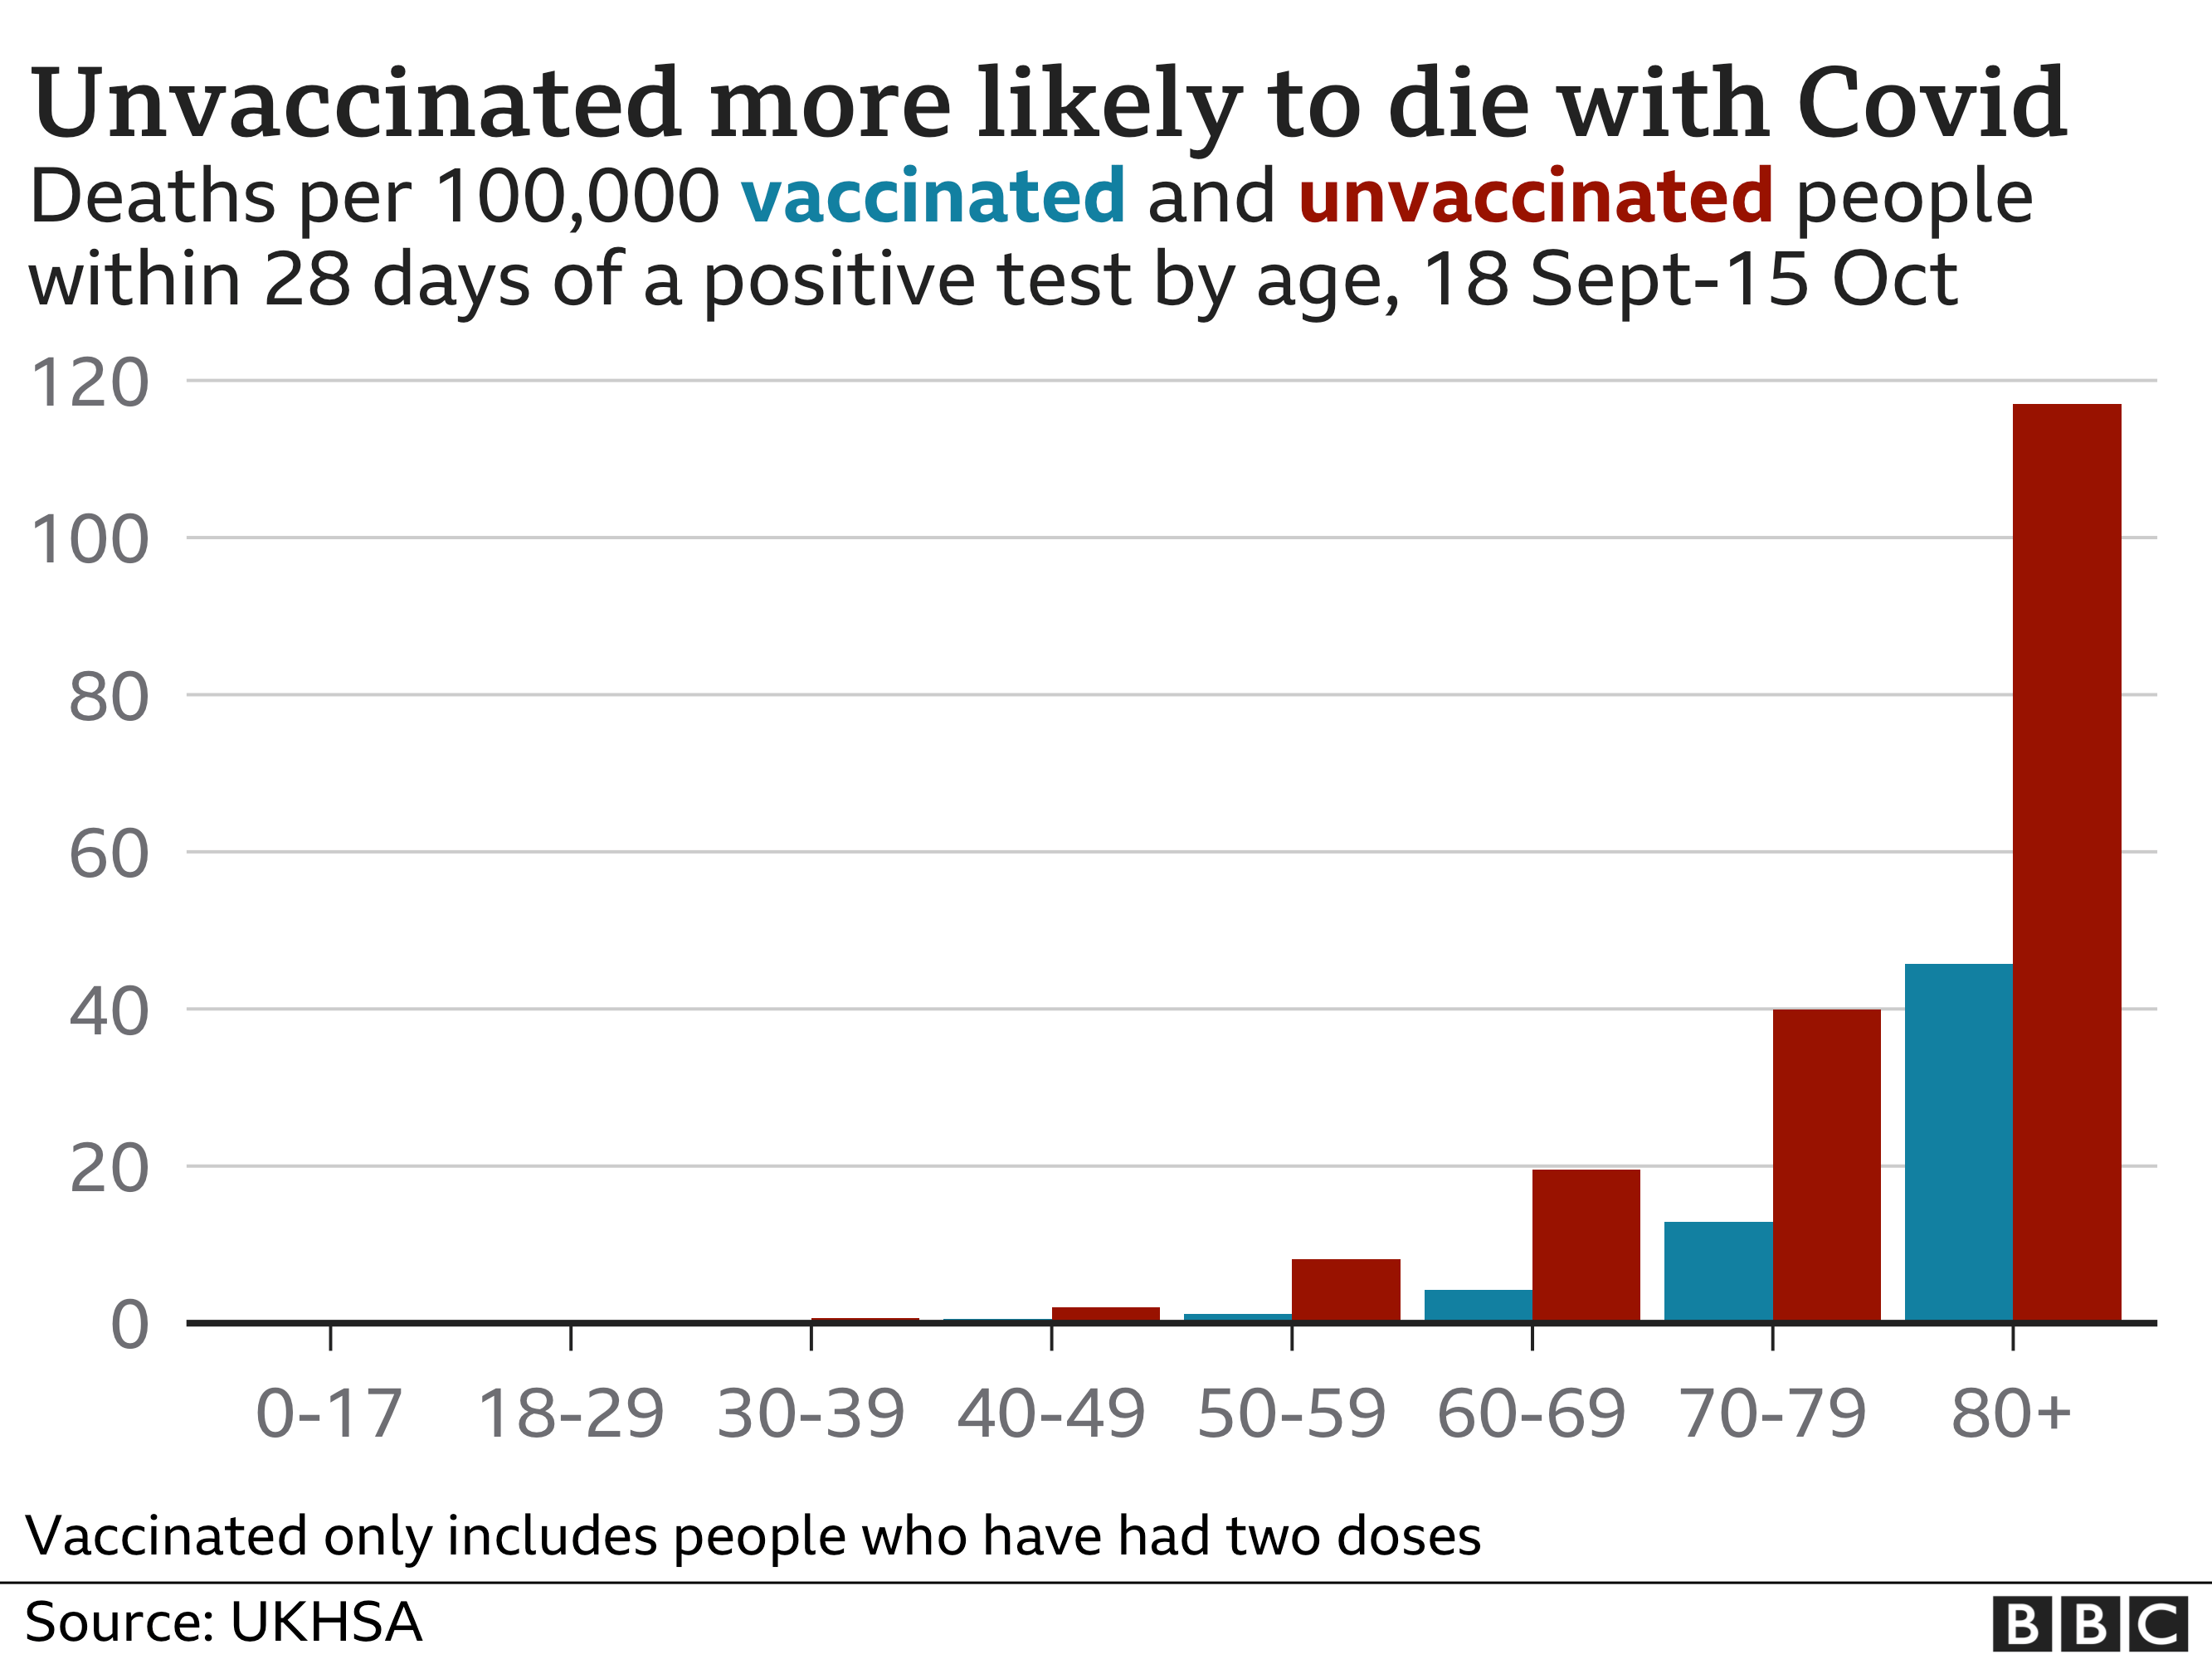
Prof Chris Whitty, the UK government's chief medical adviser, has urged those not yet vaccinated to get the jab as soon as possible, saying: "Winter is coming and people really should take this seriously."
He said data showed that in every age bracket there is a "very substantially smaller" risk of being admitted to hospital and dying with Covid for people who have been vaccinated.
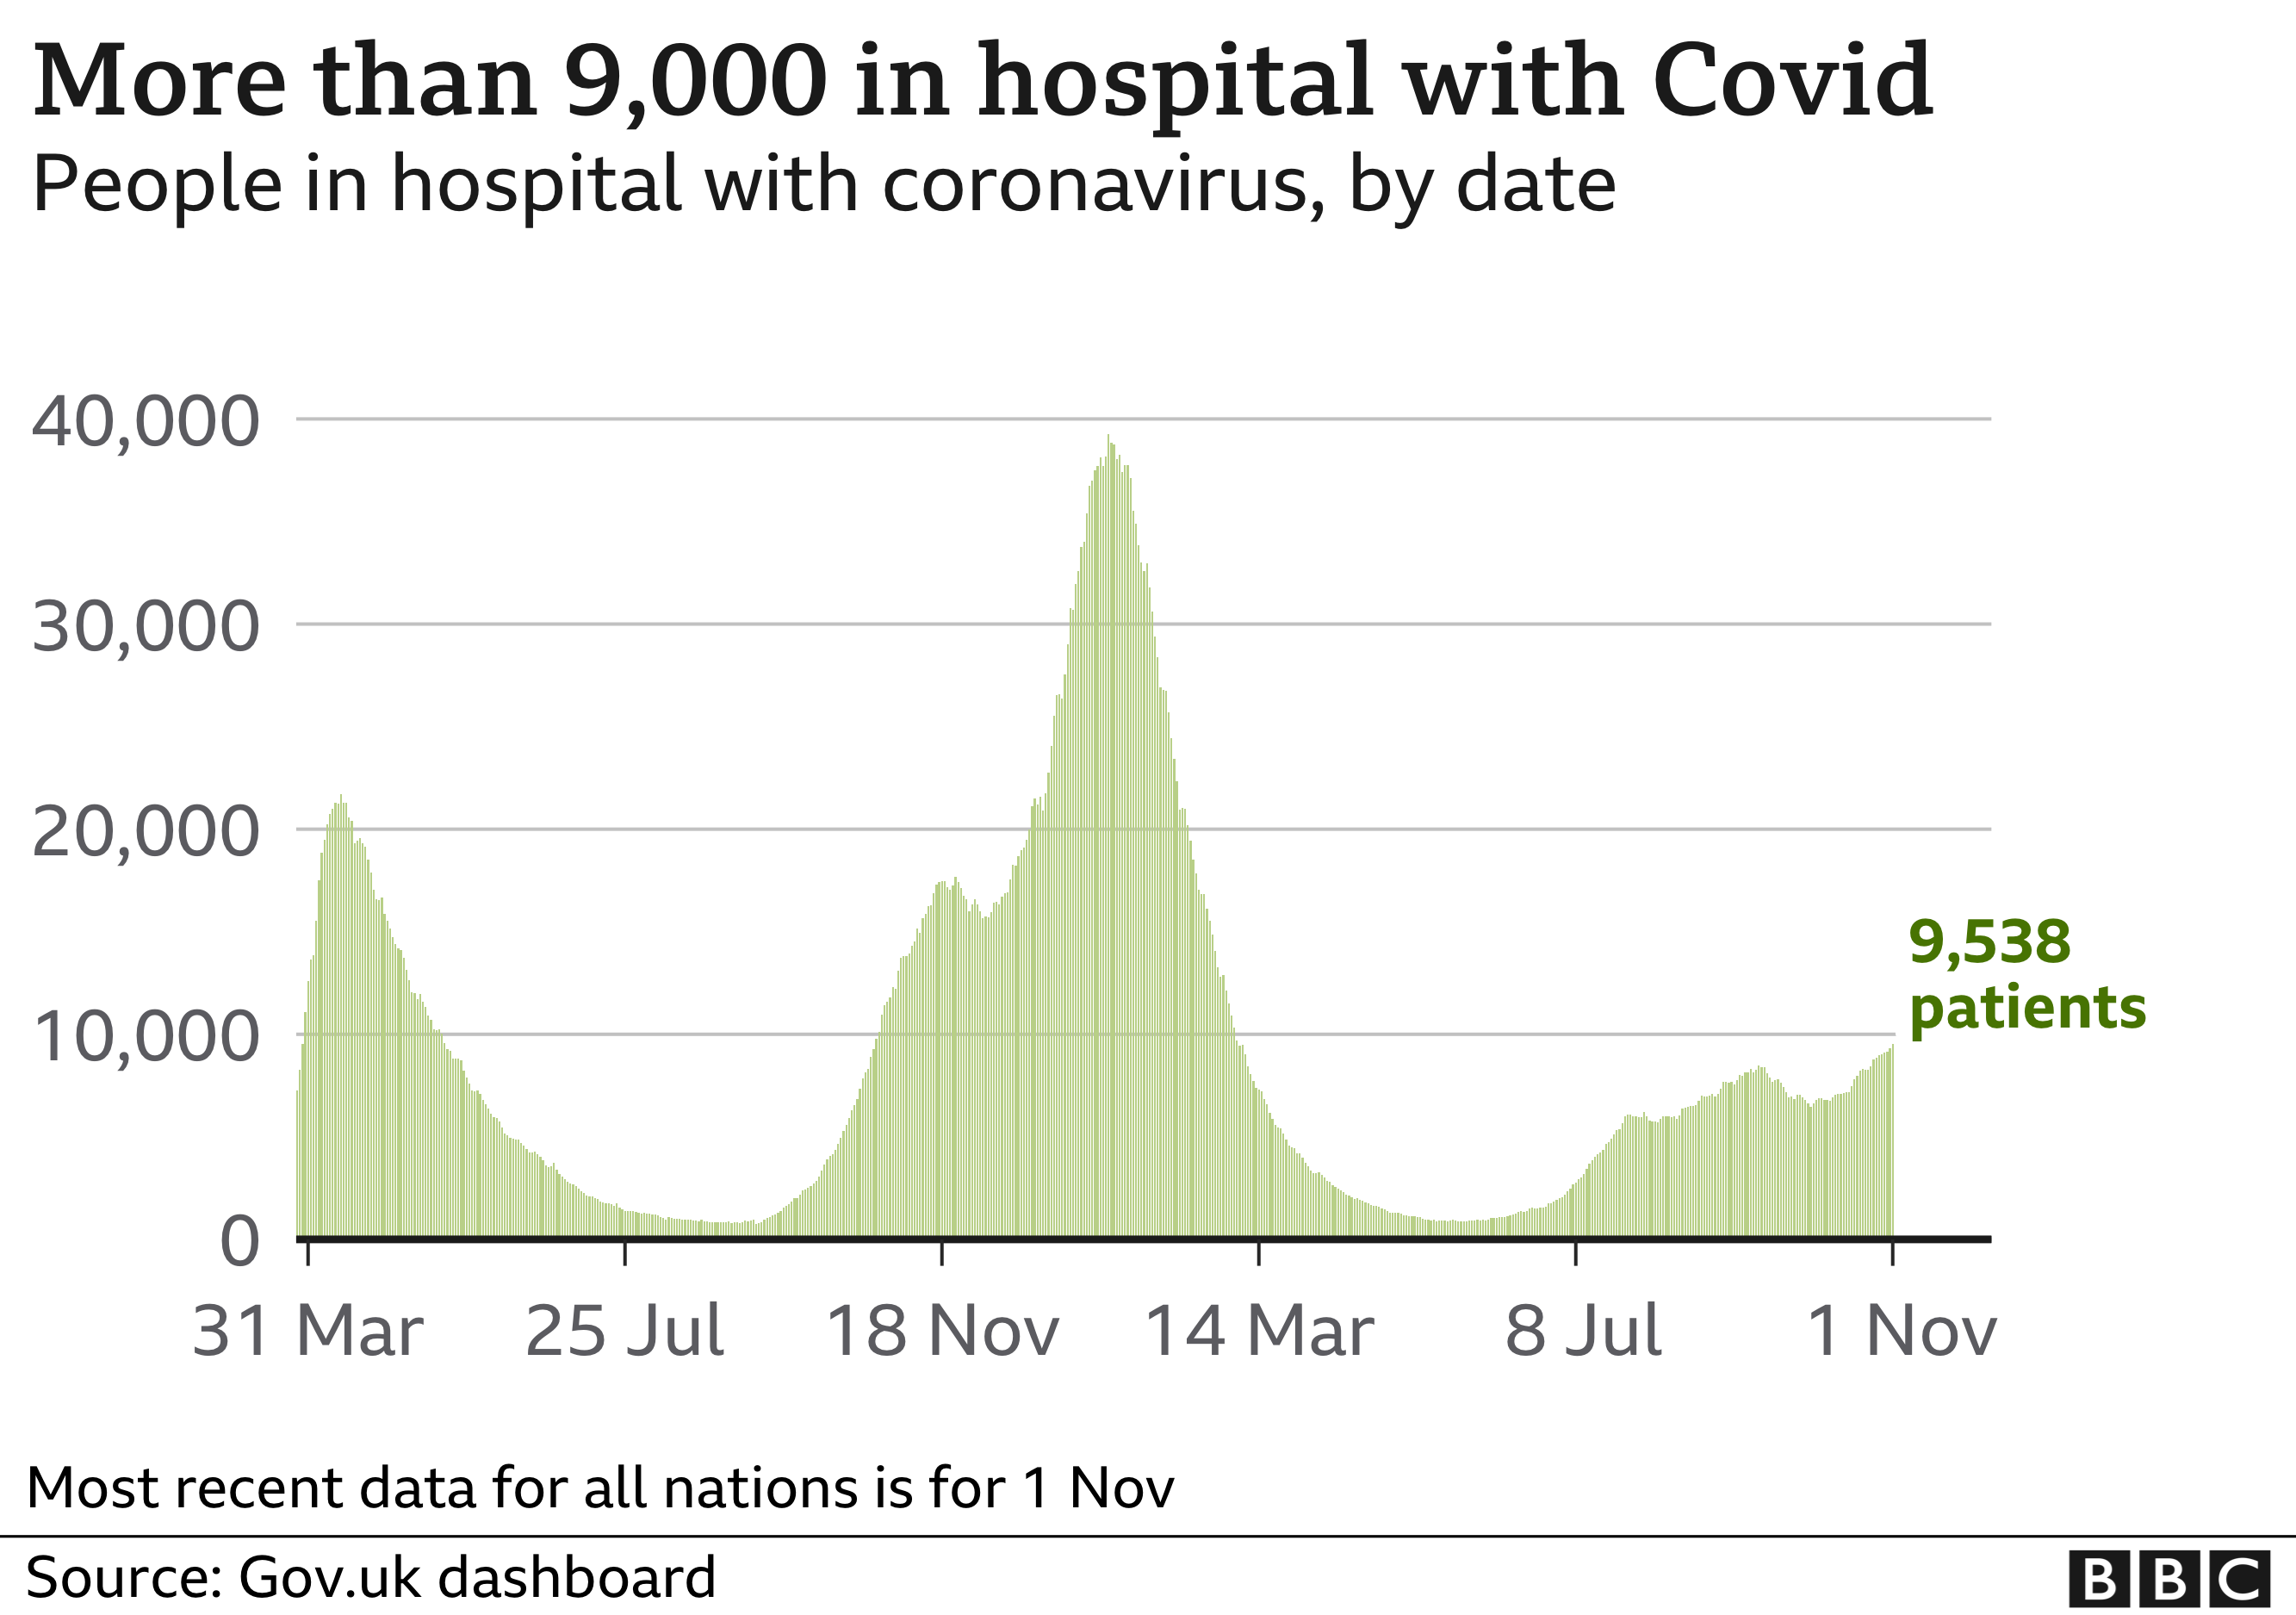
Hospital numbers rising
The most recent government figures show 9,538 people with coronavirus in hospital in the UK, up from 8,762 a week earlier.
Although numbers of hospital patients with coronavirus are higher than they were over the summer, they are far below the peak of nearly 40,000 people back in January.
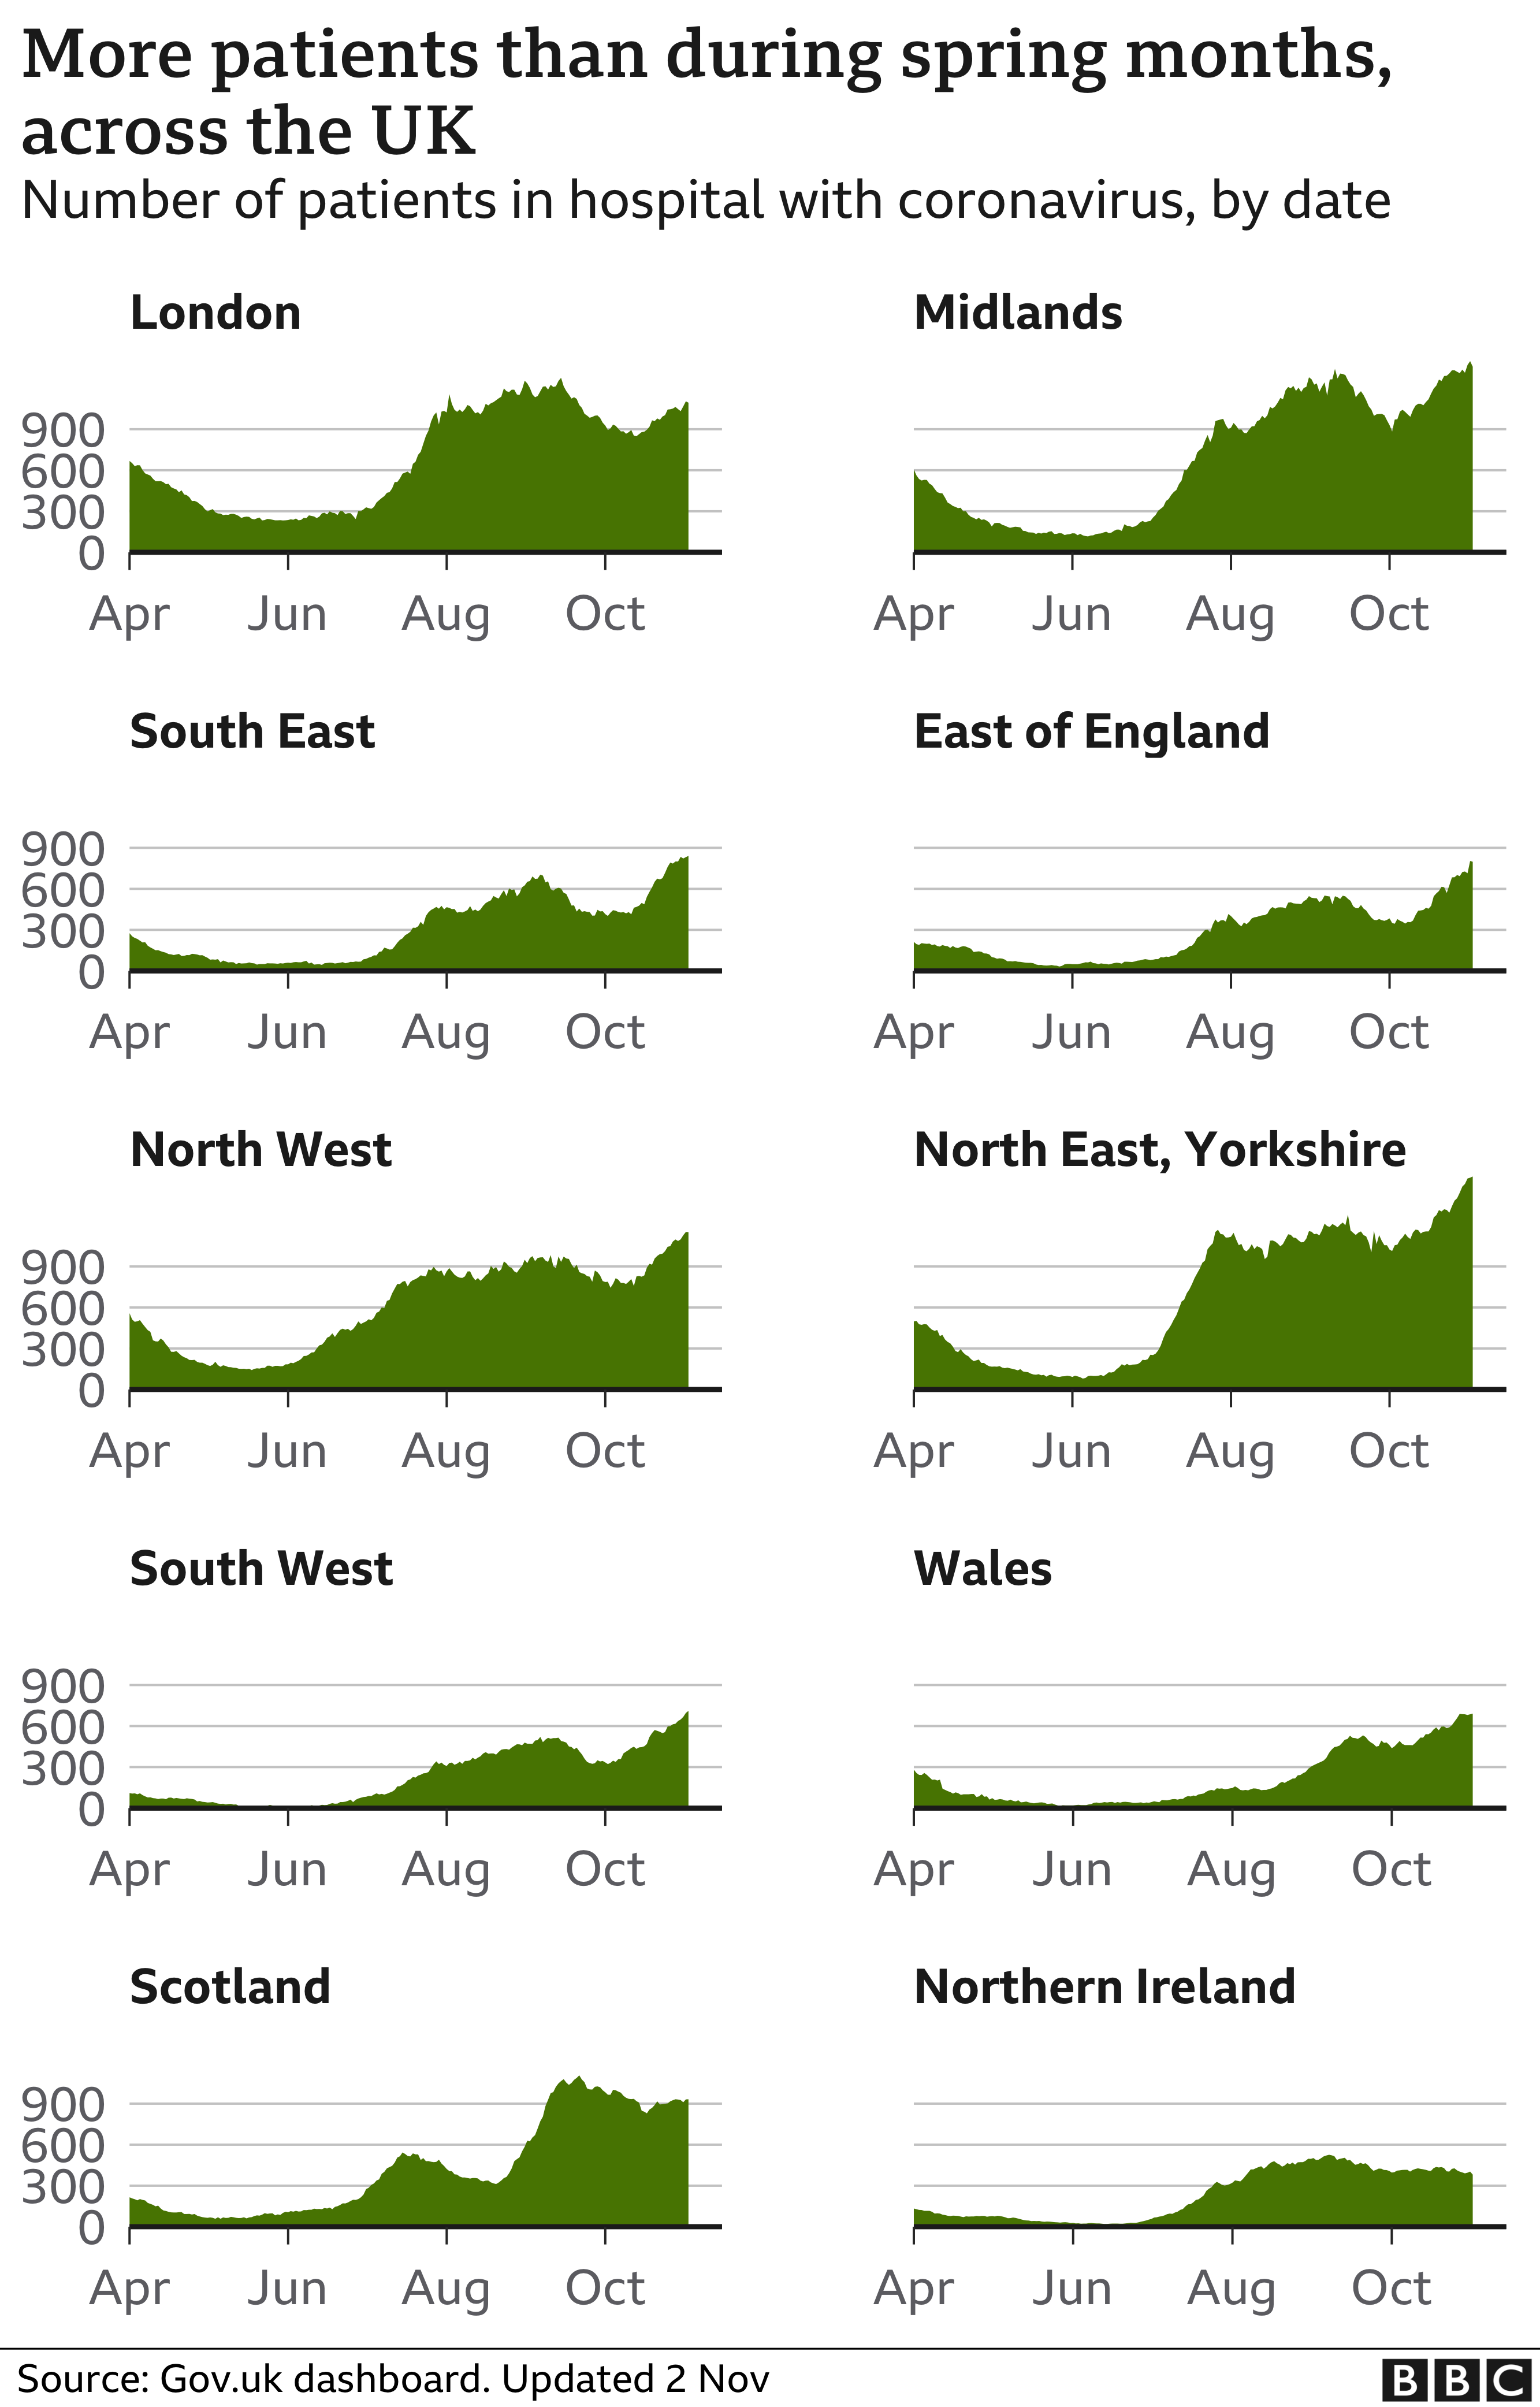
Looking at Covid patients in hospital by region, the numbers are higher than in the summer and are now once again rising in most regions.
Death toll could be over 160,000
When looking at the overall death toll from coronavirus, official figures count deaths in three different ways, each giving a slightly different number.
First, government figures - the ones reported each day - count people who died within 28 days of testing positive for coronavirus. This figure is now more than 140,000.
According to the latest ONS figures, the UK has now seen more than 160,000 deaths - that's all those deaths where coronavirus was mentioned on the death certificate even if the person had not been tested for the virus.
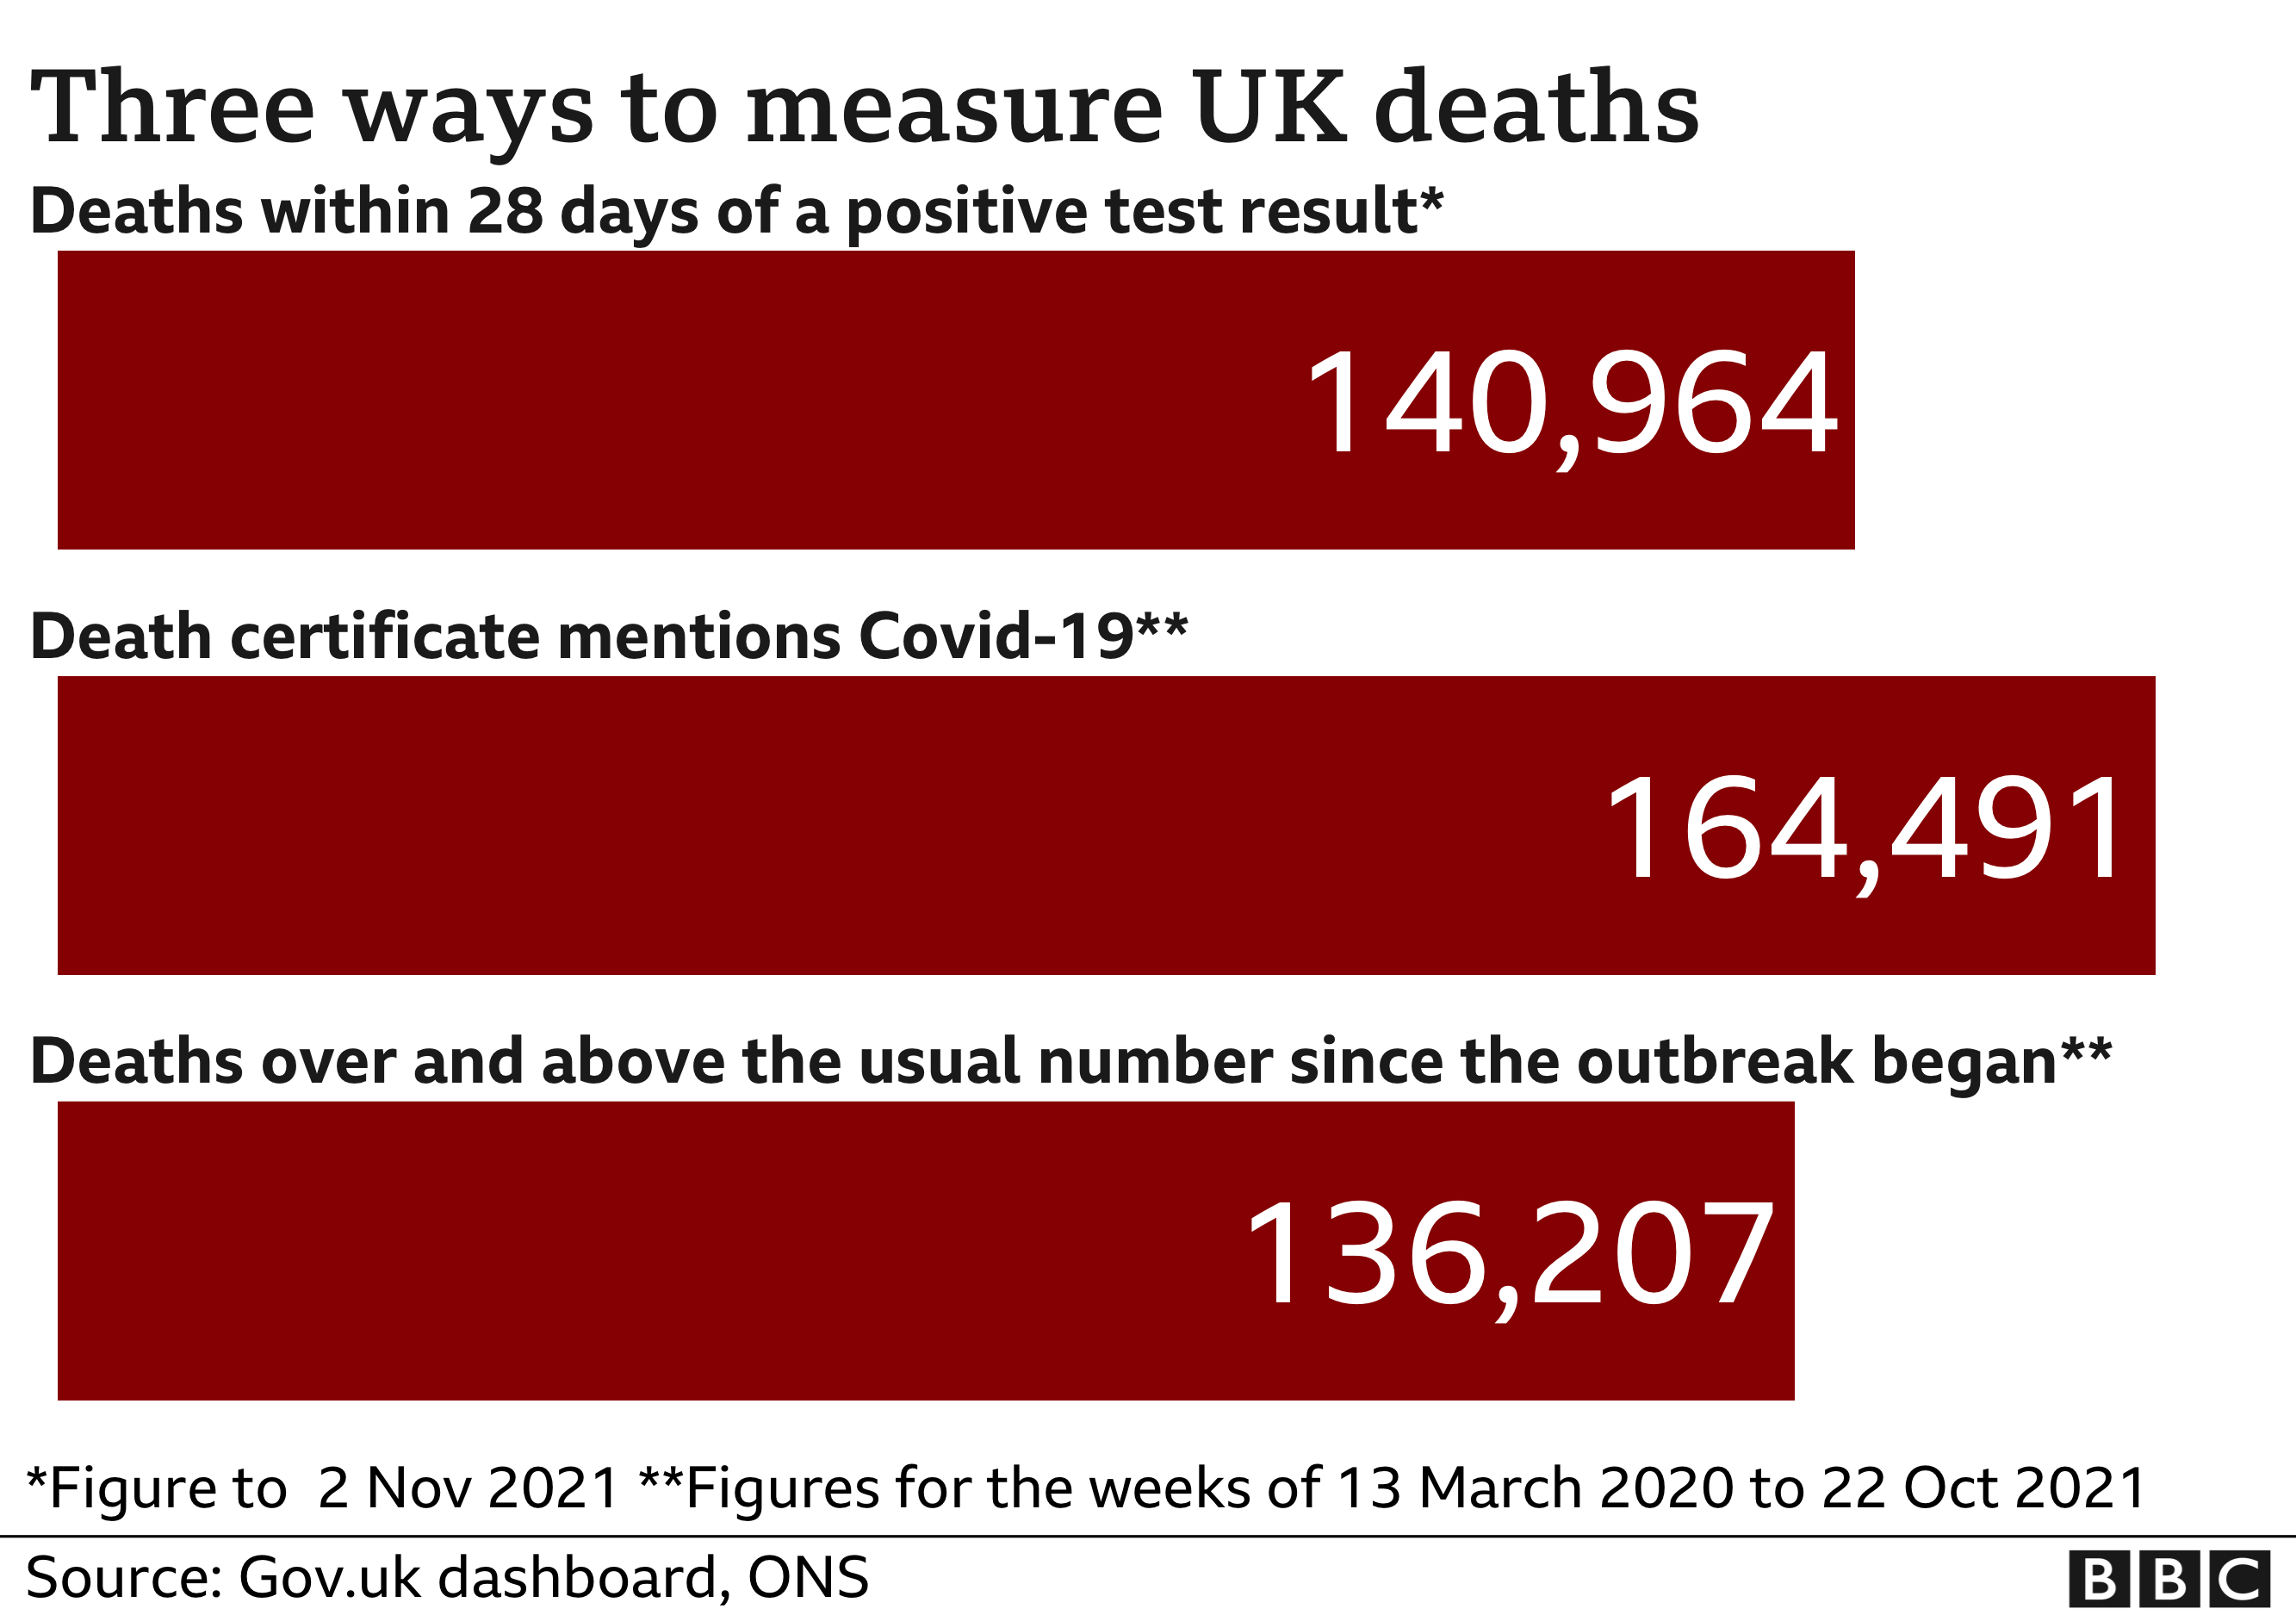
The third measure counts all deaths over and above the usual number at the time of year - that figure was approaching 134,500 as of 22 October.
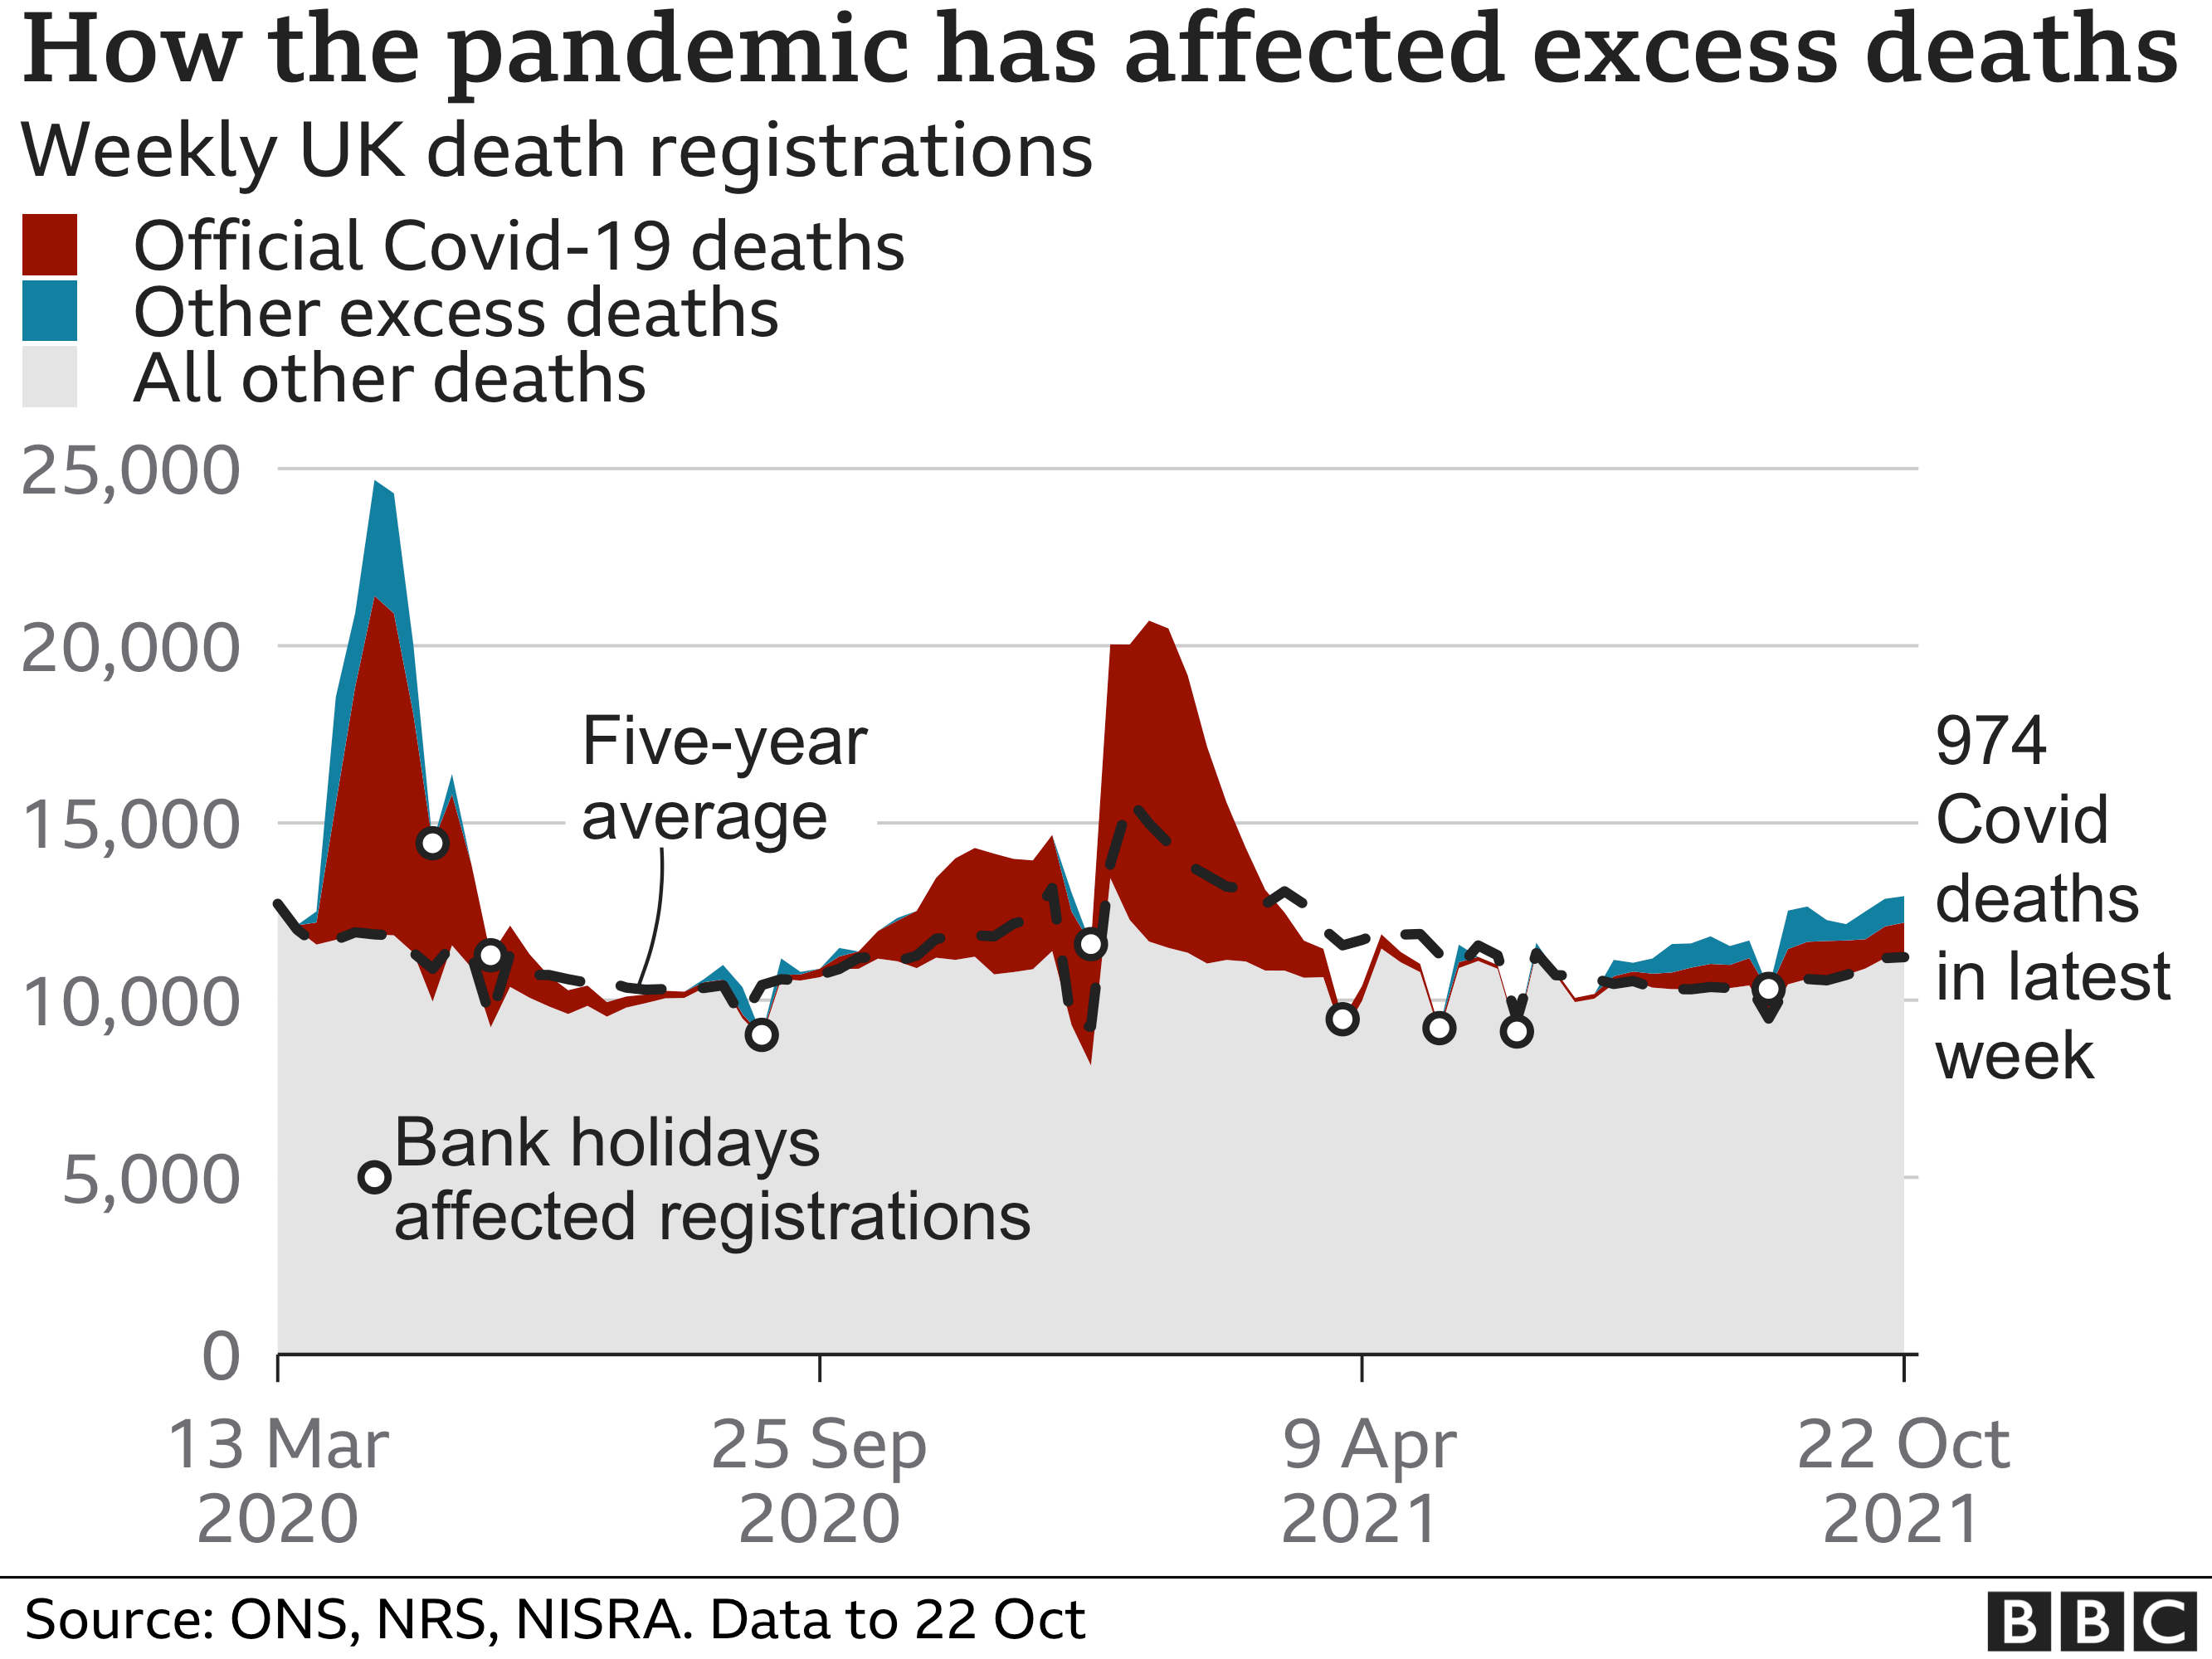
In total, there were 12,935 deaths registered in the week to 22 October, which was 1,722 more than the five-year average.
Of the total deaths, 974 were related to coronavirus, 82 more than the previous week.
There have been more deaths involving Covid than "excess" deaths since the start of the pandemic, meaning non-Covid deaths must be below usual levels.
This could be down to the milder flu season last winter - due to less travel and more social distancing - and because some people who might have died for other reasons had there been no pandemic, died of Covid.

- GLOBAL TRACKER: Where are virus hotspots?
- COVID SYMPTOMS: What are they?
- SOCIAL DISTANCING: What are the UK rules?
- COVID IMMUNITY: Can you catch it twice?

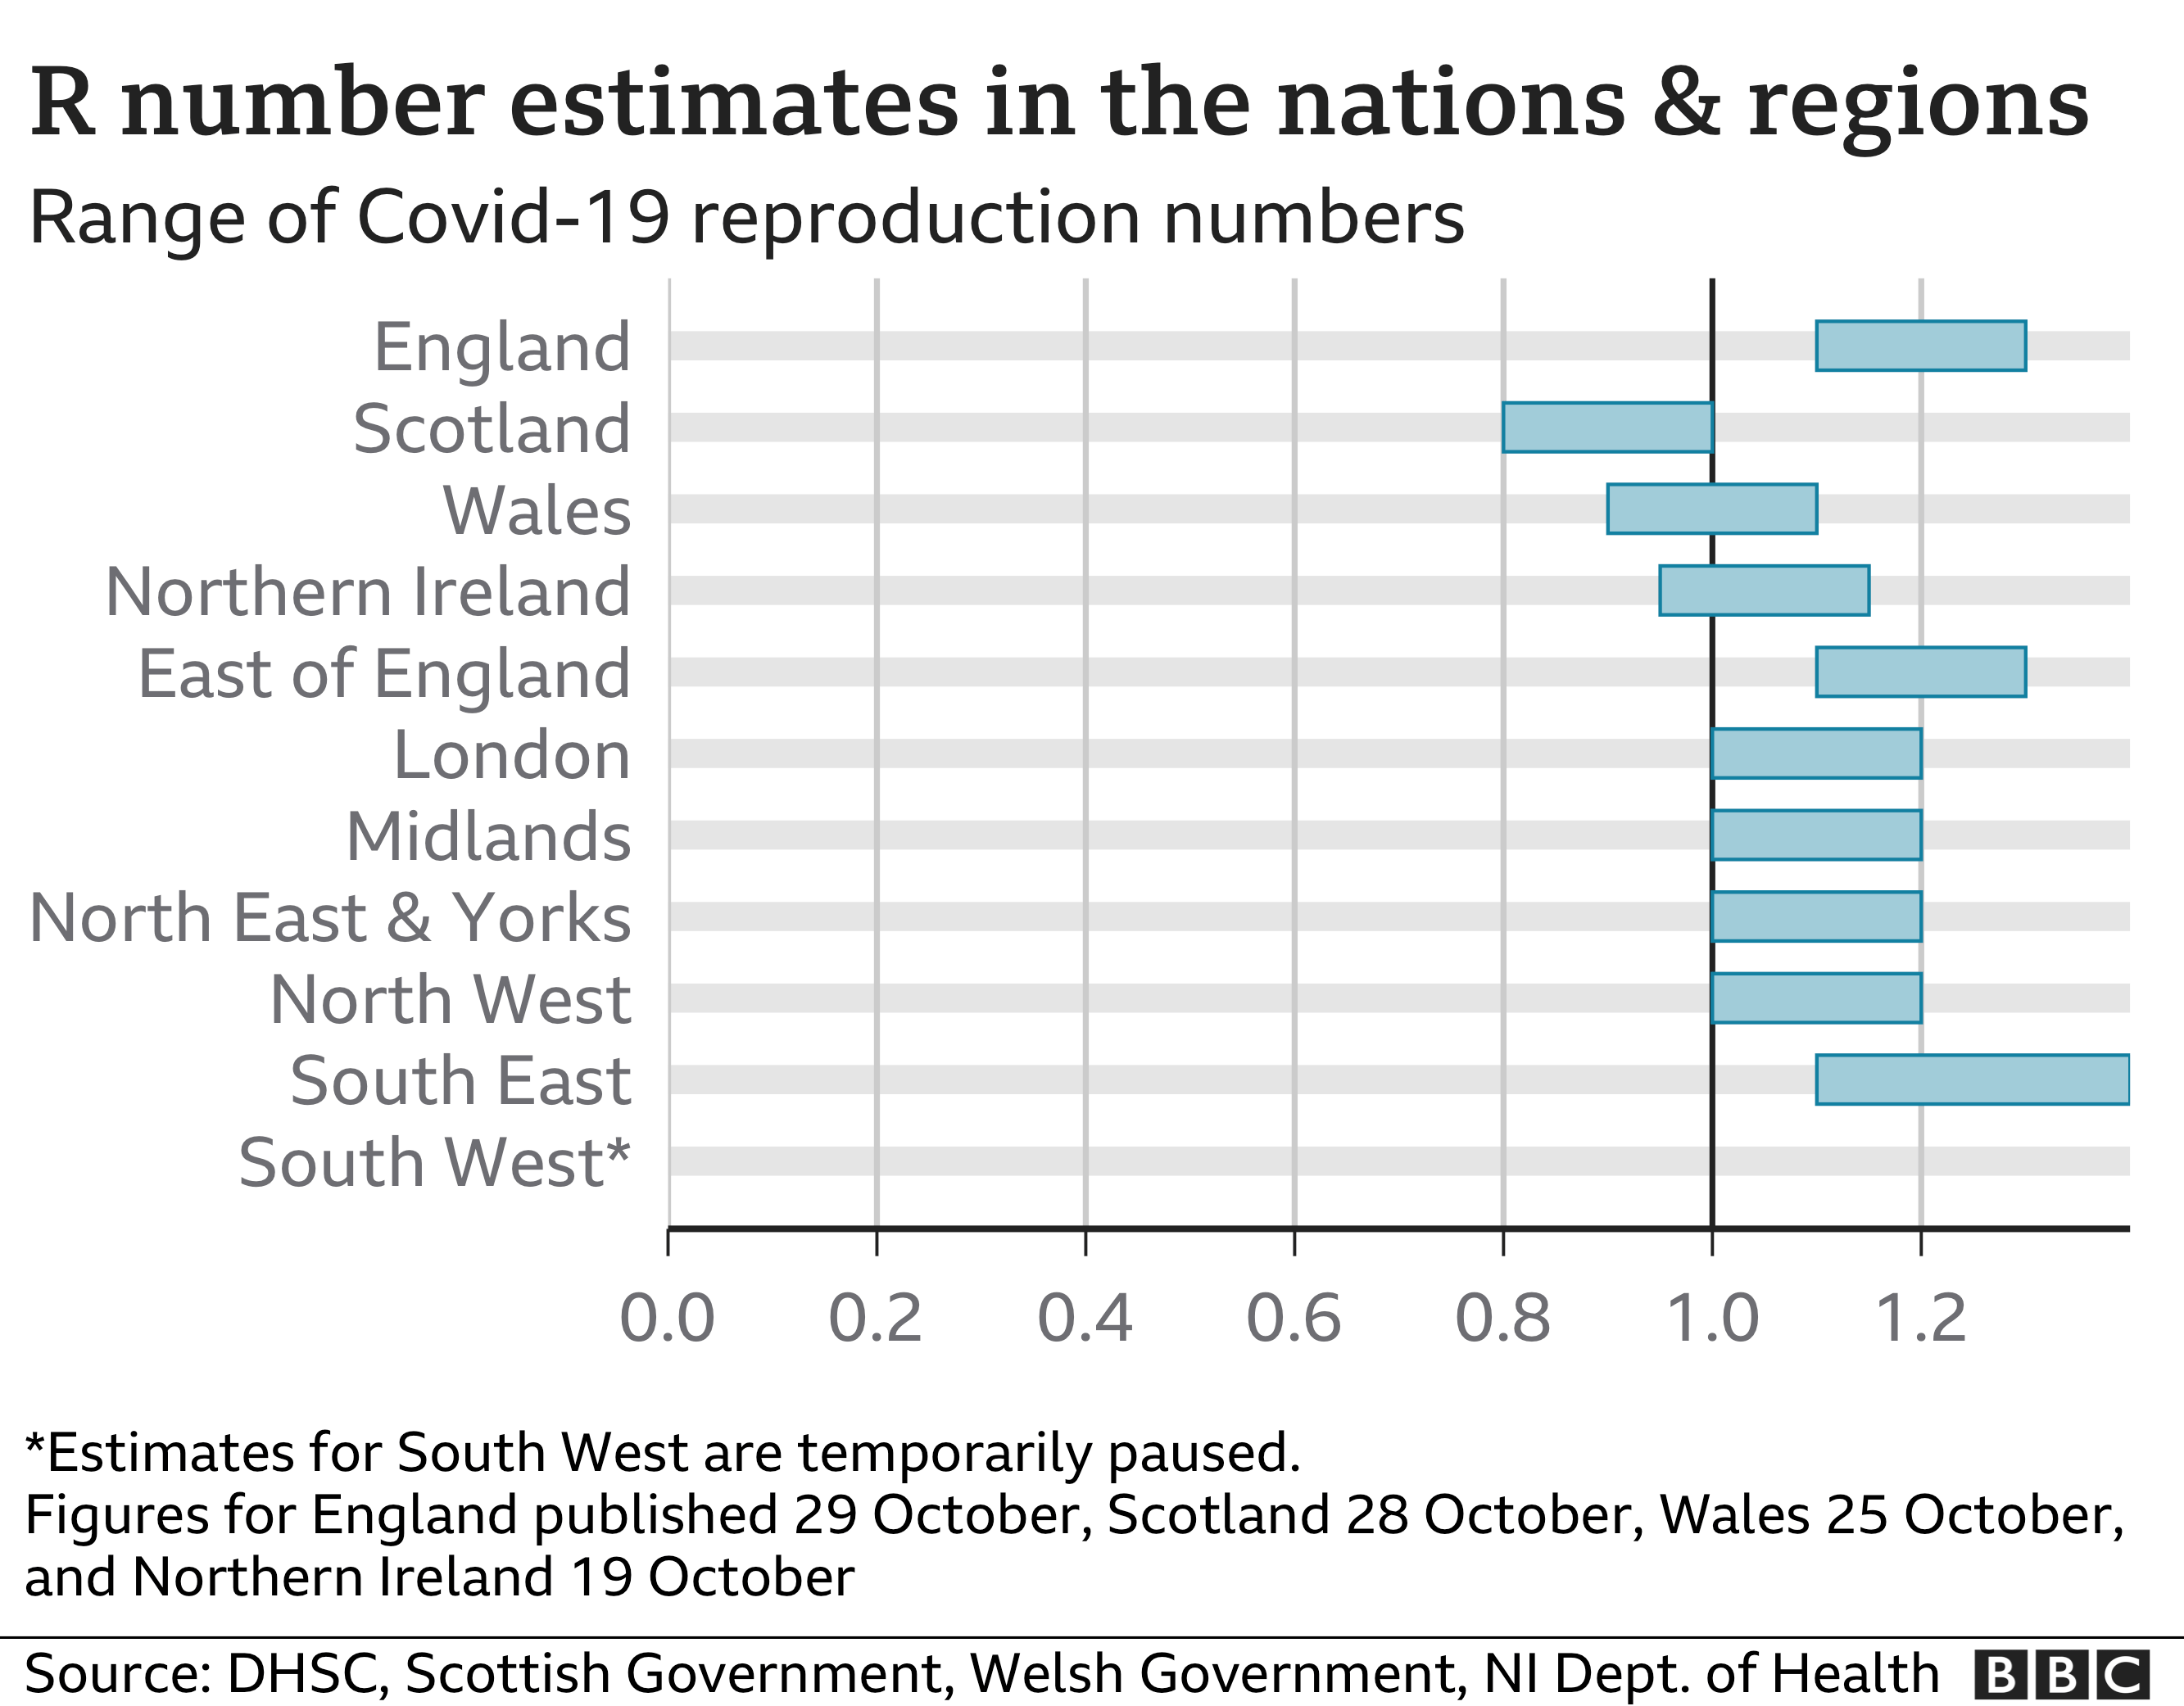
What is the R number?
The "R number" is the average number of people an infected person will pass the disease on to.
If R is below one, then the number of people contracting the disease will fall; if it is above one, the number will grow.
The government has said in the past that the R number is one of the most important factors in making policy decisions.
The latest R number estimate for England is 1.1 to 1.3, while for Scotland it is 0.8 to 1.0, for Wales it is 0.9 to 1.1 and for Northern Ireland it is 0.95 to 1.15.
Related Topics
- Published
- 1 day ago
- Published
- 14 October
- Published
- 28 September