Covid-19 in the UK: How many coronavirus cases are there in my area?
By The Visual and Data Journalism Team
BBC News
- Published
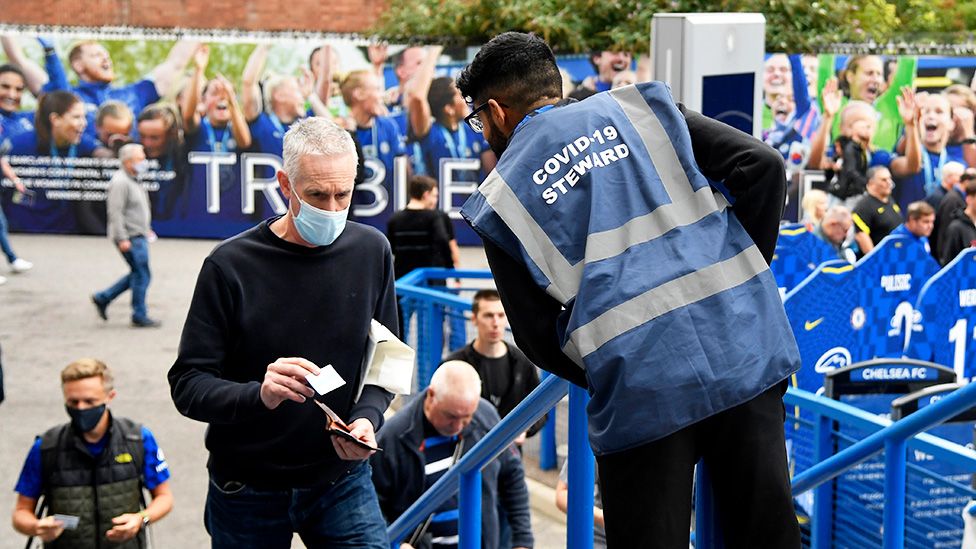 image source, Reuters
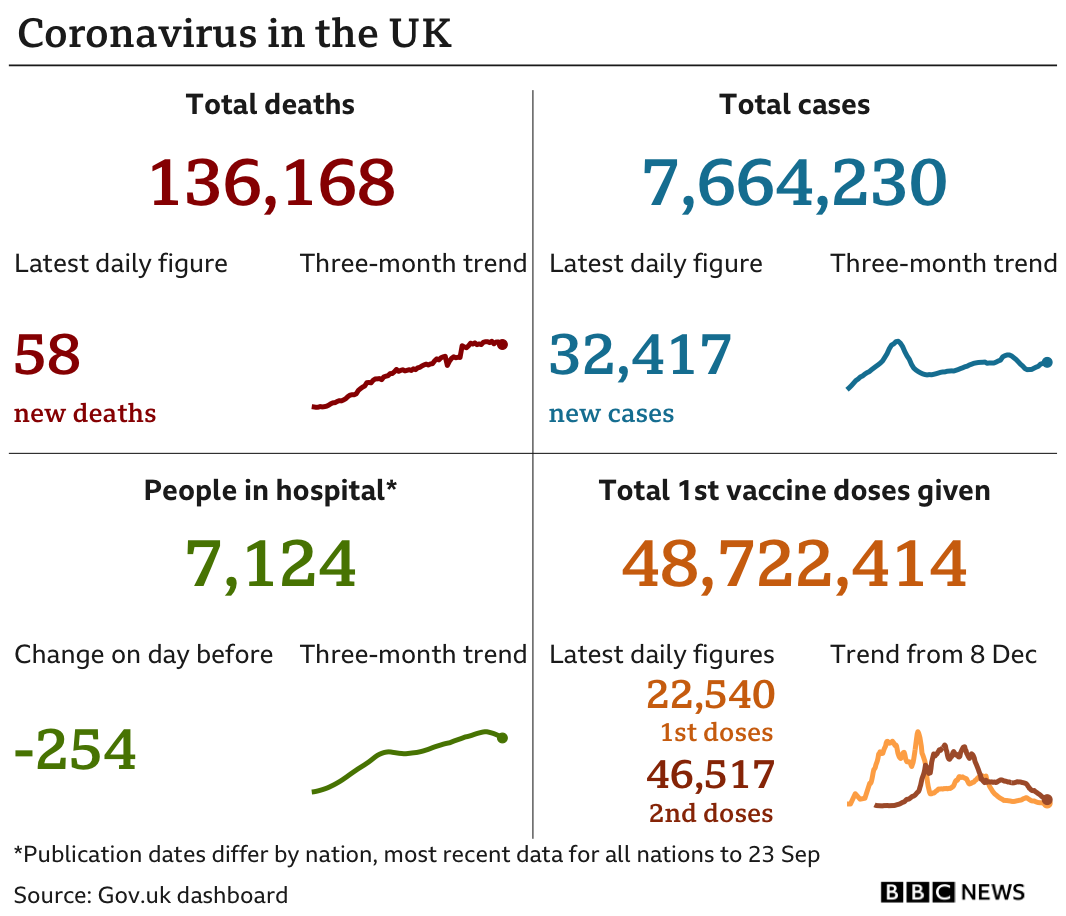
There have been more than 7.6 million confirmed cases of coronavirus in the UK and 136,000 people have died, government figures show.
However, these figures include only people who have died within 28 days of testing positive for coronavirus.
So far, about 90% of people aged 16 and over in the UK have had their first dose of a coronavirus vaccine and 82% have had their second.


Find out how the pandemic has affected your area and how it compares with the national average:
A modern browser with JavaScript and a stable internet connection are required to view this interactive.
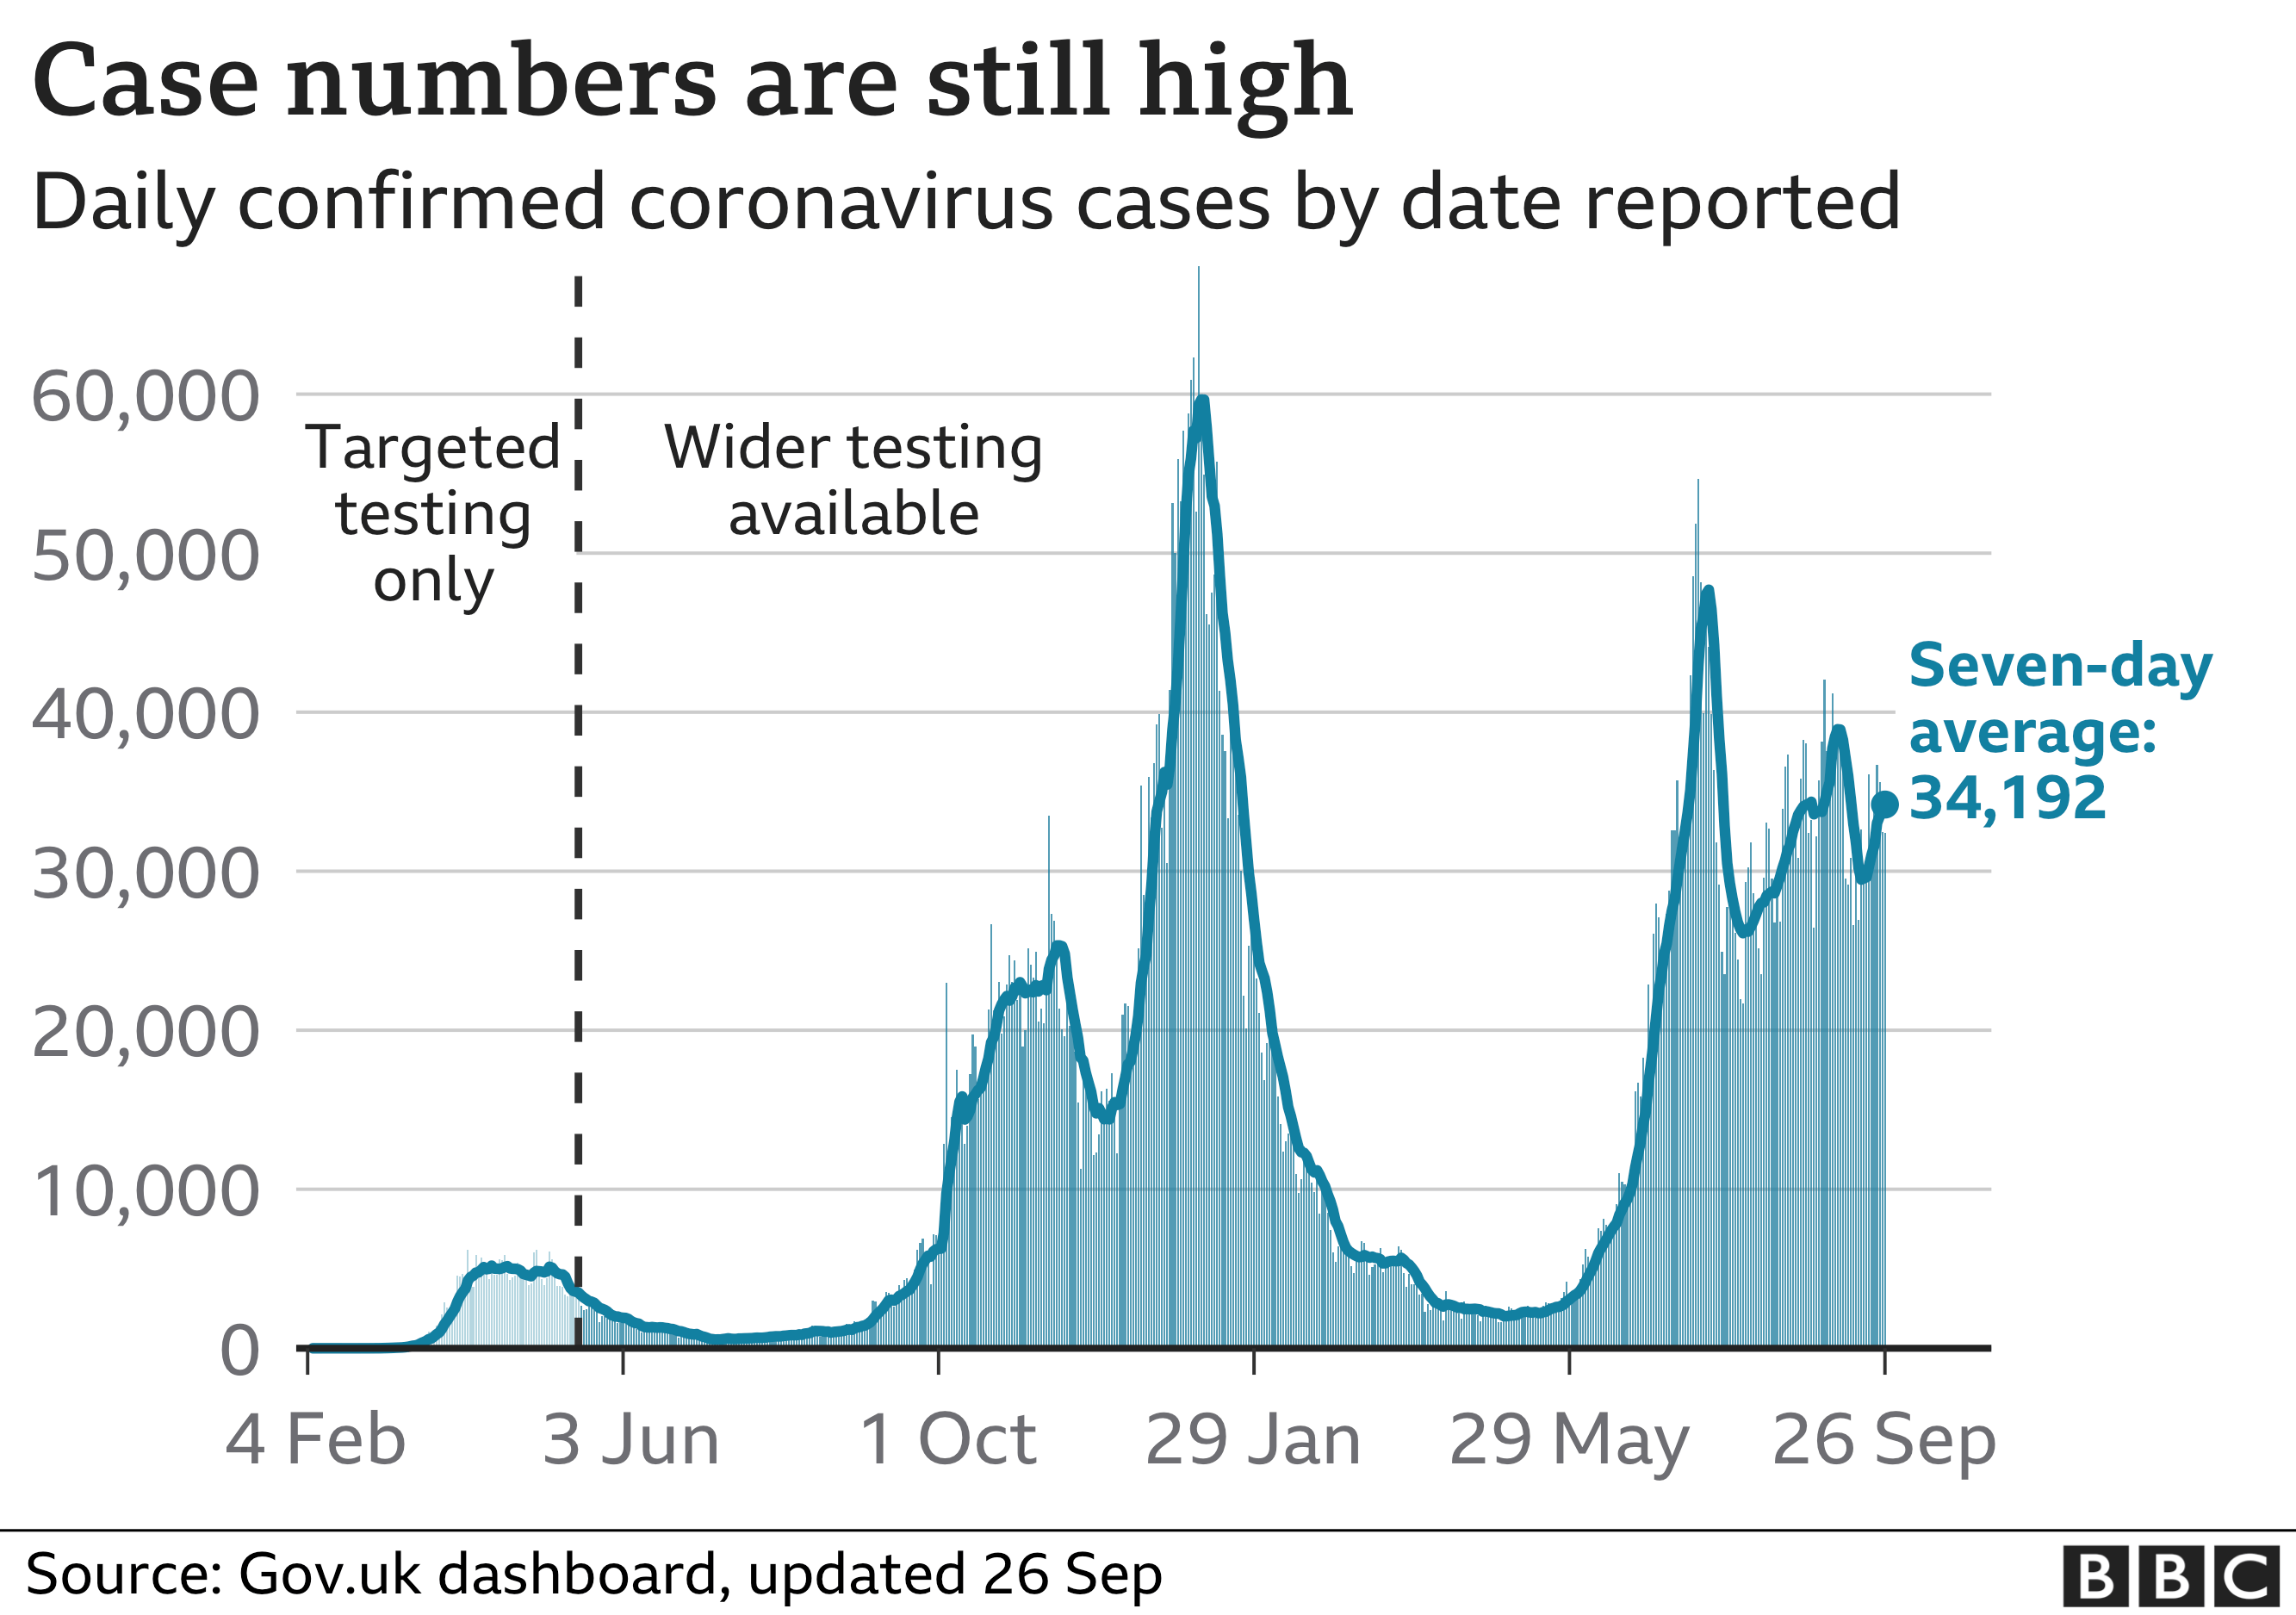
Daily cases remain high
After falling at the end of July, the average number of daily confirmed cases climbed and fell a number of times during August and early September. The last few days have seen numbers creep up again.
A further 32,417 confirmed cases were announced on Sunday.
The recent spikes have been driven by the Delta variant, which spreads faster than the previously most common Kent variant (now named Alpha).
Prime Minister Boris Johnson has said the virus "still remains a risk" but that he was "confident we can protect the gains we've made together".
It is thought the infection rate in the first peak of the virus in spring last year was much higher than was evident from the reported number of cases. Testing capacity was then too limited to detect the true number of daily cases.
The red areas on the map below show the places currently seeing the highest number of cases per 100,000 people.
You can use our postcode look-up to check what the rules are where you live.
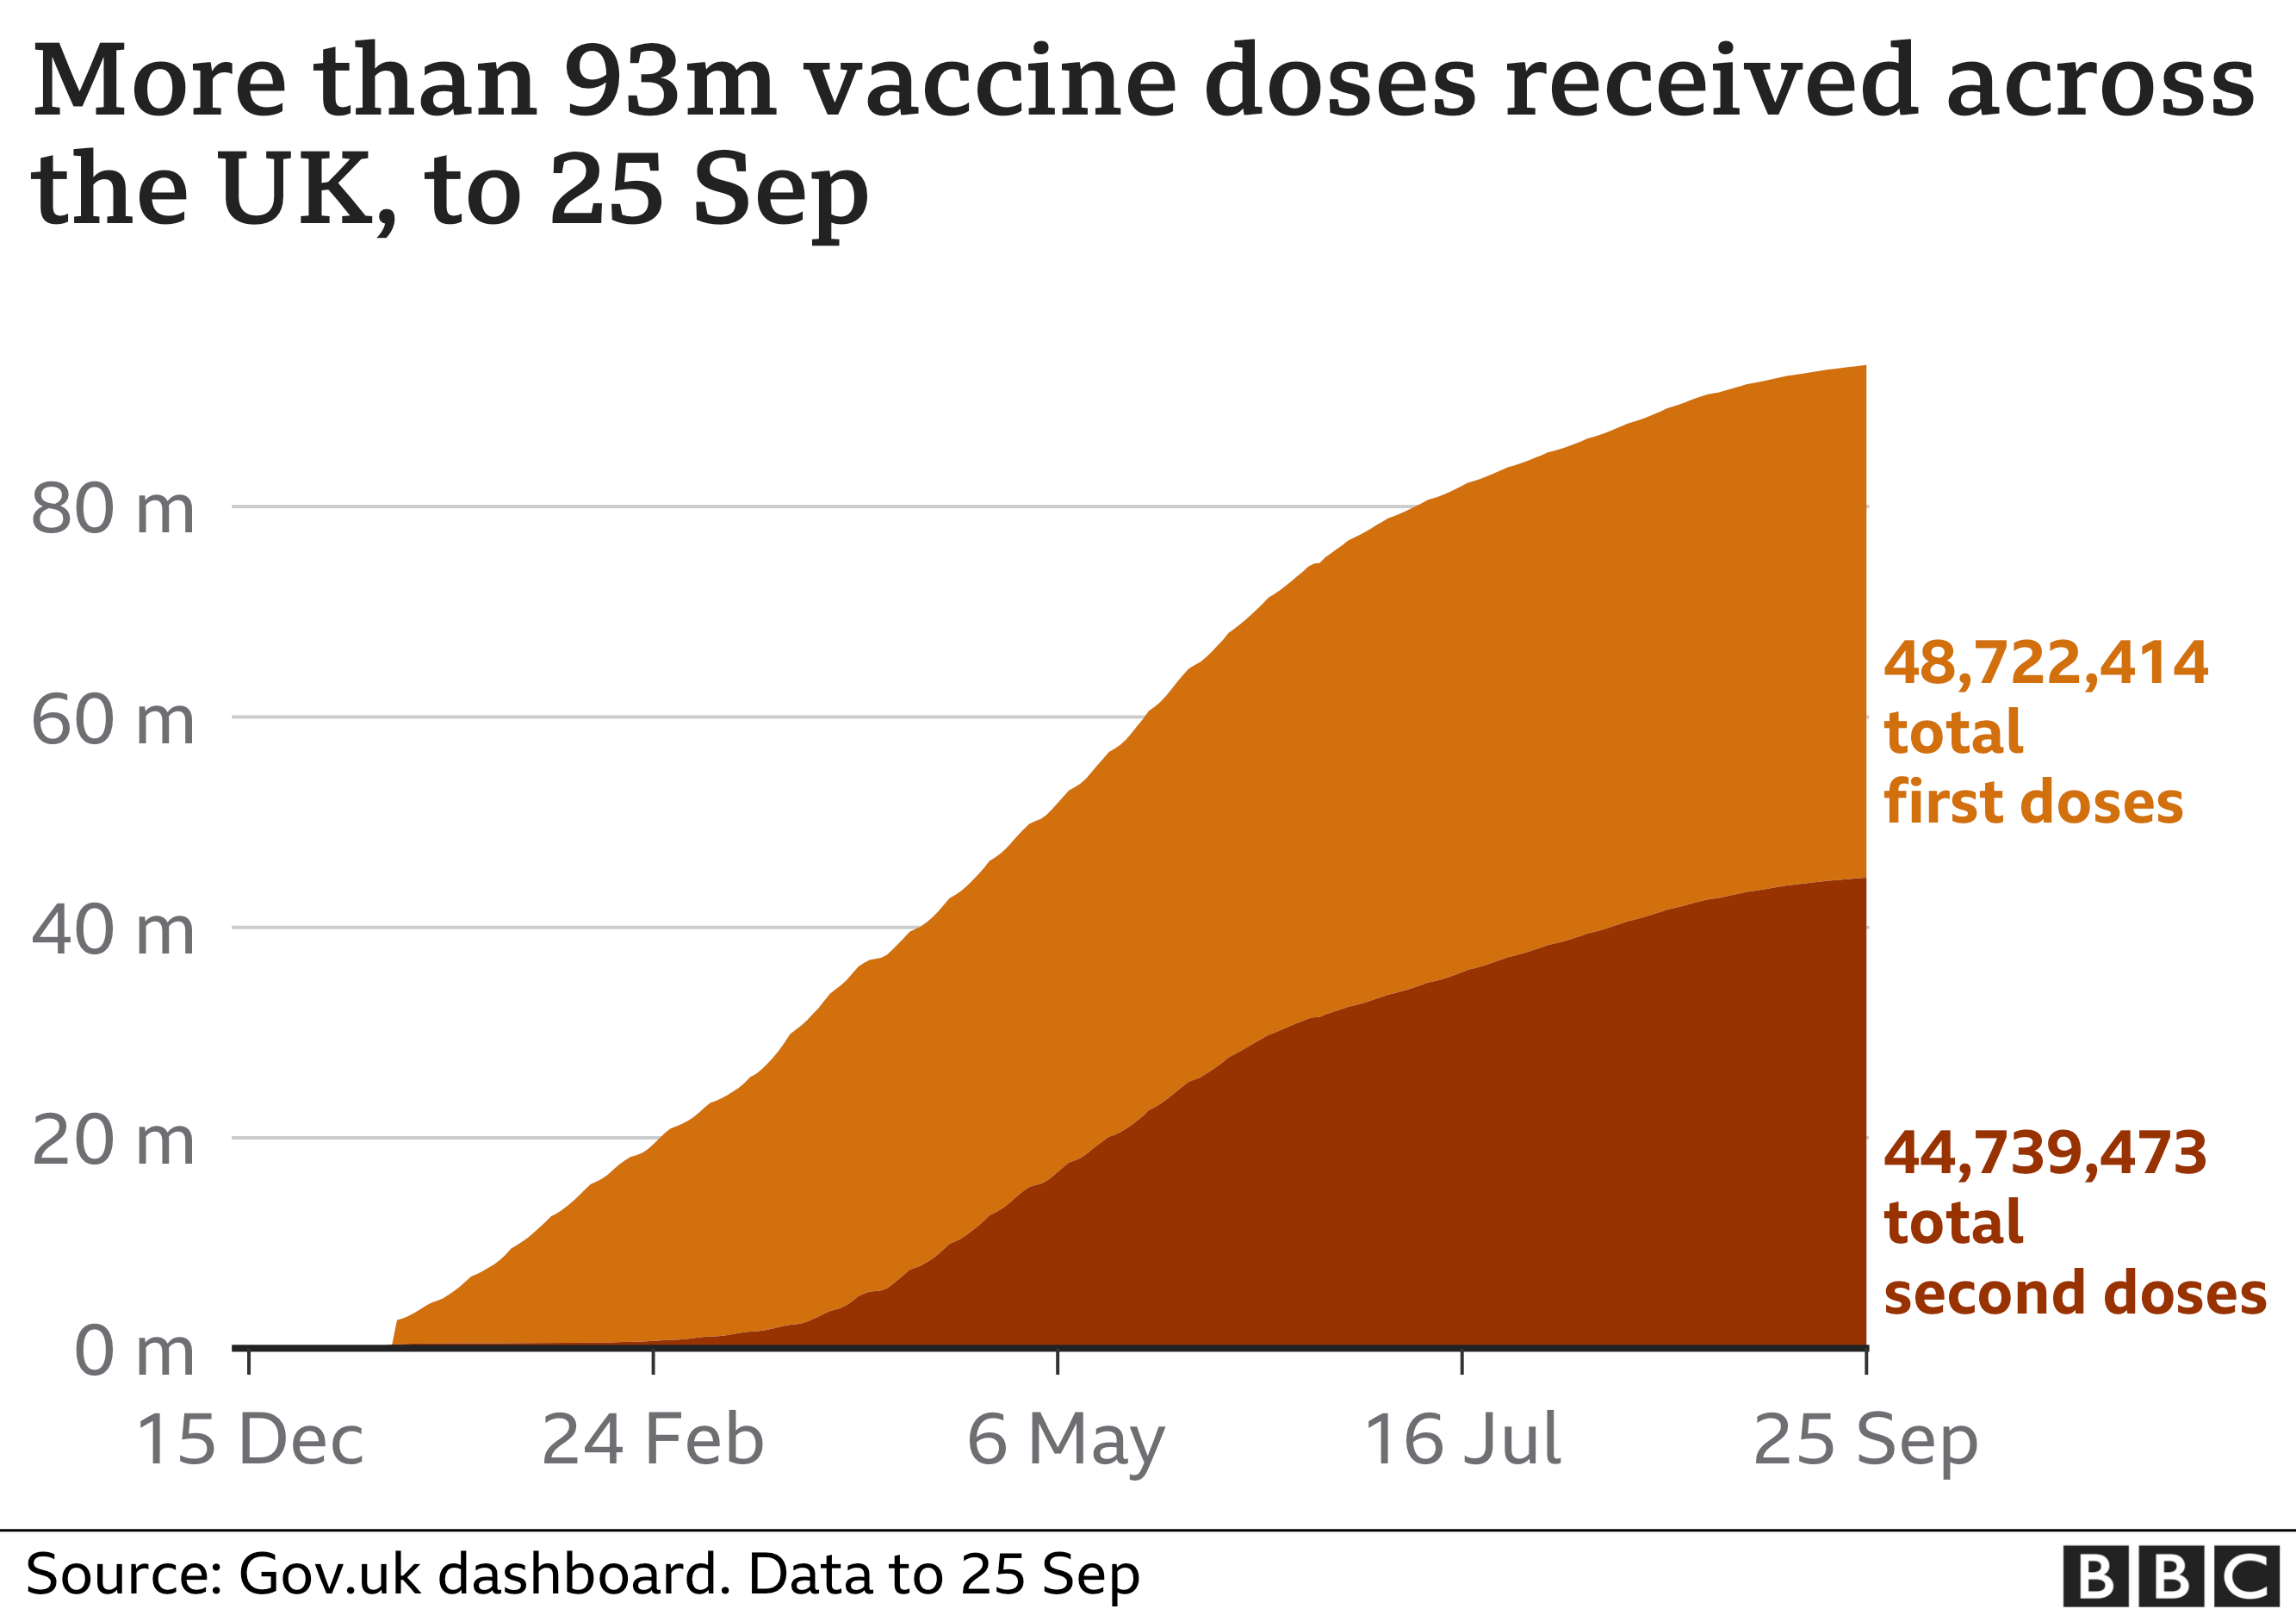
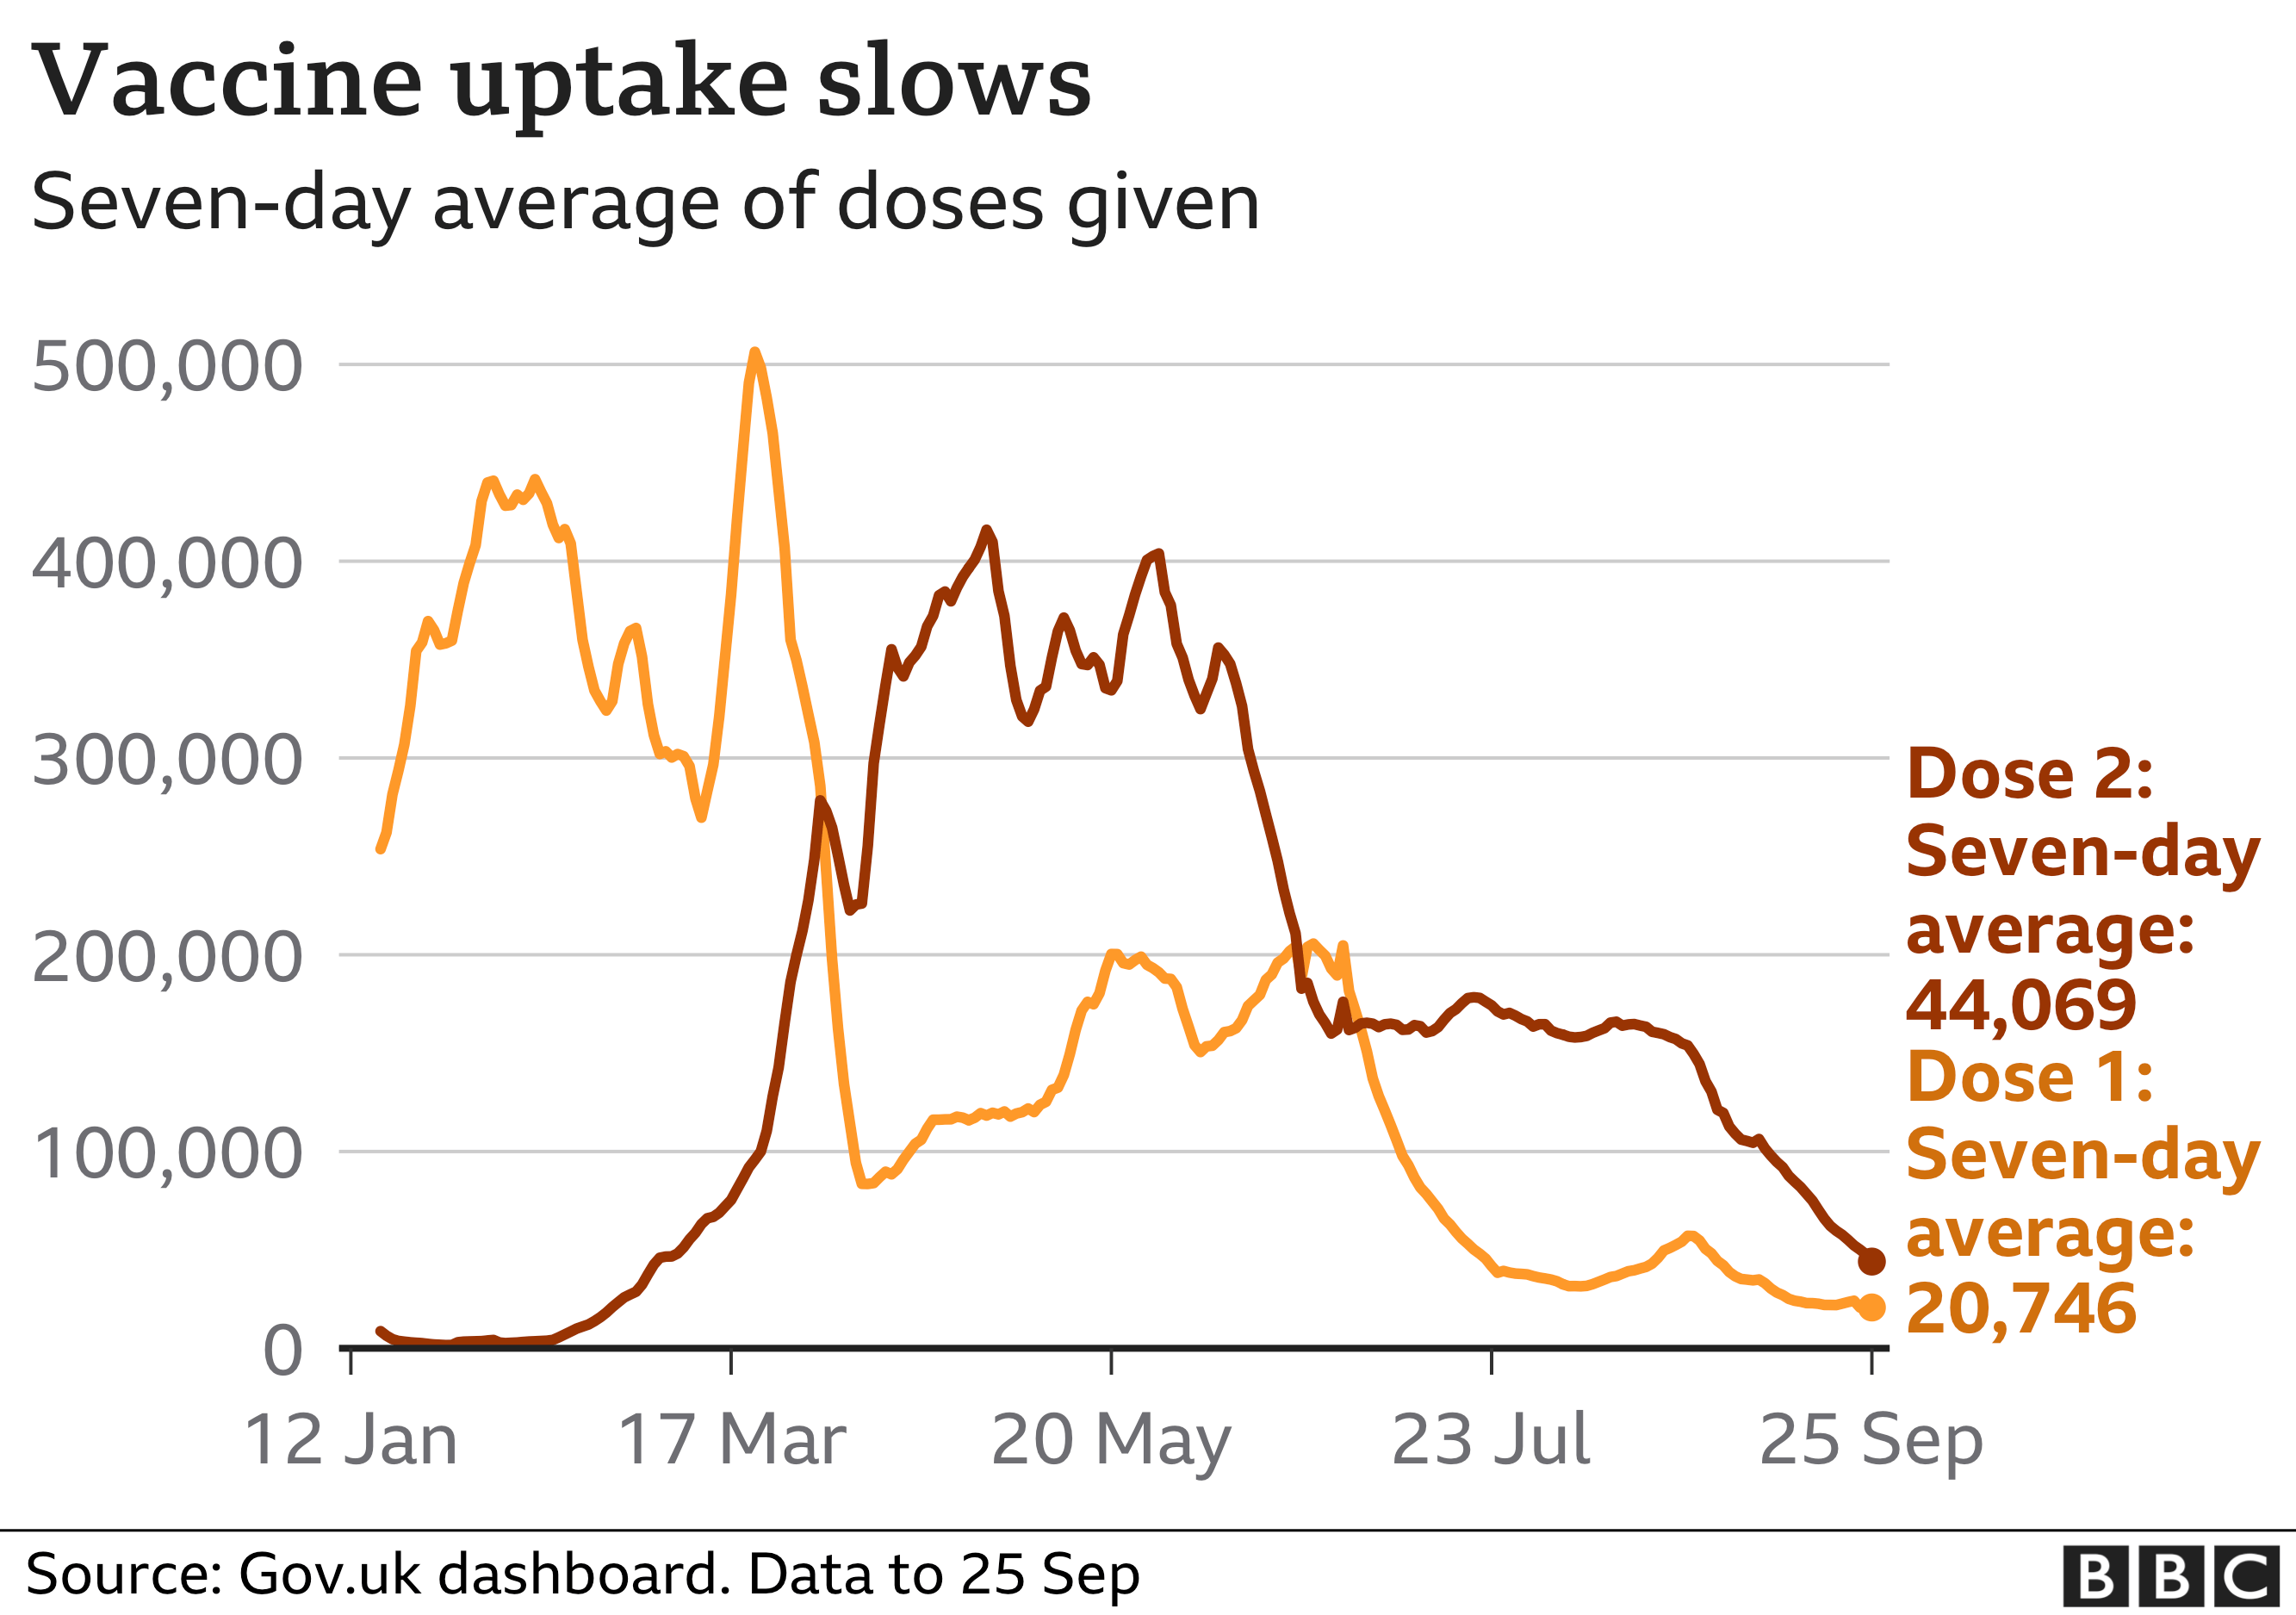
Vaccine rollout continuing
Nearly 49 million people, or about 90% of those aged 16 and over in the UK, have now received a first dose of a vaccine.
The number of people who have received a second vaccine dose is approaching 45 million, or 82% of people aged 16 and over.
Public Health England estimates the vaccination programme has prevented about 24 million infections, 230,000 hospitalisations and 120,000 deaths.
Nearly 41 million people in England have had one vaccine dose.
In Scotland, nearly 4.2 million people have had their first shot, while the figure is approaching 2.4 million in Wales and it is 1.3 million in Northern Ireland.
All those aged 16 and over can get a Covid vaccine, as well as children with underlying health conditions who are aged 12 and above.
Healthy children aged 12 to 15 are now also being offered one dose of a vaccine.
All four nations of the UK are beginning to offer booster jabs to over-50s, younger adults with health conditions and frontline health and social care workers.
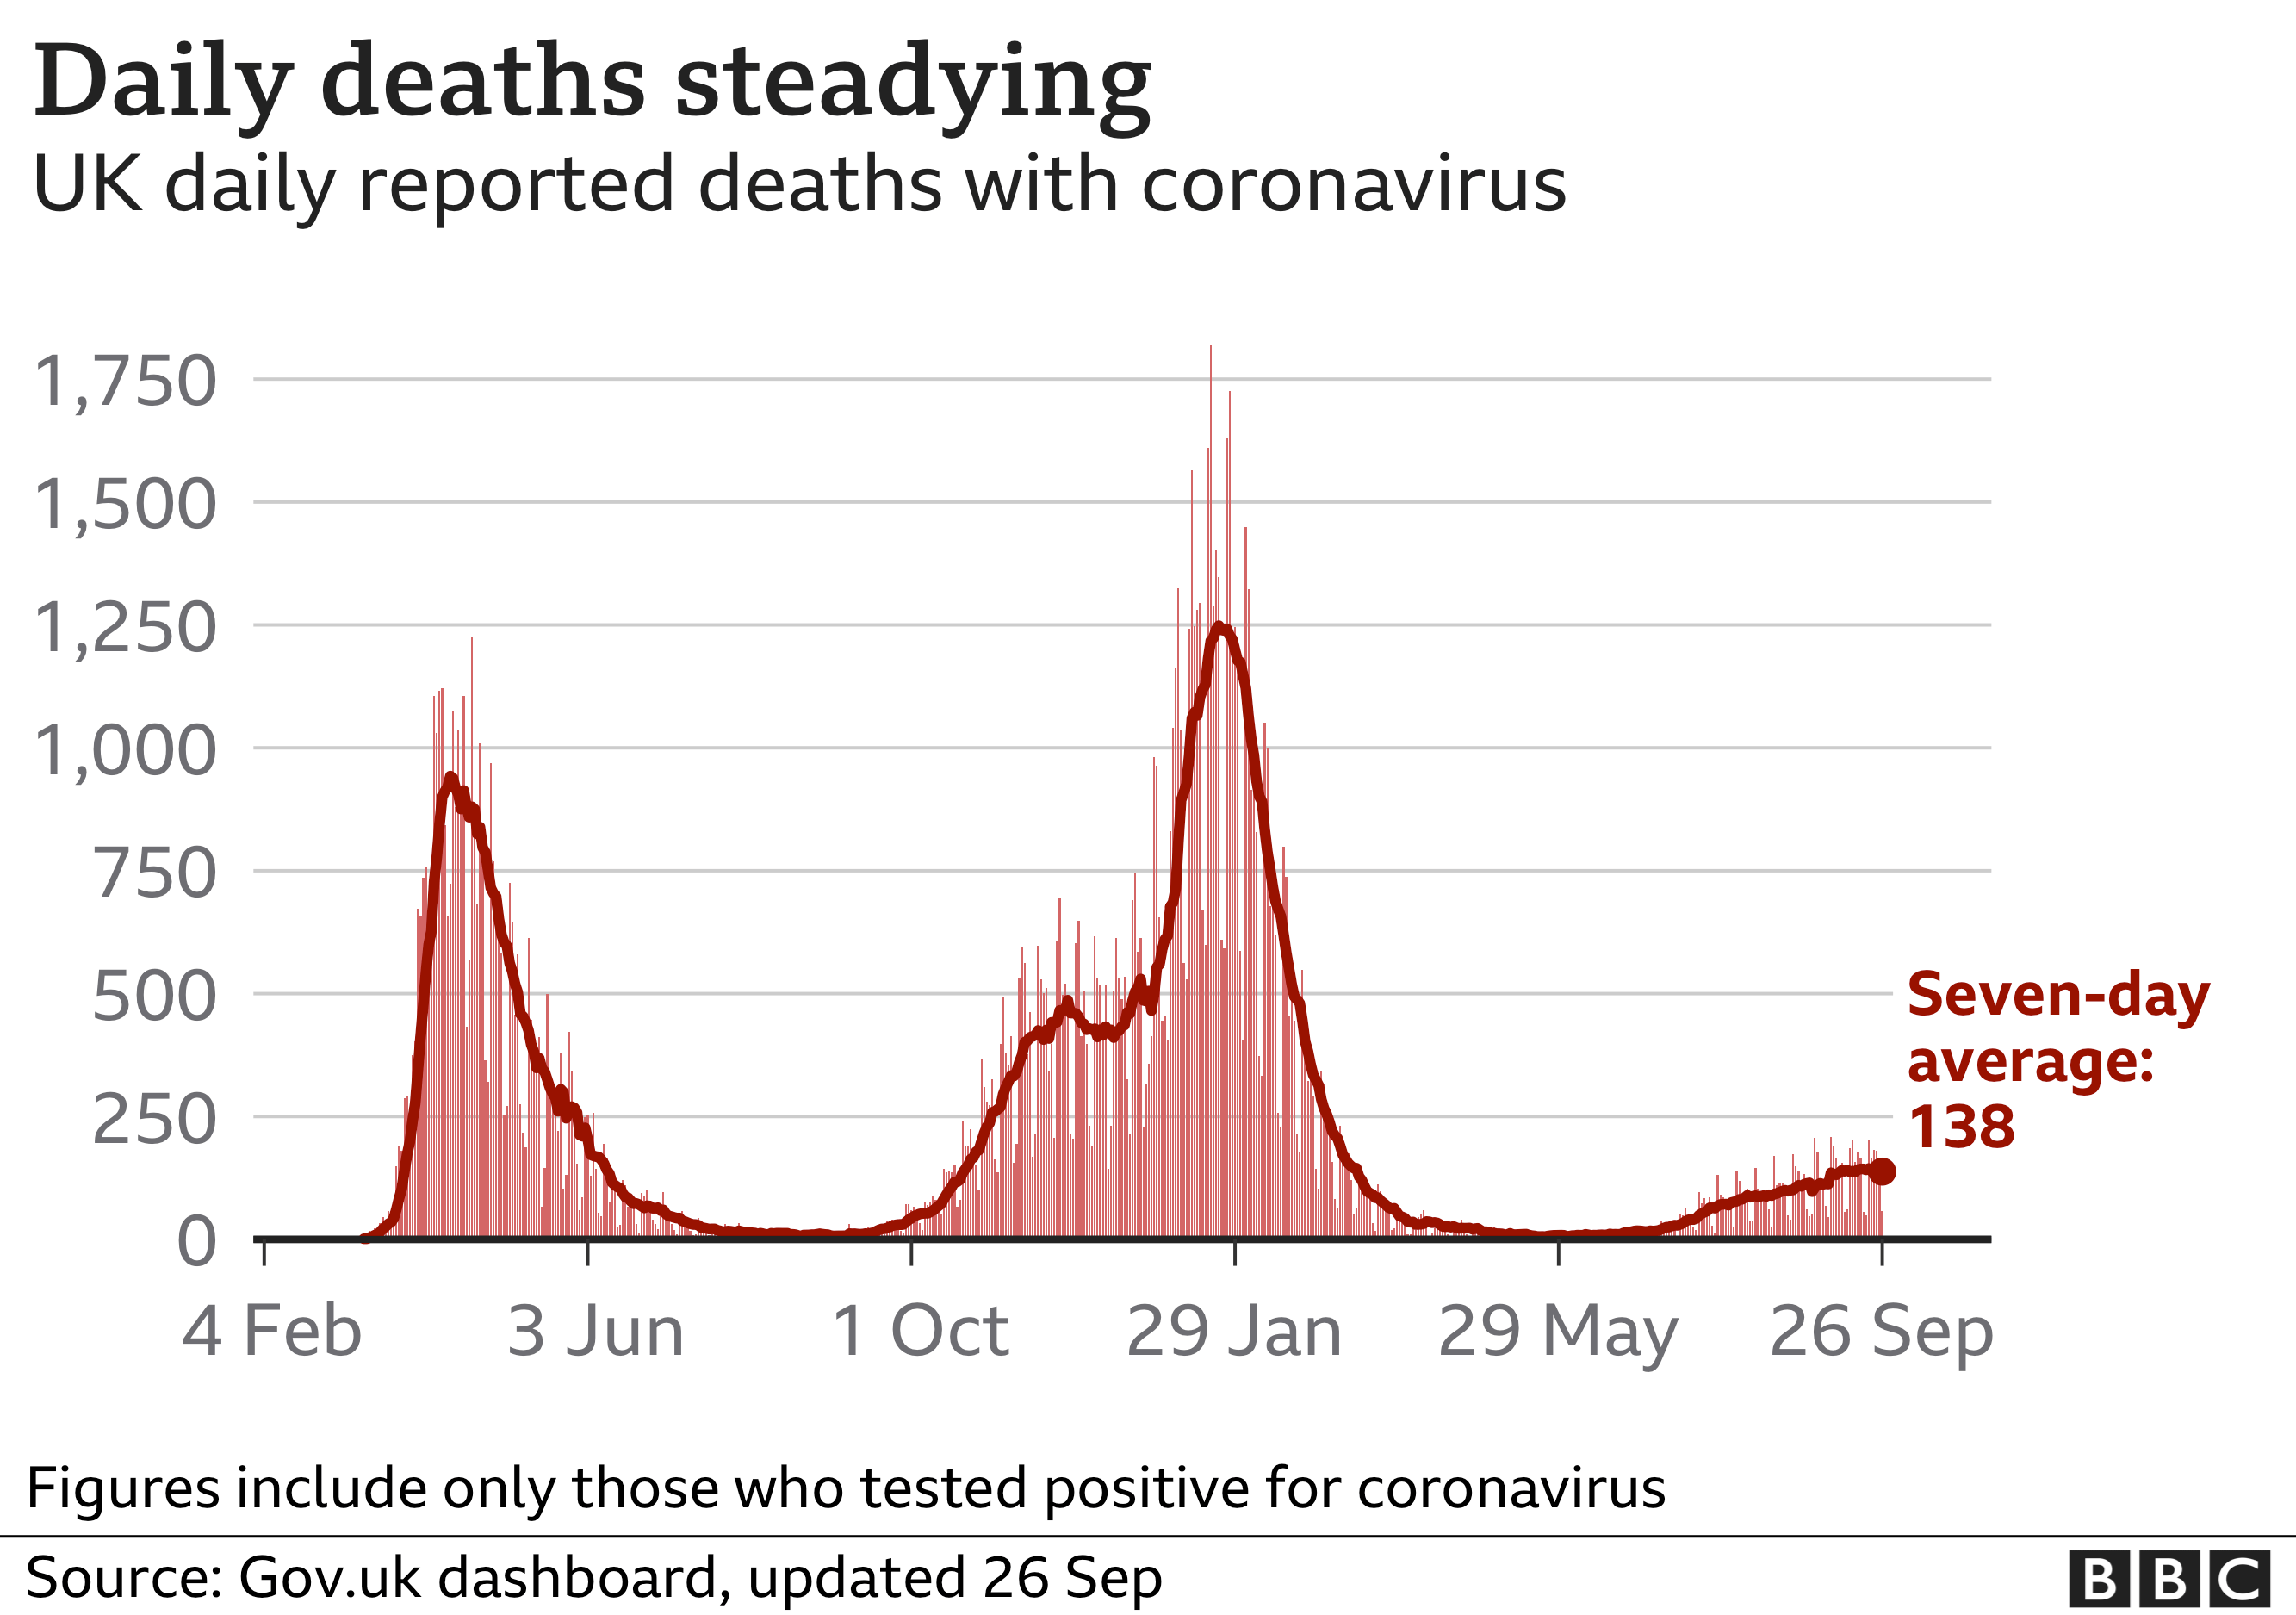
Daily deaths have been rising
There were 58 deaths within 28 days of a positive test reported on Sunday.
Of those deaths, 37 were in England, 13 in Wales, six in Northern Ireland and two were in Scotland.
England has seen the majority of UK deaths since the pandemic began, with more than 119,000 so far.
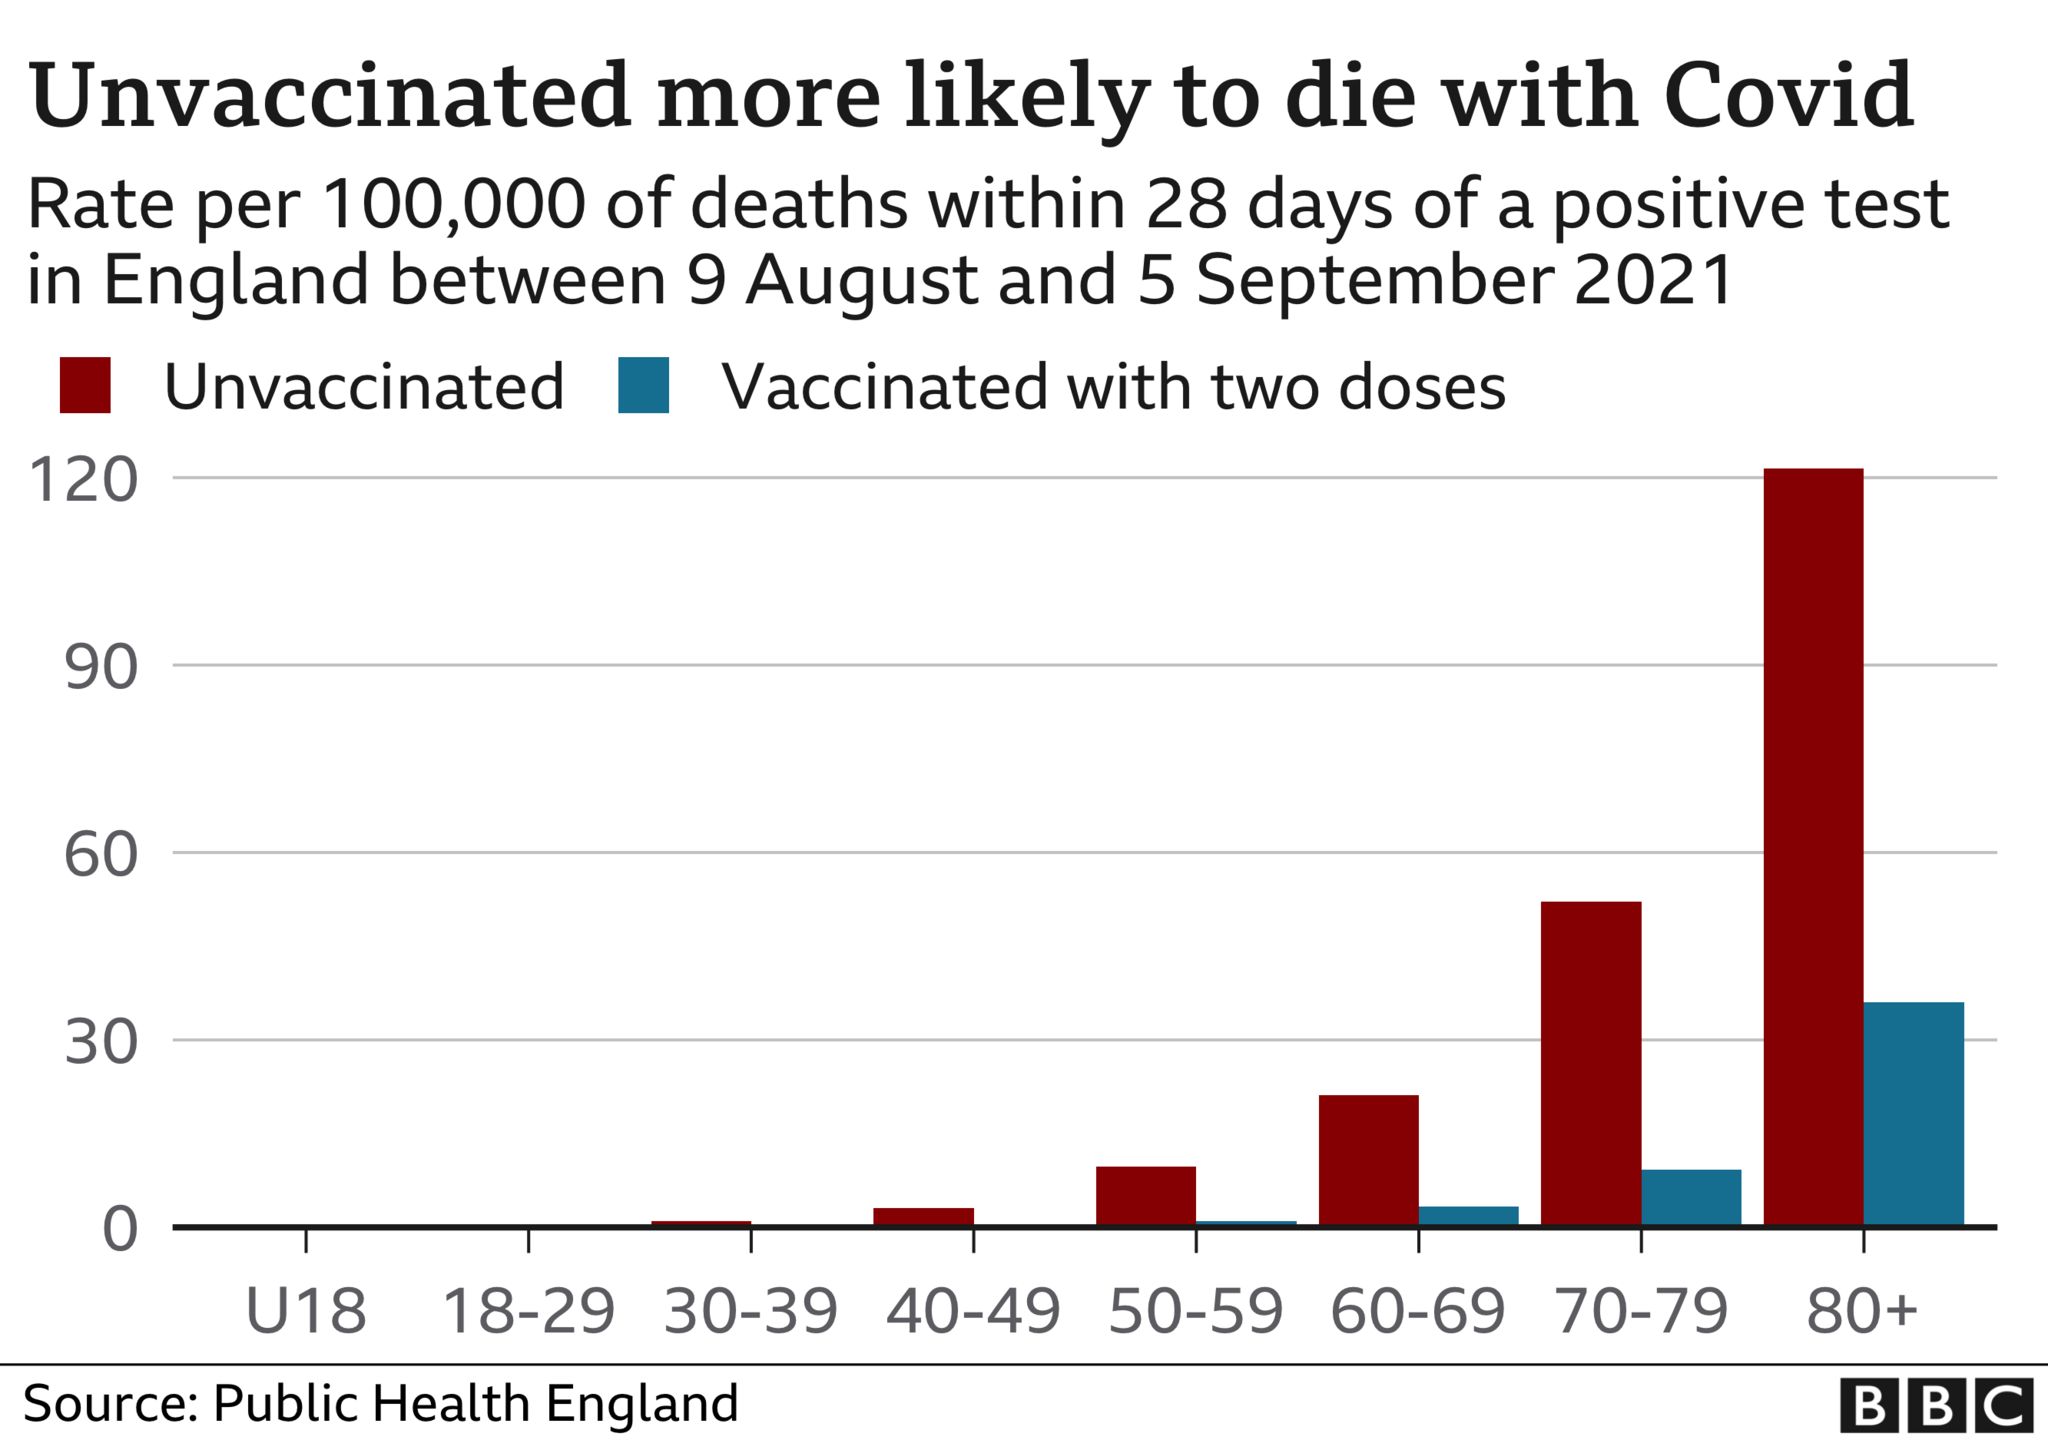
Prof Chris Whitty, the UK government's chief medical adviser, has urged those not yet vaccinated to get the jab as soon as possible, saying: "Winter is coming and people really should take this seriously."
He said recent Public Health England data showed that in every age bracket there is a "very substantially smaller" risk of being admitted to hospital and dying with Covid for people who have been vaccinated.
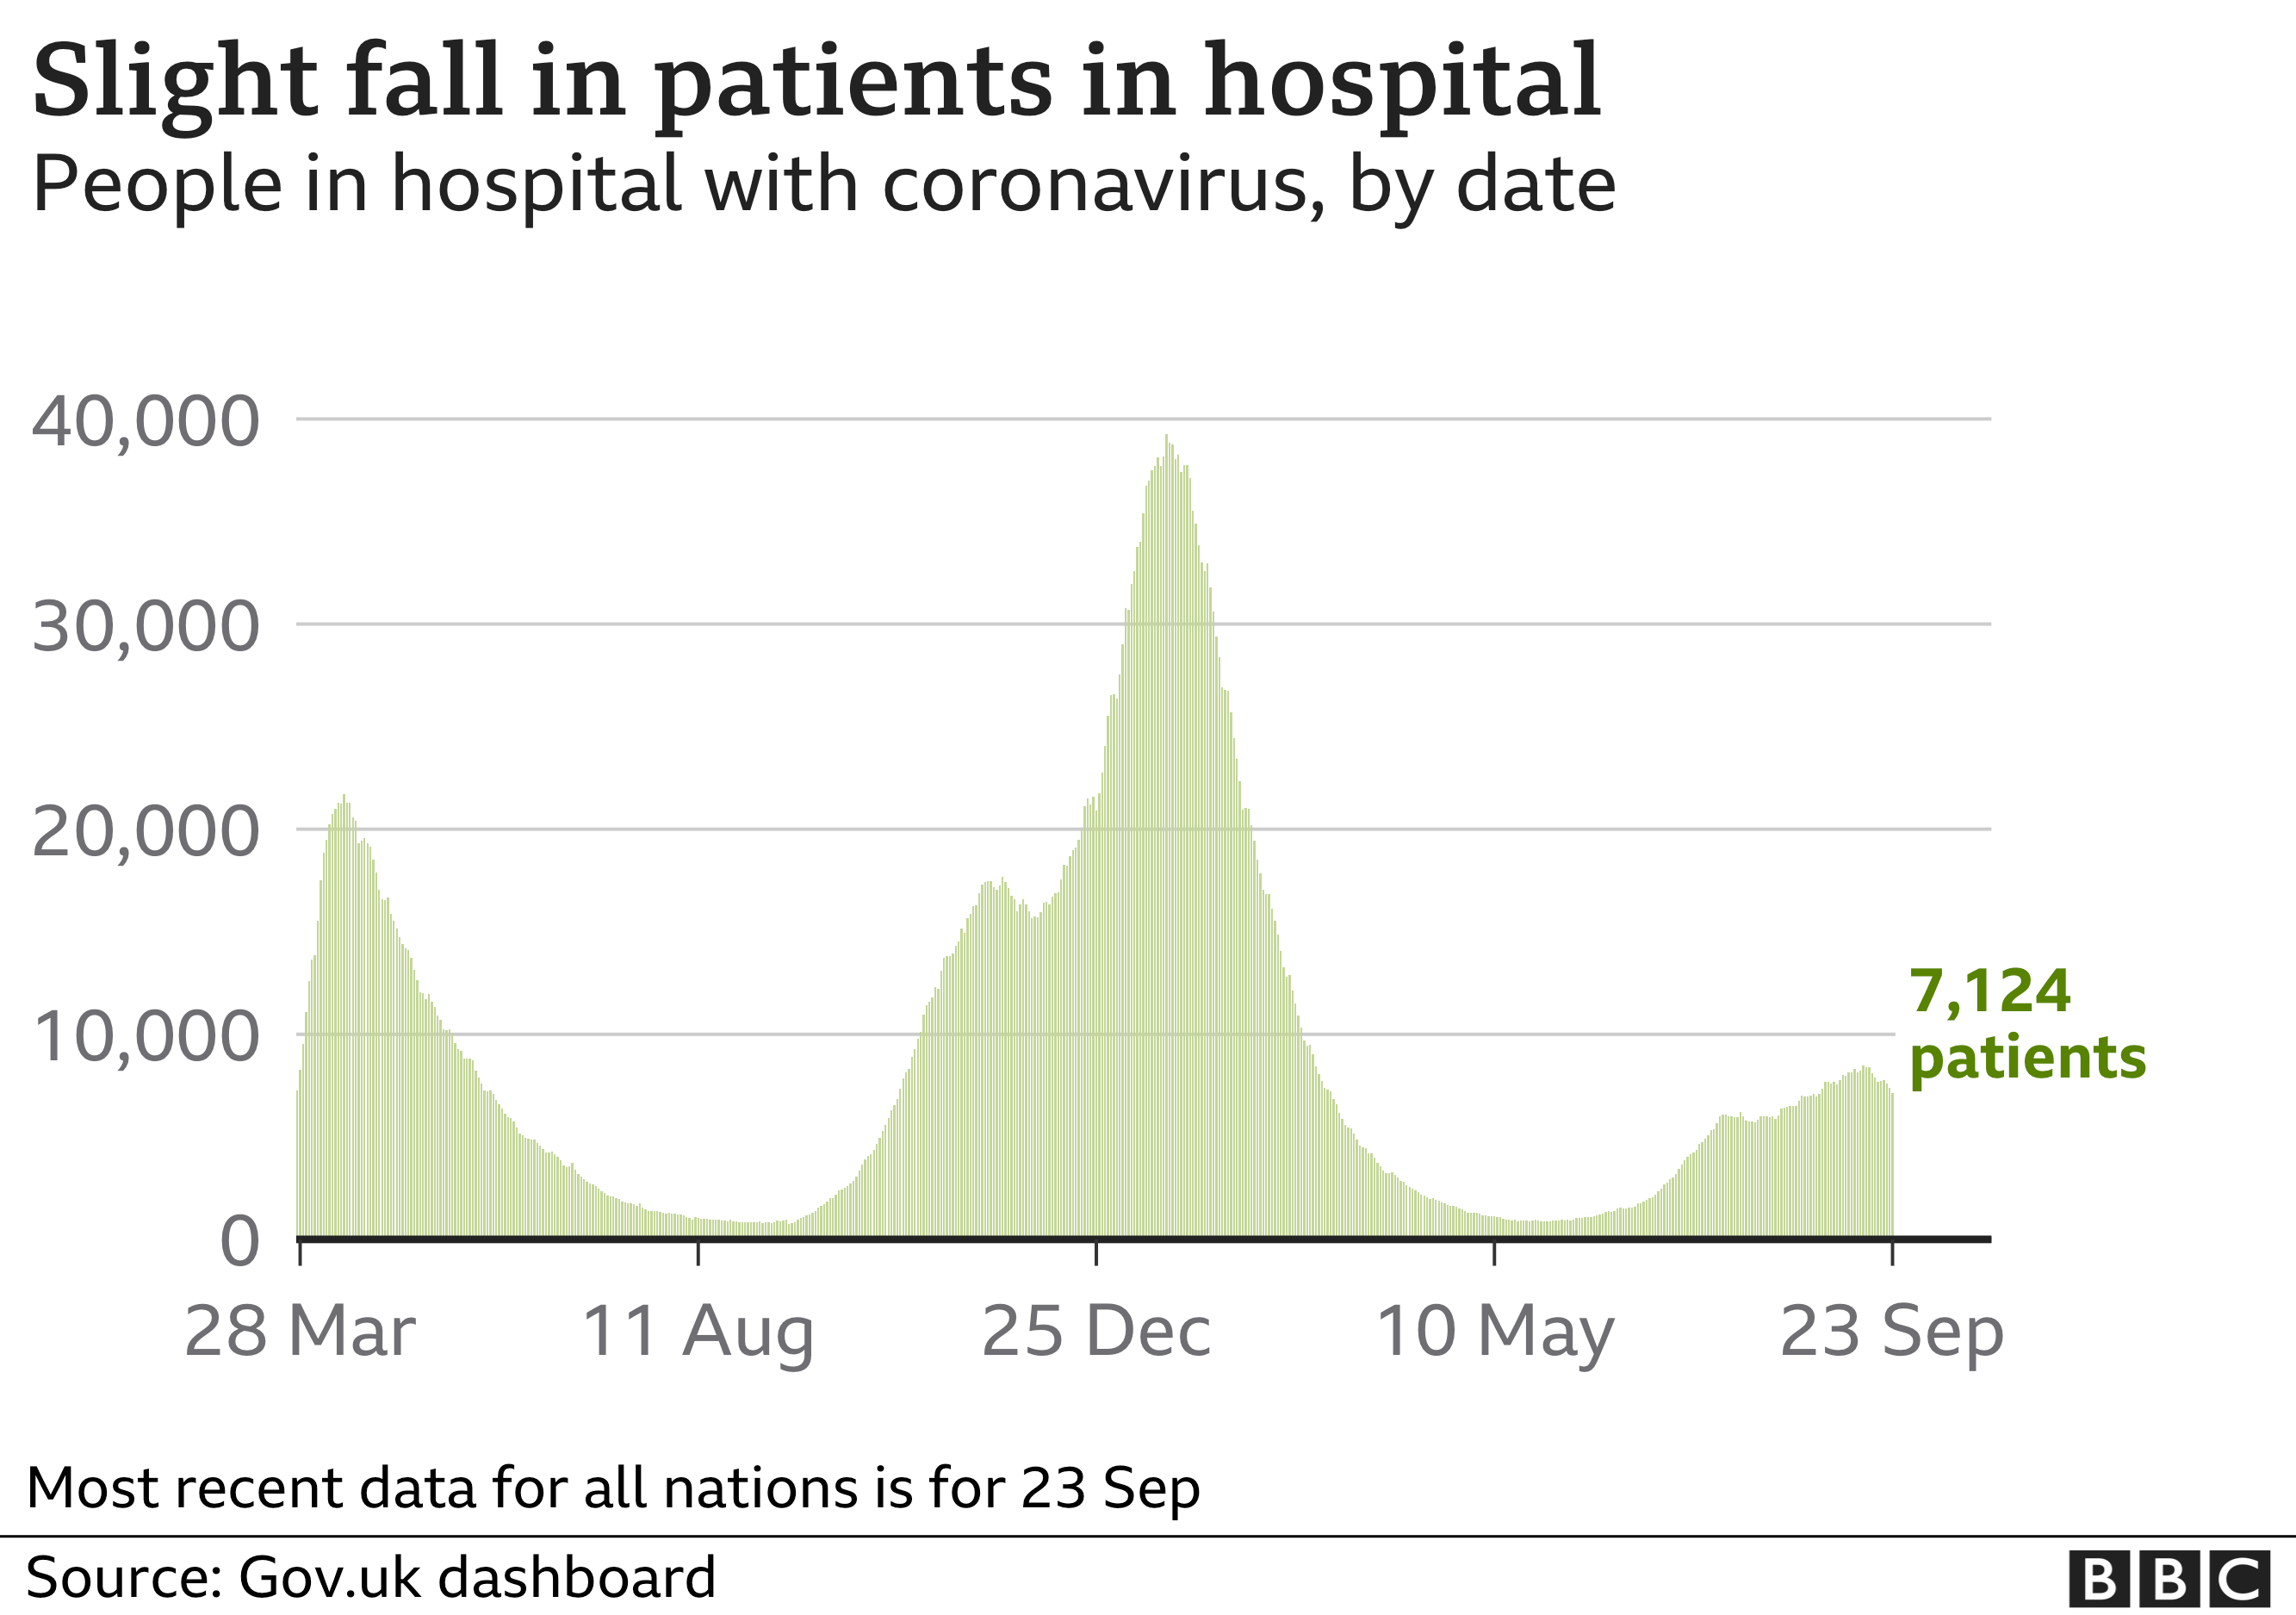
Hospital numbers stabilising
The most recent government figures show 7,124 people with coronavirus in hospital in the UK, down from 8,101 a week earlier.
More than 900 of those in hospital with coronavirus are in mechanical ventilation beds - using ventilators to help them breathe.
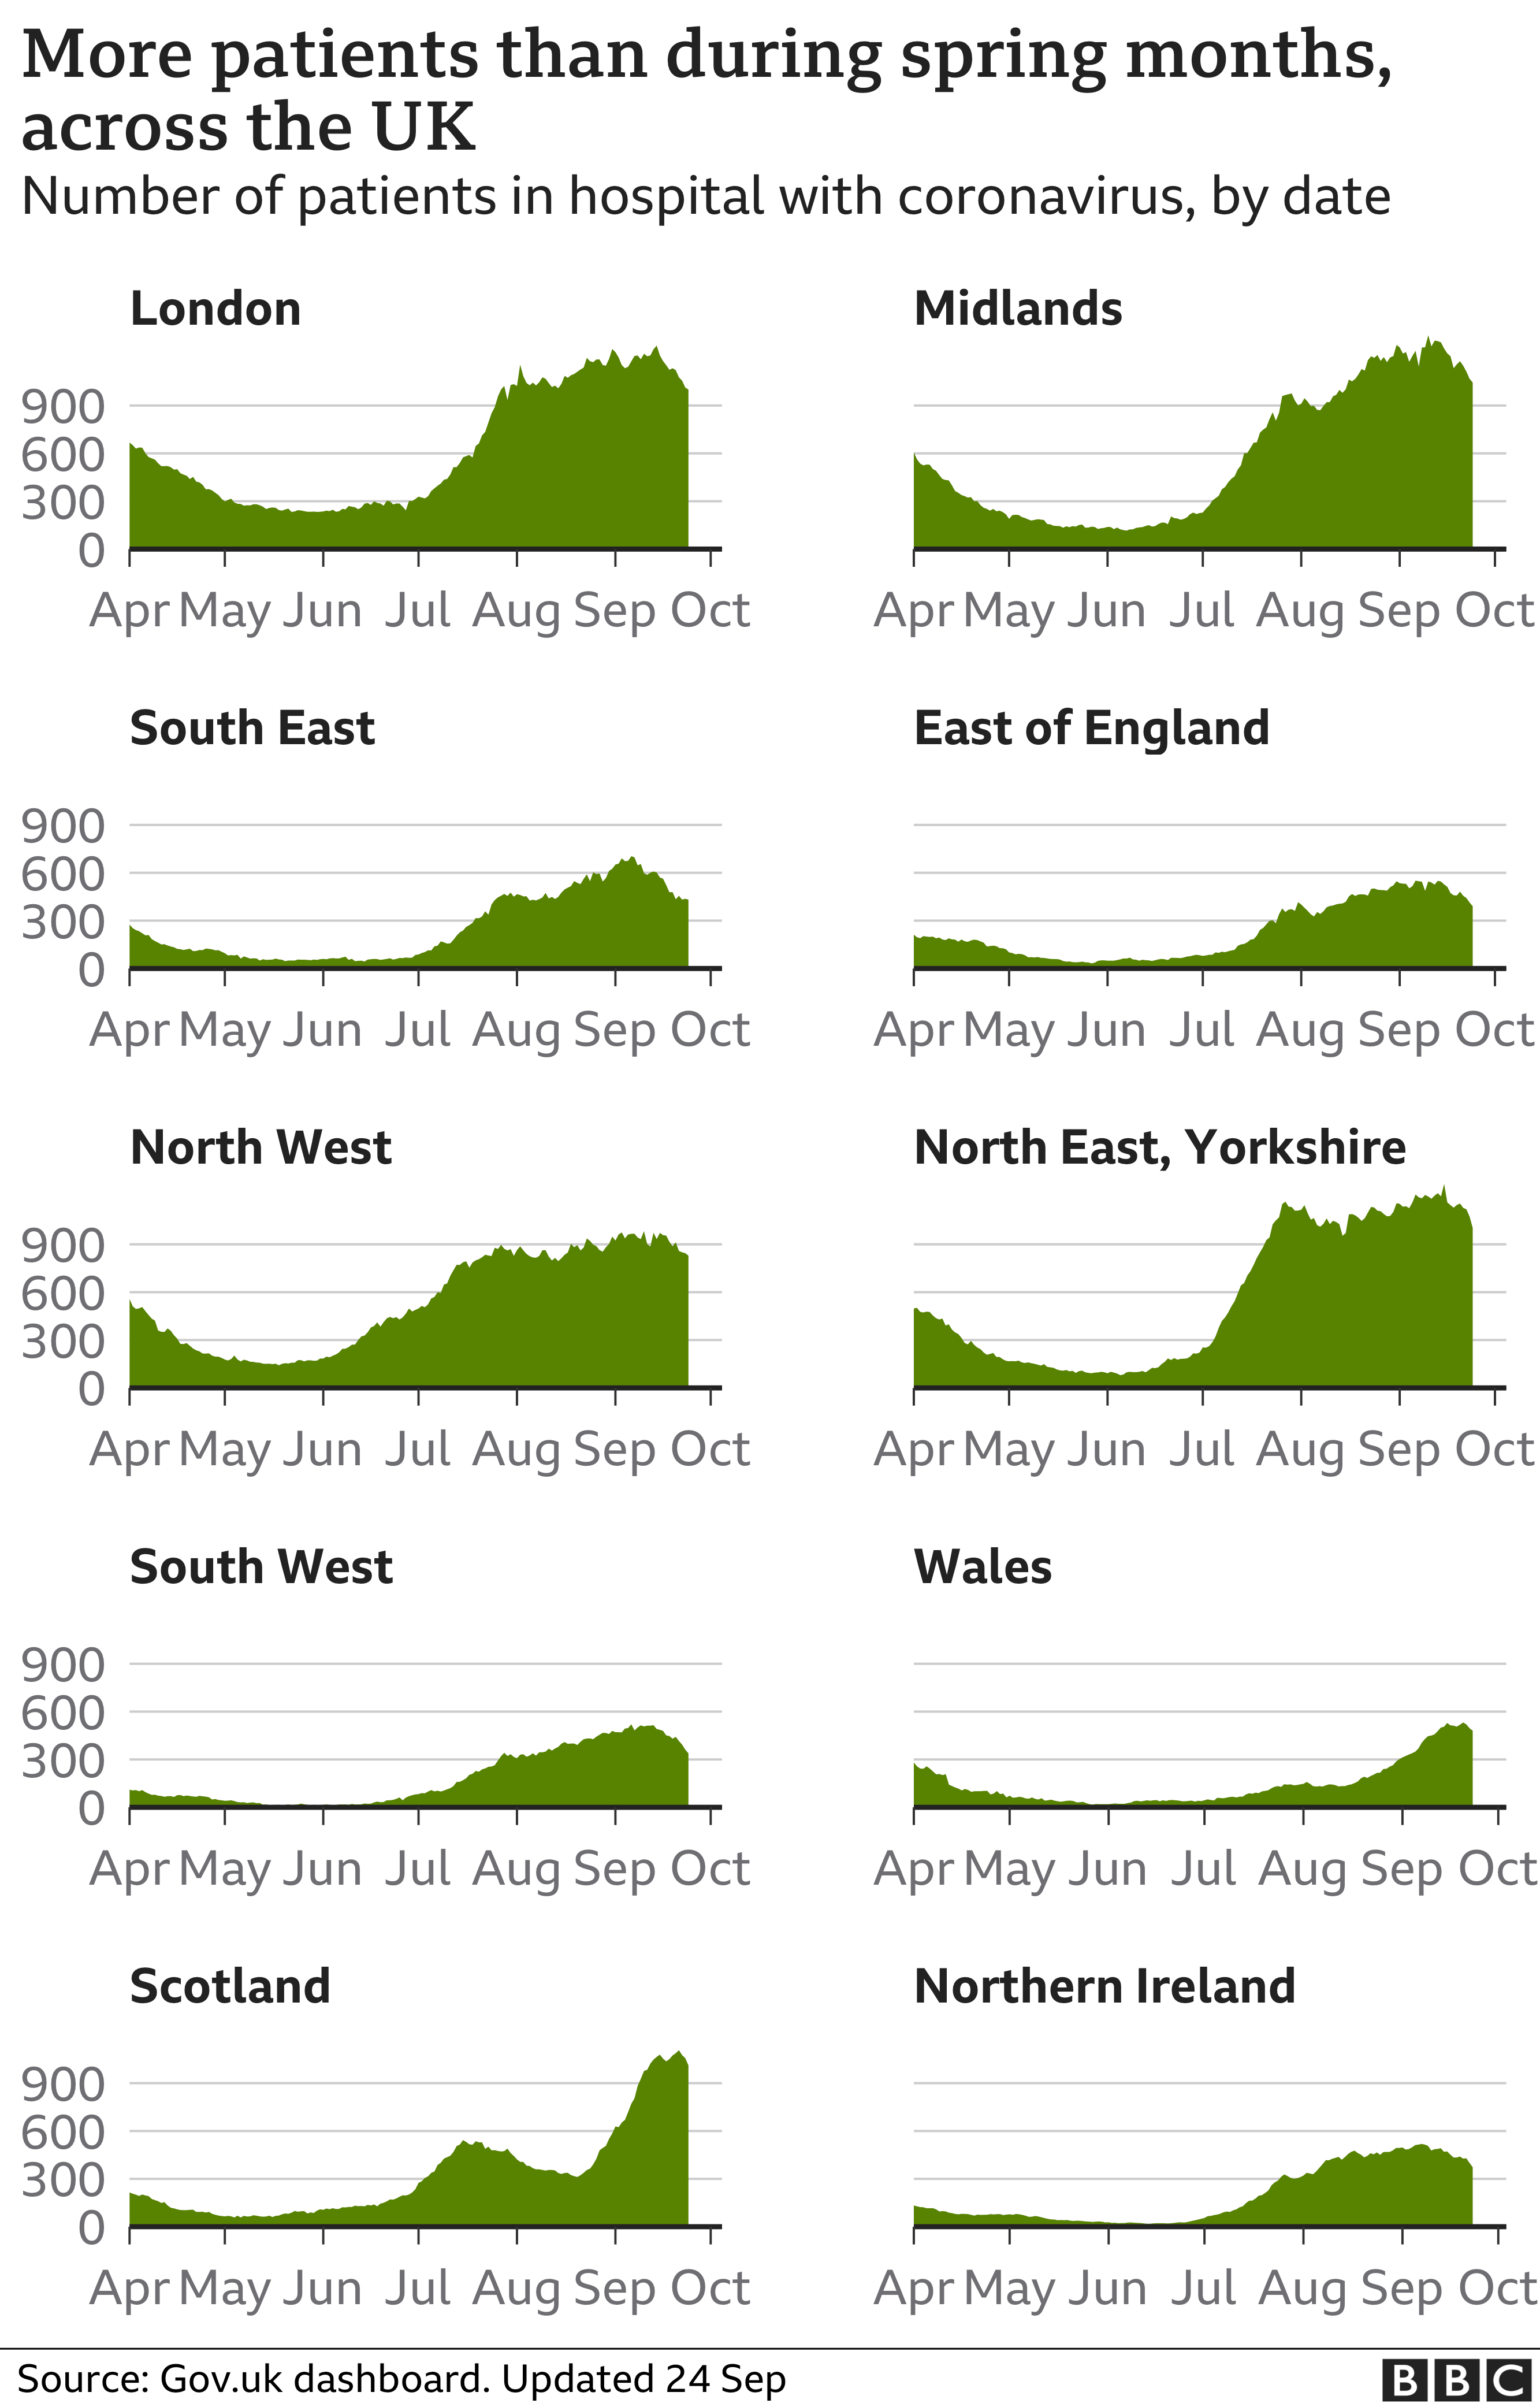
Although numbers of hospital patients with coronavirus are higher than they were over the summer, they are far below the peak of nearly 40,000 people back in January.
Looking at the number of people in hospital by region, we see a similar pattern.
Patient numbers are higher than in the summer but have remained steady in most regions for several weeks.
Patient groups and hospital staff have warned that lives are being put at risk by the huge backlog of treatment left by the pandemic.
Figures released last month show that a record number of people - more than 5.45 million - are waiting for NHS hospital treatment in England.
Death toll could be nearly 160,000
When looking at the overall death toll from coronavirus, official figures count deaths in three different ways, each giving a slightly different number.
First, government figures - the ones reported each day - count people who died within 28 days of testing positive for coronavirus. This figure is now more than 136,000.
According to the latest ONS figures, the UK has now seen more than 158,000 deaths - that's all those deaths where coronavirus was mentioned on the death certificate even if the person had not been tested for the virus.
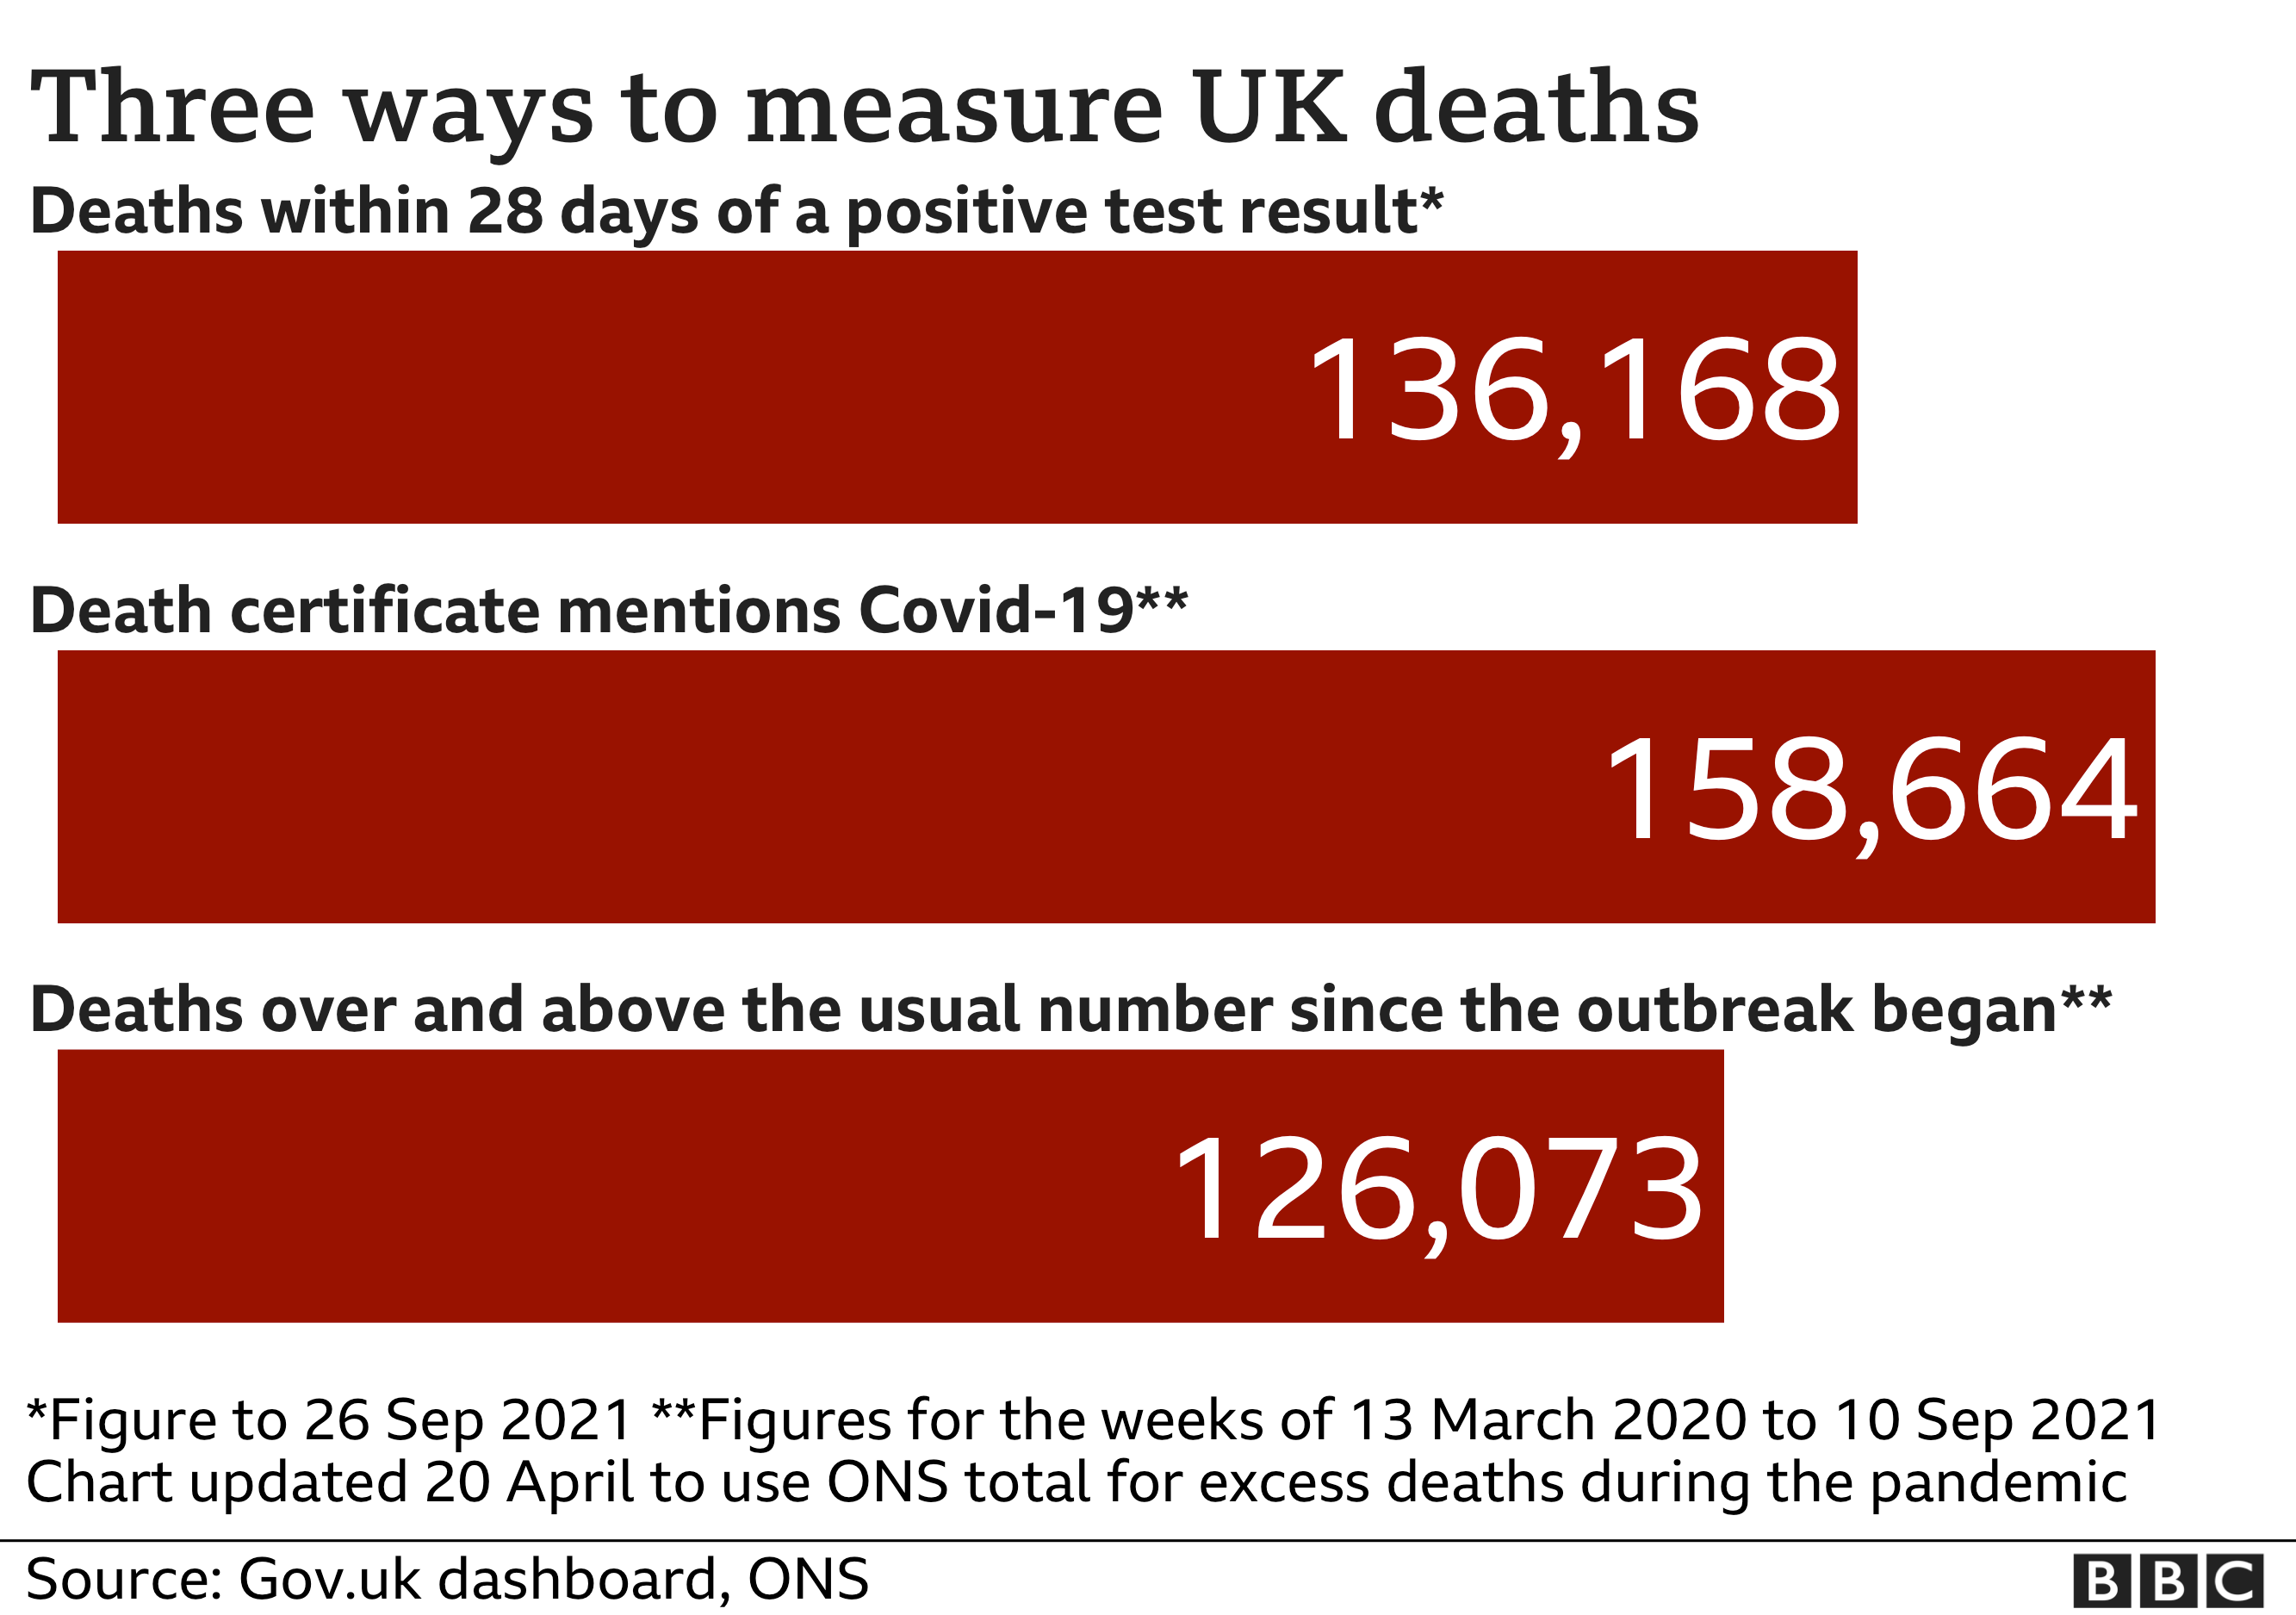
The third measure counts all deaths over and above the usual number at the time of year - that figure was more than 126,000 to 10 September.
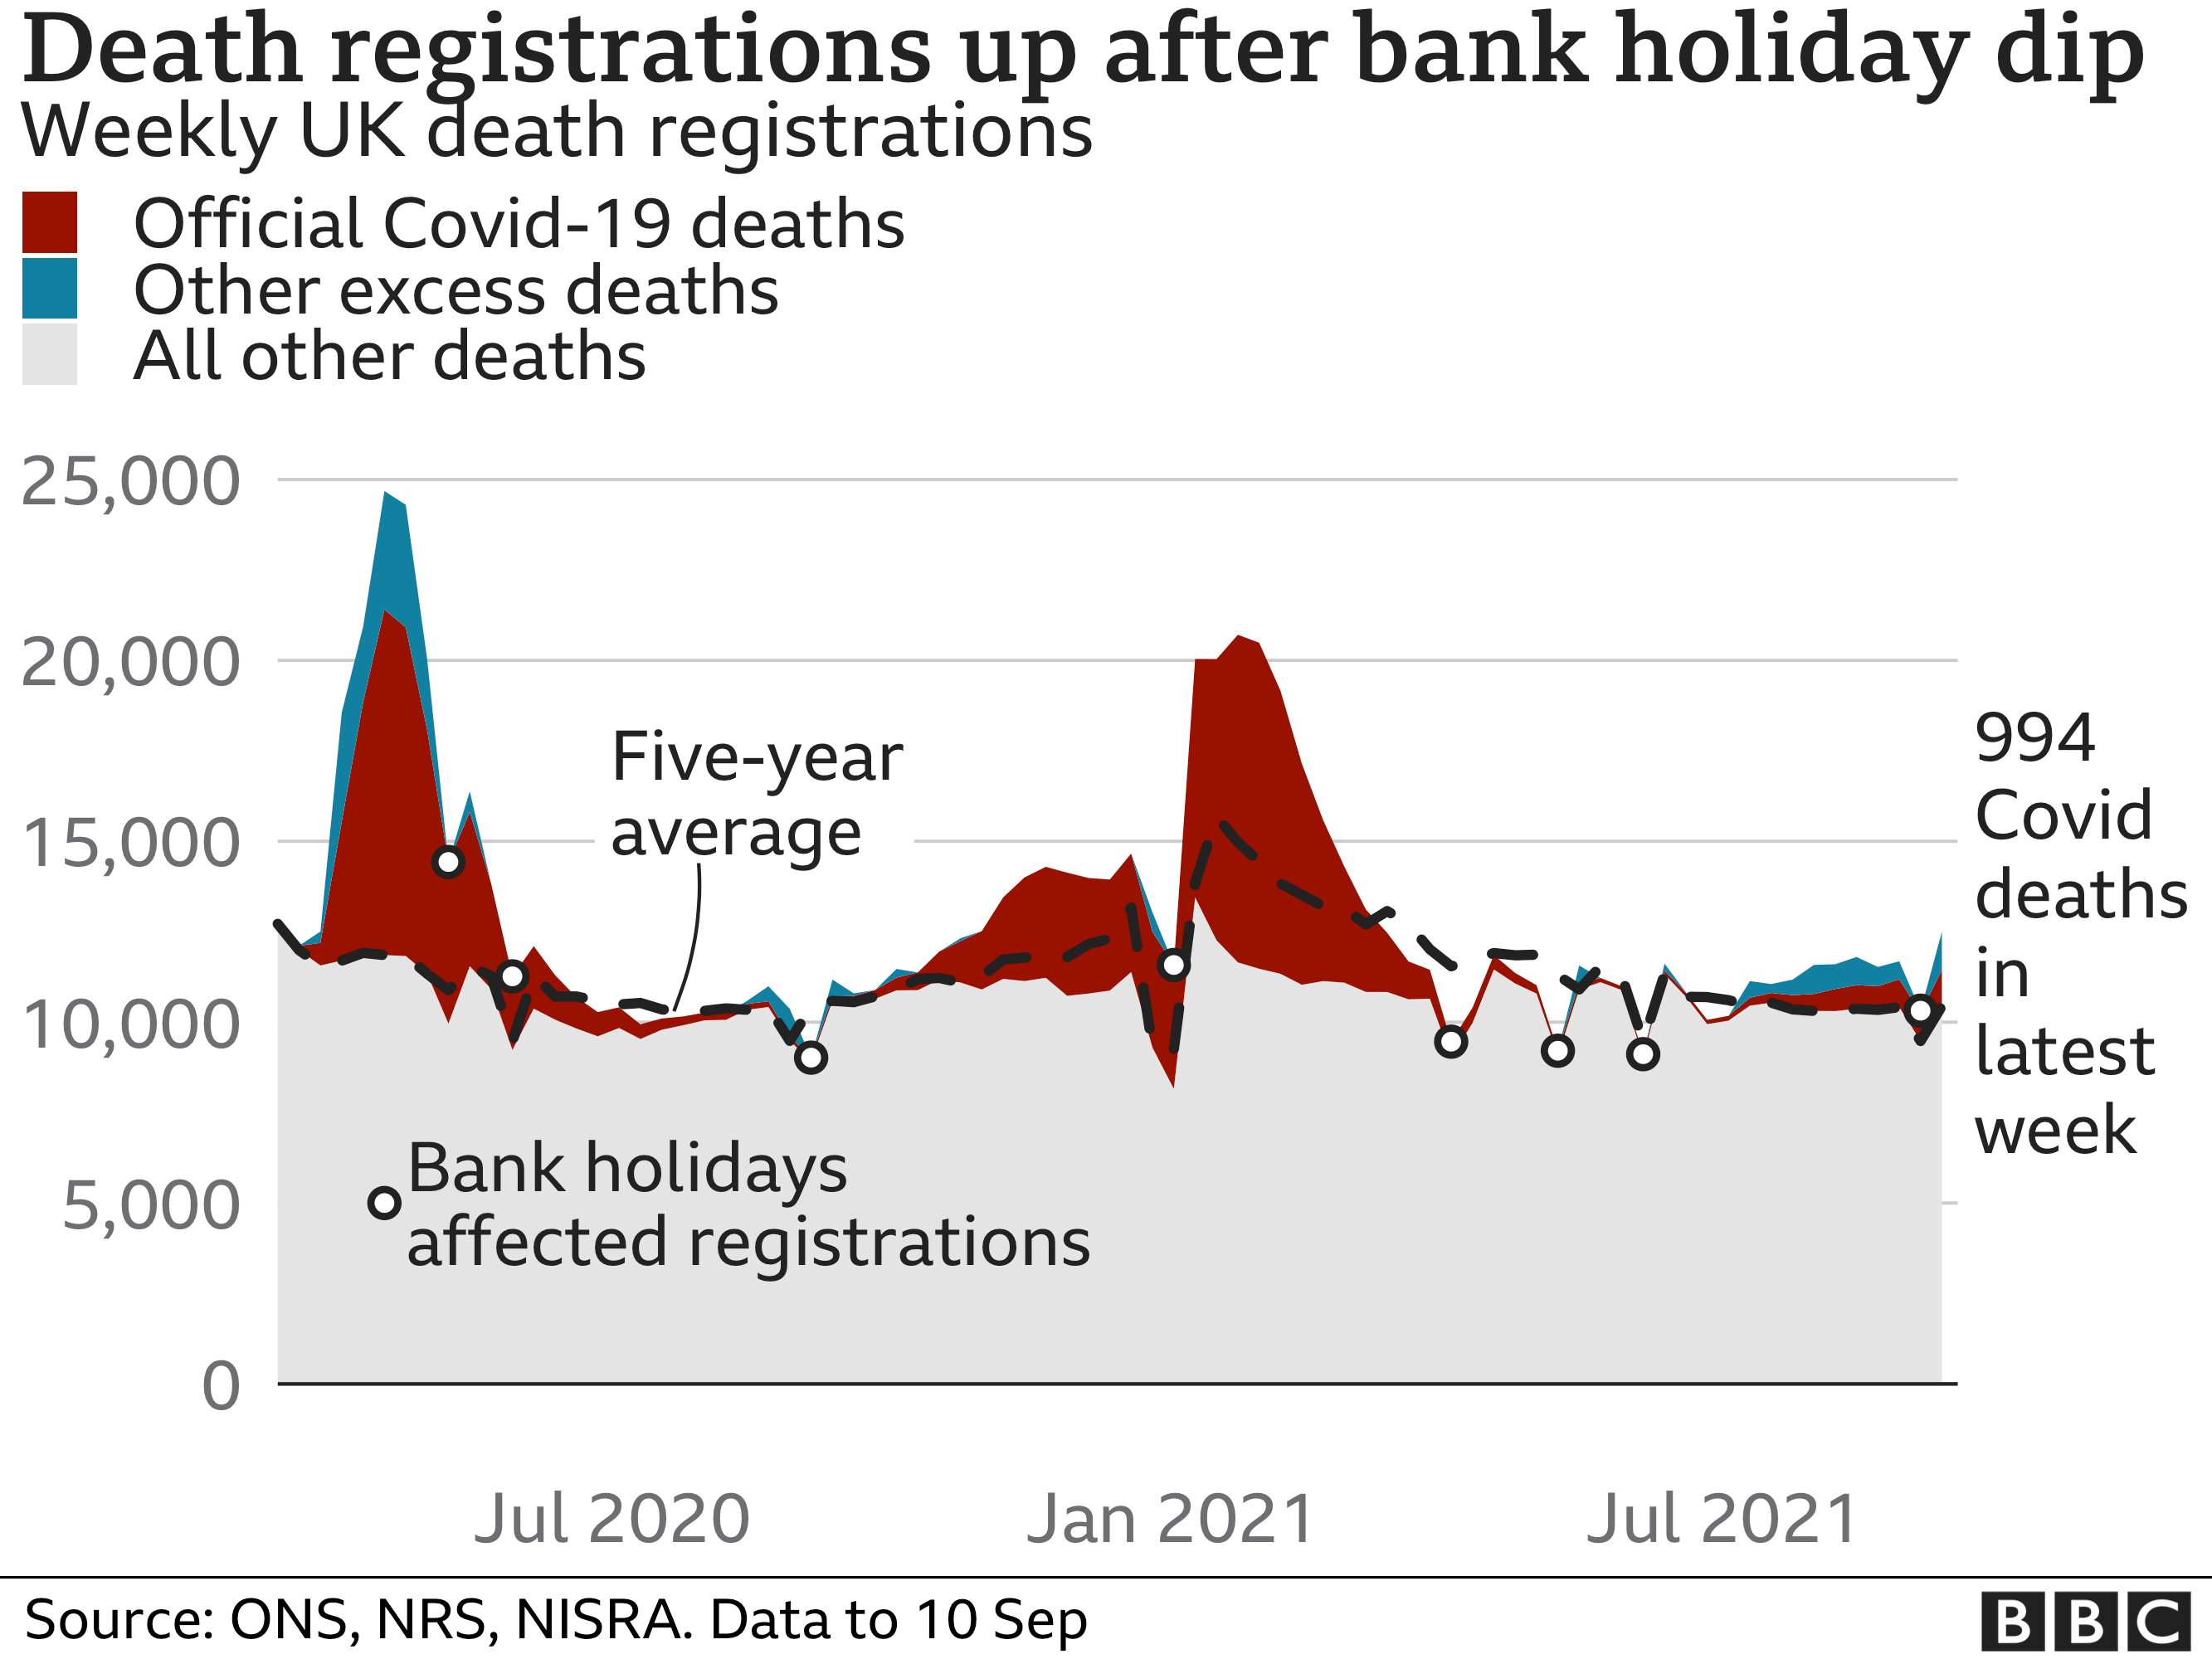
In total, there were 12,503 deaths registered in the week to 10 September, which was 20% above the five-year average.
Of the total deaths, 994 were related to coronavirus, 213 more than the previous week - but this jump is likely explained by delays in death registrations due to the August bank holiday.
There have been more deaths involving Covid than "excess" deaths since the start of the pandemic, meaning non-Covid deaths must be below usual levels.
This could be down to the milder flu season last winter - due to less travel and more social distancing - and because some people who might have died for other reasons had there been no pandemic, died of Covid.

- COVID VACCINE: When can you get it?
- NEW VARIANTS: How worrying are they?
- FACE MASKS: When do I need to wear one?
- TESTING: How do I get a virus test?
- GLOBAL TRACKER: Where are the virus hotspots?

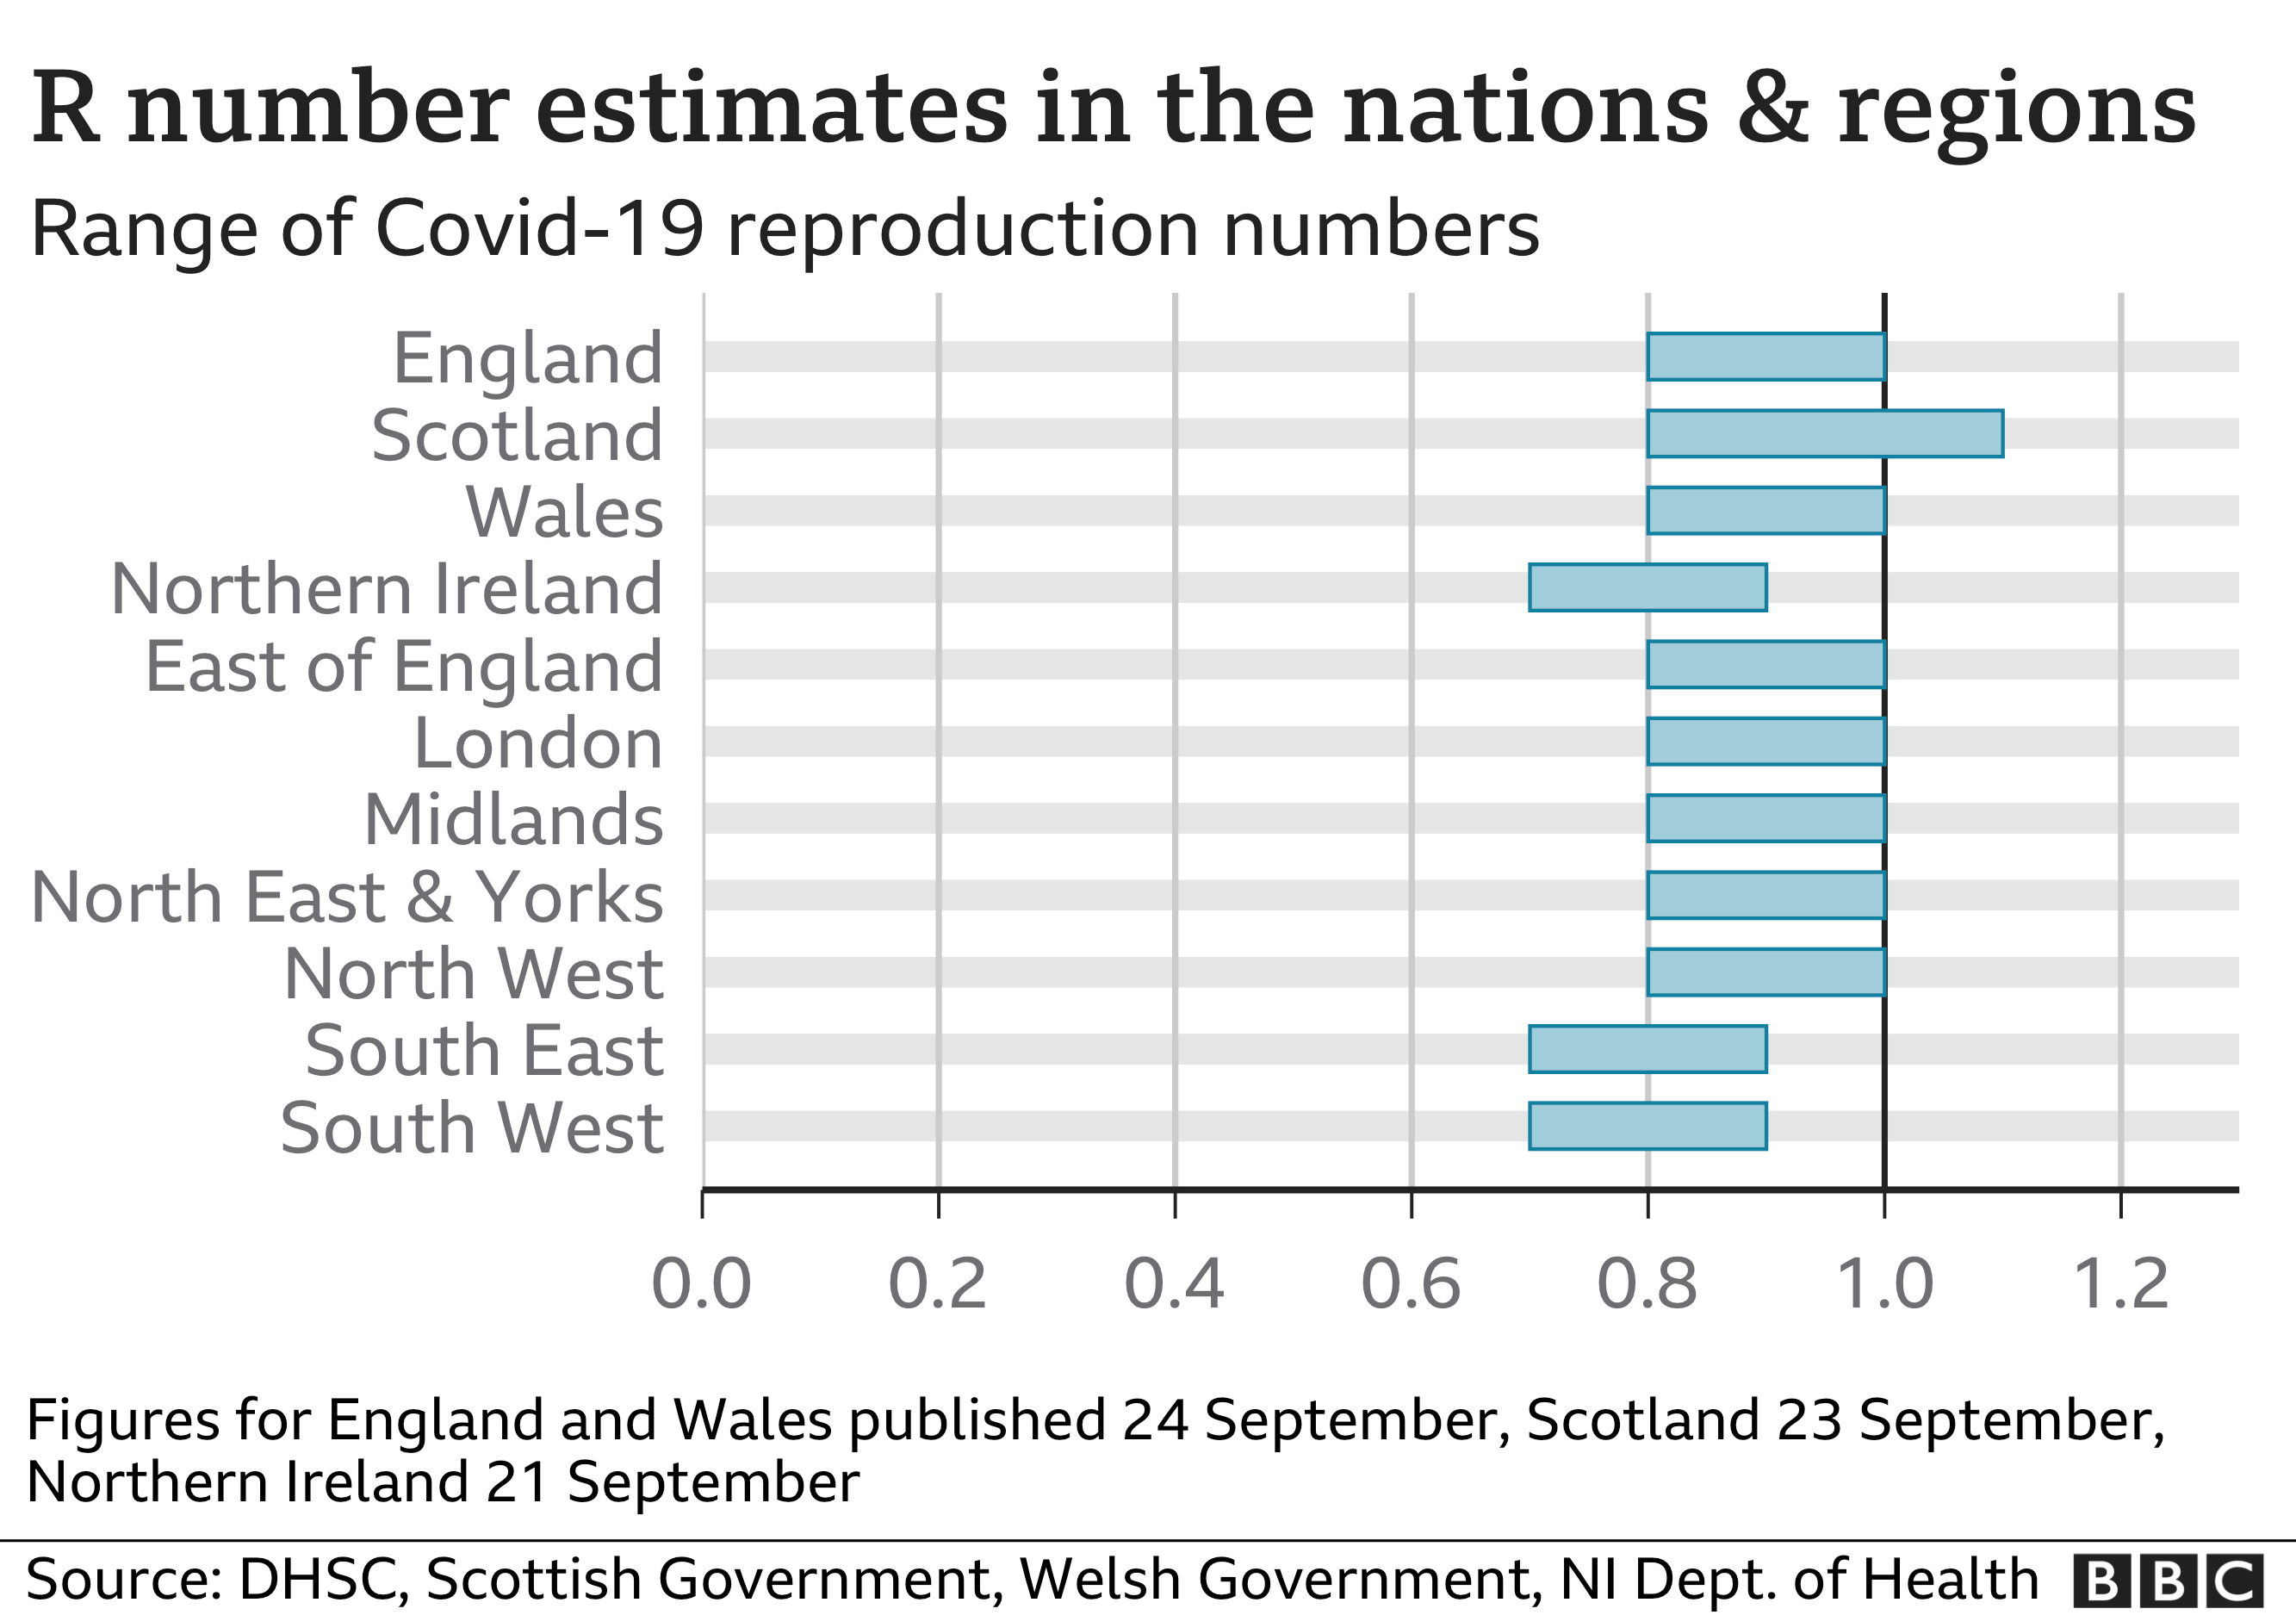
What is the R number?
The "R number" is the average number of people an infected person will pass the disease on to.
If R is below one, then the number of people contracting the disease will fall; if it is above one, the number will grow.
The government has said in the past that the R number is one of the most important factors in making policy decisions.
The latest R number estimate for England is 0.8 to 1.0, while for Scotland it is 0.8 to 1.1, for Wales it is 0.8 to 1.0 and for Northern Ireland it is 0.7 to 0.9.
Related Topics
- Published
- 5 hours ago
- Published
- 11 August
- Published
- 16 August