0
Comment(s)
*
* The moderation of comments is automated and not cleared manually by indianexpress.com.
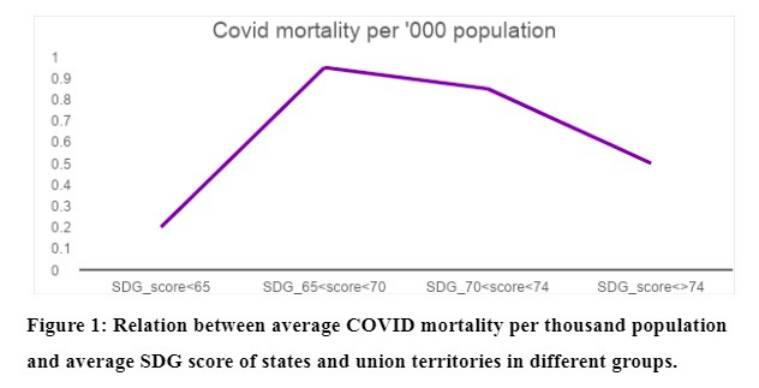
 The death rate is very low (0.2) for the 12 states and UTs with very low SDG score (less than 65), peaked at 0.95 for ones with scores between 65 to 70, then started decreasing to 0.85 for those with scores between 70 to 74 and then to 0.5 for scores above 74.
 Written by Saudamini Das
An Environmental Kuznet Curve (EKC) seems to exist between the Covid mortality rate and Sustainable Development Goal (SDG) scores in India. The United Nations General Assembly had adopted 17 SGDs in the year 2015 with the mission statement, “A blueprint to achieve a better and more sustainable future for all people and the world by 2030”. These goals encompass different facets of wellbeing starting from poverty and hunger to peace, justice and strong institutions. Attainment of these goals is synonymous with good life that ensures environmental, social and economic sustainability. These goals are a global priority and developmental policies of the governments are tuned to address the pre-requisites so that the goal achievements are prioritised and hastened.
The Government of India has fasttracked the SDGs and since 2018, annual SDG scores are being published for different states and Union Territories (UTs) of the country by Niti Aayog. The commitment of both central and state governments to SDG is clearly visible as the scores show a rising trend for almost all units in spite of the Covid pandemic challenges. The overall SDG score for India has gone up from 57 in 2018 to 60 in 2019 and to 66 in 2020, though there is wide discrepancy in scores of the federal units with Bihar (52) at the bottom and Kerala (74) at the top. The silver lining is that almost all states and UTs improved their performance in 2020 as compared to 2019 with the exception of Dadra and Nagar Haveli.
A high score is indicative of a higher level of sustainability and an indicator of better management of the social sector by the administration. A related question is “are high scores better able to control the mortality rates?” The cumulative Covid mortalities in Indian states and UTs till June 15, 2021 — as reported by the Covid-19 Data Repository by the Centre for Systems Science and Engineering (CSSE) at Johns Hopkins University — are compared to their respective SDG scores. As per the JHP data base, the average cumulative deaths per thousand population varied between 0.08 (Mizoram) to 7.1 (Pondicherry) in India. To gain a greater understanding, states and UTs are divided into four categories as per their SDG score and the average death rates are compared. This shows an inverted U relation — as the average score increases, the death rate increases from low to high and then comes down as shown below (Fig.1). The death rate is very low (0.2) for the 12 states and UTs with very low SDG score (less than 65), peaked at 0.95 for ones with scores between 65 to 70, then started decreasing to 0.85 for those with scores between 70 to 74 and then to 0.5 for scores above 74. Though there is discrepancy across states and UTs, the average picture for groups confirms the ability of high-scorer states/UTs to have been better able to control the pandemic deaths.
This relation becomes all the more pronounced when the 95 per cent confidence interval of predicted mortality is plotted against the difference in scores of the states between 2018 and 2020 (Fig.2).
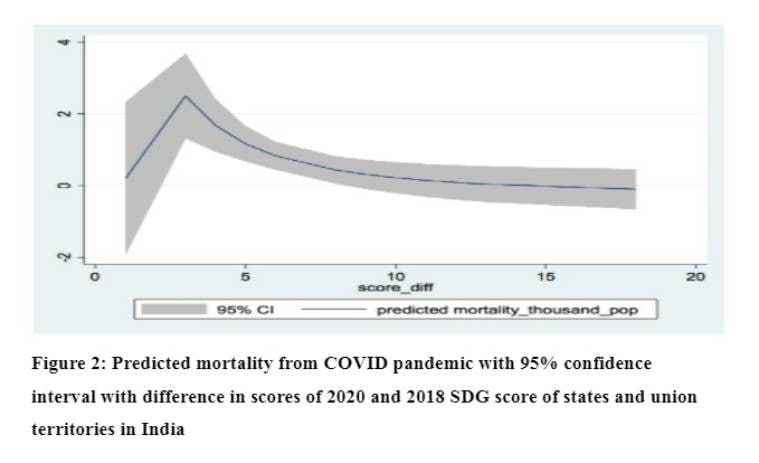
States attaining a high score in 2020 compared to their achievement in 2018, depict much lower predicted deaths and this relation, though has an inverted u-shape like the previous picture, is sharper and goes down monotonically for score differences more than 3.5. Thus, investing in sustainable development goals seems to be helping the states to better manage the pandemic, which is an indicator of sustainability.
The writer is professor at Institute of Economic Growth, Delhi
