Havells India Ltd has been an underperformer so far in 2021 largely on account of COVID-related lockdown which slowed the demand for the consumer electronics segment.
Shares of Havells India are up by about 12 percent so far in 2021, compared to the over 13 percent rally seen in Nifty50, and 15 percent gain seen in the BSE 100 index in the same period.
However, on a 1-year basis, the stock rose 75 percent compared to the 47 percent gain seen in Nifty50.
It hit a fresh 52-week high of Rs 1237.80 on the BSE on 17 February 2021, and since then, has been consolidating. But, technical charts suggest that the stock could make an attempt to retest the 52-week high.
The stock is trading well above the 5,10, 20,50, and 200-Days Moving Average. Investors can look at going long at current levels for an immediate target of Rs 1,100, and the next target will be in the range of Rs 1,200-1,230. This translates into an upside of over 17 percent from the 5 July price of Rs 1,022.
Havells India Limited is a leading Fast Moving Electrical Goods (FMEG) company and a major power distribution equipment manufacturer with a strong global presence.
The consumer electricals sector reported strong growth in the March quarter supported by robust demand, channel filling ahead of the peak summer season, and cost control, which helped offset commodity price inflation.
A positive earnings surprise was as also seen in Havells India. “Havells Q4 FY21 performance was ahead of our expectations supported by better than estimated performance in the core business,” Antique Stock Broking said in a note.
“Market share gains from unorganised players, increased distribution network and demand pickup in both B2C, as well as B2B segment, has contributed to the estimate beat during the quarter,” it said.
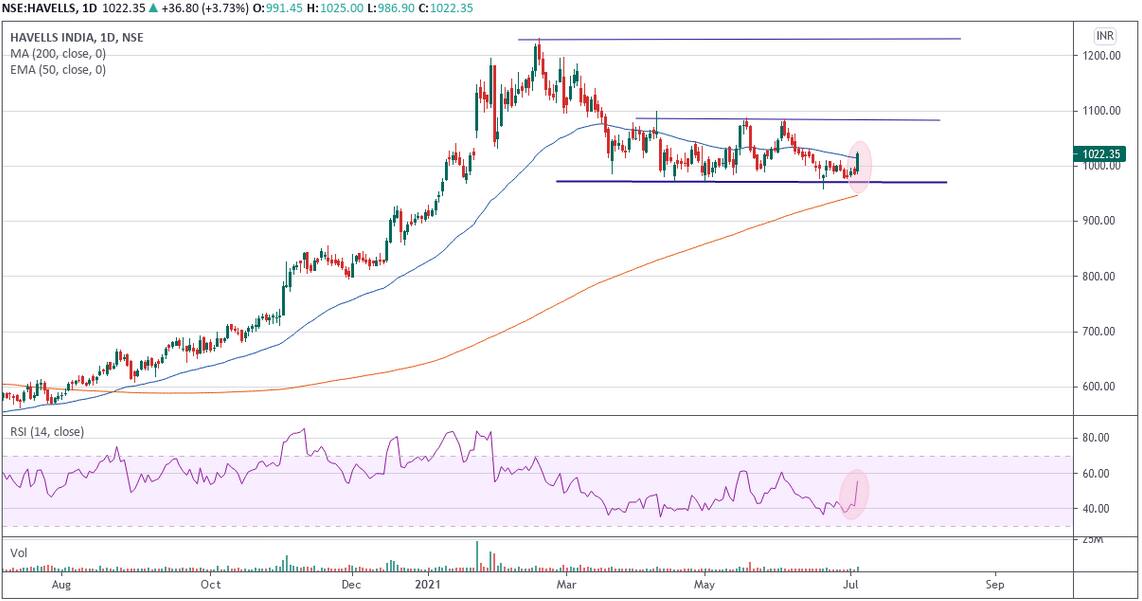
On the technical front, in May 2020, the stock made a low of around Rs 450 level and thereafter has given a tremendous rally to the peak of Rs 1231 level in February 2021 to give a decent appreciation of almost 174%.
“The stock has witnessed a short correction thereafter and has consolidated near Rs 1000 level in the past the 3-4 months to indicate stability and accumulation. The daily chart has indicated strong support near Rs 970 zone and has maintained above the significant 200DMA level which lies near Rs 945 level,” Vaishali Parekh, Assistant Vice President - Technical Research at Prabhudas Lilladher Pvt. Ltd said.
“Currently, the stock has given a bullish candle pattern to improve the bias and just move past the important 50EMA level of Rs 1015 and is anticipated to carry on the momentum in the coming days,” she added.
At this stage, technically, the chart looks attractive for fresh entry and can be a good choice for investment purposes for a time frame of 2-3 months, recommends Parekh.
The indicator RSI is currently well placed and has indicated a trend reversal from the highly oversold zone to signal a buy and thereby, justifies our view of a positive outlook for the stock.
“We suggest to buy and accumulate the stock for an upside 1st target of Rs 1100 and thereafter further improvised move would take it to the 2nd target of around Rs 1200-1230 levels,” she added.
Disclaimer: The views and investment tips expressed by experts on Moneycontrol.com are their own and not those of the website or its management. Moneycontrol.com advises users to check with certified experts before taking any investment decisions.